DOI: 10.30954/0424-2513.2018.00150.27
©2018 New Delhi Publishers. All rights reserved
Economic Analysis of Pecan Nut Production: An Application of
Input Oriented DEA Model
Pawan Kumar Sharma and Sudhakar Dwivedi*
Division of Agricultural Economics & ABM, SKUAST-J, Main Campus, Chatha, Jammu, (J&K), India *Corresponding author: [email protected]
ABSTRACT
The economics of pecan nut production in Poonch district of Jammu & Kashmir state was assessed using input oriented DEA model. The NPV and profitability index were positive and the internal rate of return (IRR) was 14 per cent, which shows that investing in pecan nut orchard will be a profitable venture until the market interest rate remains below 14 per cent. The results of input oriented model revealed that growers were efficient in terms of pecan nut production at the given level of inputs, with mean overall technical efficiency of 0.922, mean pure technical efficiency of 0.961 and mean scale efficiency of 0.959. The mean allocative and cost efficiencies were 0.718 and 0.665, respectively. The level of input use in pecan nut was extremely low and if inputs are increased, the output would increase more than the use of inputs. The average allocative and cost efficiency of pecan nut growers was less than the average technical efficiency, which shows that pecan nut growers were relatively more technical than cost efficient. Keywords: Pecan nut, Data Envelopment Analysis, cost efficiency, technical efficiency, IRR, NPV, Profitability index
Jammu and Kashmir (J&K) state of India is a hilly state with varied topography and great diversity in cultural, social and economic practices. Within Jammu and Kashmir state, Jammu region itself is a home to large diversity in physiographic features; cultural richness and agro-climatic variations. Such diversity in climatic conditions provide ample opportunity for production of unique crops. Pecan nut tree is a large, beautiful tree that produces bountiful crops of delicious nuts. The largest member of the hickory family, pecan trees often grow to a height of over 70 feet with a spread of greater than 80 feet. Ares et al. (2006) studied production and economics of native pecan silvopastures in central United States and found that the nut crop had a pattern of biennial bearing with a mean tree age of 37 years and forage production varied between 1500 and 4600 kg DM ha-1. Ferencz
and Notari (2010) found that the payback period was extremely long for canopy form; the SX spindle in Pecan nut orchard due to the high historical cost.
The rate of returns was very unfavourable and low annual income determined weak profitability. Springer et al. (2011) determined that an irrigated improved pecan orchard was economical and they found that the improved pecan orchard is more profitable than competitive enterprises after a twenty-year time frame, but is sensitive to pecan price, pecan yield and attitude toward risk. Benucci
et al. (2012) also studied mycorrhizal inoculation
of pecan seedlings with some marketable truffles. Pecan nut in Poonch district is one of the unique products grown in Jammu region of Jammu & Kashmir state of India. Pecan nut is exclusively grown in Poonch district of Jammu region of the state. Poonch is located on the Southern slopes of the Pir Panjal range and as such is rugged with spurs and valleys. It lies between 330 25’ to 34010’
North latitude and 730 58’ to 740 35’ East longitude.
The present investigation was undertaken to analyse the economics of pecan nut production and to assess the economic efficiency using input oriented DEA model under intermediate hills of Poonch district of Jammu & Kashmir state of India.
MATERIALS AND METHODS
The district Poonch having maximum area under pecan nut in Jammu region of Jammu & Kashmir state was purposively selected for the present study. The cost, production and return data were collected for assessing capital investment, resource use and profitability index of pecan nut crop in the year 2014-15. A list of pecan nut growers in the Poonch district was procured from the office of Chief Horticulture Officer, Poonch and 50 farmers from the list were selected randomly without replacement for collecting the requisite data.
The Model
Data Envelopment Analysis (Input oriented DEA Model)
Data Envelopment Analysis (DEA) was first proposed by Charnes, Cooper and Rhodes (1978) as an evaluation tool to measure and compare the productivity of individual production unit. It constructs a non-parametric envelopment frontier over the data points such that all observed points lie on or below the production frontier. It provides the calculation of:
technical and scale efficiencies through CRS (Charnes, Cooper and Rhodes; 1978) and VRS (Banker, Charnes and Cooper; 1984) and also of
cost and allocative efficiencies.
These can be either input oriented technical efficiency (TE) measure (by how much can input quantities be proportionally reduced without changing the output quantities produced) or output oriented technical efficiency (TE) measure (by how much can output quantities be proportionally expanded without altering the input quantities used).
To estimate the efficiencies, input oriented DEA model was used. The input-oriented model controls the output and contracts the input as far as possible, thus an inefficient unit enveloped below the optimum. An inefficient unit is made efficient
through the proportional reduction of its inputs, keeping its output proportions constant.
Input oriented DEA model with constant returns to scale
Technical efficiency has been estimated as the ratio of sum of weighed outputs to sum of weighed inputs (Cooper et al. 2006) by converting the ratio into a linear programming problem as proposed by Charnes, Cooper and Rhodes (1978) and known as CCR model. The primal of the model has been presented as below:
1
. o
jo
q
j p p
p
Max e u y
=
=
∑
Subject to,
1
1
jo
m
i i i
V X
=
=
∑
1 1
0
j j
q m
p p i i
p i
u y V X
= − = ≤
∑
∑
Where, up, vi ≥ ε
i = number of inputs (1 to m)
p = number of outputs (there is only one output in present study)
j = number of farms (1 to n)
xij0 = vector of level of the ith input being used
by the farm ‘0’
xij = level of use of ith input on jth farm
vi = weight attached to input ‘i’ up = Weight attached to output ‘p’ ypj = quantity of output ‘p’ for unit ‘j’ ej0 = Efficiency score
In order to solve the above LP problem, it has been converted to its duality as follows:
. jo o
Min e =θ
Subject to,
1
0 1
0
0
0; 0; 0
o j
jo j
j j
n
p j p
j n
i j i
j
j i p
y y
x x
x y
λ
θ λ
λ
=
=
− + ≥
− ≥
≥ ≥ ≥
θ = Technical efficiency of farm ‘0’ λj = Weights in LP analysis
xij ,yp.j ≥ 0
Input oriented DEA model with variable Return to Scale
Pure technical or physical efficiency has been estimated through input oriented VRS model as proposed by Banker, Charnes and Cooper; 1978; known as BCC model and has been presented as below:
0 0
. j
Min e =θ
Subject to, 0 0 1 0 1 1 0 0 1
0; 0; 0
j
j j
j
n
p j p
j n
i j i
j n
j j
j ij p
y y x y x y λ θ λ λ λ = = = − + ≥ − ≥ = ≥ ≥ ≥
∑
∑
∑
The model is similar to CCR except that the sum of weights assumed to be equal to one, which is nothing but the convexity constraint for specifying the model as varying return to scale (VRS).
Calculation of allocative efficiency
The allocative efficiency signifies the use of inputs in the correct proportion reflecting their marginal costs. It focuses on the ability of an economic unit to minimize the cost of production for a given set of input prices by substituting or reallocating inputs and defined as the ratio of economic efficiency (cost efficiency) to the technical efficiency.
The economic efficiency has been estimated by employing cost minimization Data Envelopment Analysis (DEA) and by using the price of inputs. The linear programming form of this model has been presented as below:
. io io
Minθ C
Subject to, 1 1 0 0 0 o j o j n
p j p
j n
i j i
j j y y y λ θ λ λ = = − + ≥ − ≥ ≥
∑
∑
Where, Ci0 = vector of input prices for farm ‘0’ θi0 = cost minimizing vector of input quantities for farm ‘0’
Scale Efficiency
The scale efficiency considers the optimal size of the establishment to minimize long-run costs. This has been estimated as the ratio of technical efficiency of CCR to technical efficiency of BCC score, i.e.:
Scale efficiency = CCR BBC
TE TE
The DEAP Version 2.1 of “The University of New England” was used to estimate economic efficiencies by conducting Data Envelopment Analysis.
Frequency distribution and categorization of predicted efficiencies
The frequency distribution and binning of predicted cost efficiencies were done using Doane’s formula as depicted below:
( )
1 1
1 log log 1
g g k n σ = + + +
Where g1 = estimated 3rd moment skewness of the
distribution and,
(
)
(
)(
)
1 6 2 1 3 g n n n σ = − + +This particular formula was applied for determining the number of bins as the predicted efficiencies was not found to be normally distributed.
The number of bins decided using Doane’s formula was then categorized using Singh’s cube root method (Singh, 1975) and the respondent farmers were divided into categories with low, medium and high level of efficiencies. The formula used for categorization has been presented as below:
1 1
1 3 i
i
N C
S L h
f
− −
= + ×
Where,
S1 = segment (e.g. I, II and III)
Ci-1 = cumulative frequency of the class preceding to the quartile class
f = frequency
h = width of the quartile class
N = total cumulative cube root of frequencies
RESULTS AND DISCUSSION
Descriptive statistics of socio-economic characteristics of pecan nut growers
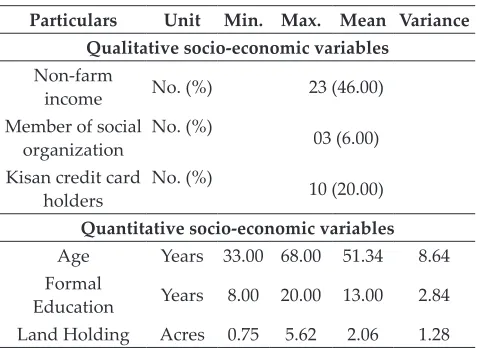
The main socio-economic indicators of pecan nut growers studied in context of the present study include age, formal education, land holding, non-farm income (dummy variable), member of social organization (dummy variable) and kisan credit card holders (dummy variable). The descriptive statistics of both qualitative and quantitative socio-economic variables of pecan nut growers has been presented in Table 1. The average age of sampled growers was 51.34 years with minimum of 33 years and maximum of 68 years. The average formal education of sampled pecan nut growers was 13 years with minimum of eight and maximum of 20 years. The average size of land holding was 2.06 acres with minimum of 0.75 acres and maximum of 5.62 acres.
Table 1: Descriptive statistics of socio-economic characteristics (n = 50)
Particulars Unit Min. Max. Mean Variance Qualitative socio-economic variables
Non-farm
income No. (%) 23 (46.00) Member of social
organization No. (%) 03 (6.00) Kisan credit card
holders No. (%) 10 (20.00) Quantitative socio-economic variables Age Years 33.00 68.00 51.34 8.64 Formal
Education Years 8.00 20.00 13.00 2.84 Land Holding Acres 0.75 5.62 2.06 1.28
Descriptive statistics of inputs and output in pecan nut production
The descriptive statistics of inputs and output related to pecan nut production in the study area has been presented in Table 2. The mean area under sampled pecan nut orchards was 1.57 with
minimum area of 0.62 and maximum of 3.50 acres per farm. The average number of trees in the sampled farms was 5.42 with minimum of three and maximum of 10 trees per farm. The average human labour days used was 154.28 with minimum of 113.76 and maximum of 204.04 days. The average production of pecan nut under sampled farms was 6.37 quintals with minimum of 3.30 and maximum of 11.75 quintals per farm.
Table 2: Descriptive statistics of major inputs and output of Pecan nut
Particulars Unit Min. Max. Mean Variance Descriptive statistics of quantity of inputs and output Area under
Pecan nut acres 0.62 3.50 1.57 0.41 No. of trees number 3.00 10.00 5.42 2.86
Human labour days 113.76 204.04 154.28 458.82
Yield quintals 3.30 11.75 6.37 3.80
Descriptive statistics of cost of inputs Cost of land ` 4,868 32,000 12434 6016
Cost of trees ` 60 230 121 32
Cost of human
labour ` 36,104 54519 42599 4049 Total cost ` 2,58,438 1464598 594704 264633
The average cost of land for sampled pecan nut orchards was ` 12,434 with minimum of ` 4,868 and maximum of ` 32,000. The average cost of pecan nut trees in sampled orchards was ` 121 with minimum of ` 60 and maximum of ` 230 per farm. The average cost of human labour under sampled orchards was
` 42,599 with minimum of ` 36,104 and maximum of ` 54,519. The estimated mean total cost of pecan nut production in the sampled area over a period of 44 years was ` 5, 94,704 with minimum of ` 2, 58,438 and maximum of ` 14, 64,598.
Capital appraisal of pecan nut production
of return of pecan nut orchard was 14 per cent. The land remained idle for 7 to 8 years and thus the fixed cost constituted a very high share of total cost of pecan nut production. The net present value was quite high and was ` 42, 40,141 at 8 per cent discount rate. It was reduced to ` 19, 63,808 at 10 per cent discount rate and further reduced to Rs. 6, 65,621 at 12 per cent discount rate. The NPV was positive for pecan nut orchard for a period of 44 years, which shows that farmers can rely on this crop for getting long term returns. Similarly, the profitability index was also positive for pecan nut orchard at different discount rates considered for the present study. The internal rate of return (IRR) was 14 per cent. If the interest rate is below 14 per cent, the money invested in pecan nut will yield more returns than the money kept in the bank.
Table 3: Capital appraisal of pecan nut orchard
Measures of
Investment Discount rate @ 8%
Discount rate @ 10%
Discount rate @ 12% Pay-back period
(years) 21.14 23.61 28.22
Net present value (`) 42,40,141 19,63,808 6,65,621 Profitability index 10.75 5.52 2.53
PI-1 9.75 4.52 1.53
Internal rate of return
(IRR) 14%
Economic efficiency of pecan nut production under input oriented DEA model
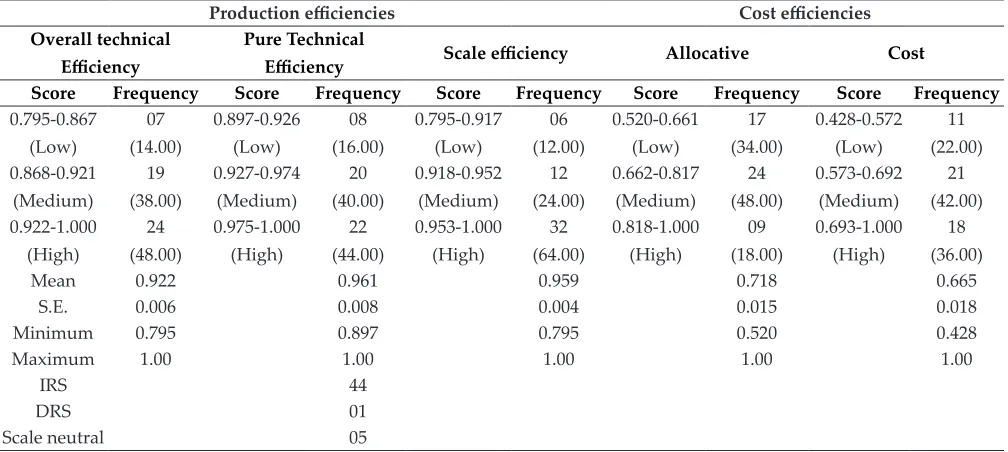
The efficient farm defined the efficient frontier, which represents the best practices combining human labour, area under pecan and plant population to produce the maximum pecan nut output possible. The given output level is produced with minimum quantity of inputs by the efficient farm as compared to other counterparts who had been deemed inefficient. The estimated production and cost efficiencies of pecan nut production under input oriented model have been presented in Table 4. The mean overall technical efficiency of sampled respondents was 0.922 whereas the mean pure technical efficiency was 0.961. The mean scale efficiency was 0.959. 44 (88%) and only (2%) farmers were operating under increasing returns to scale (IRS) and decreasing returns to scale (DRS) respectively. The mean allocative and cost efficiencies were 0.718 and 0.665 respectively. The allocative efficiency ranged between 0.520 to 1 and cost efficiency ranged from 0.428 to 1. The strata for frequency distribution were framed using statistical software and methods proposed by Singh (1975) and Doane and Seward (2011).
The estimated input oriented efficiencies in pecan nut production has also been represented graphically through histograms (Fig. 1).
Table 4: Frequency distribution of production and cost efficiencies of pecan nut under input oriented DEA model (n=50)
Production efficiencies Cost efficiencies
Overall technical Efficiency
Pure Technical
Efficiency Scale efficiency Allocative Cost
Score Frequency Score Frequency Score Frequency Score Frequency Score Frequency
0.795-0.867 (Low)
07 (14.00)
0.897-0.926 (Low)
08 (16.00)
0.795-0.917 (Low)
06 (12.00)
0.520-0.661 (Low)
17 (34.00)
0.428-0.572 (Low)
11 (22.00) 0.868-0.921
(Medium)
19 (38.00)
0.927-0.974 (Medium)
20 (40.00)
0.918-0.952 (Medium)
12 (24.00)
0.662-0.817 (Medium)
24 (48.00)
0.573-0.692 (Medium)
21 (42.00) 0.922-1.000
(High)
24 (48.00)
0.975-1.000 (High)
22 (44.00)
0.953-1.000 (High)
32 (64.00)
0.818-1.000 (High)
09 (18.00)
0.693-1.000 (High)
18 (36.00)
Mean 0.922 0.961 0.959 0.718 0.665
S.E. 0.006 0.008 0.004 0.015 0.018
Minimum 0.795 0.897 0.795 0.520 0.428
Maximum 1.00 1.00 1.00 1.00 1.00
IRS 44
DRS 01
Scale neutral 05
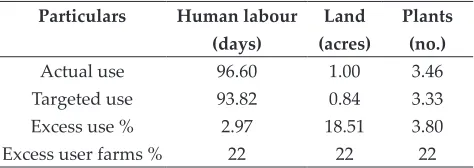
Optimization of input use in pecan nut production
The BCC model helps us to identify optimum quantities of input use for a particular quantity of output. The Table 5 presented the quantities of different inputs used excessively in per acre of pecan nut production. The actual use of human labour was 96.60 days, whereas the targeted use was 93.82. Similarly, the actual use of land was 1 acre, whereas targeted use was 0.84 and the actual trees planted were 3.46, whereas the same output can be produced with 3.33 plants per acre.
Table 5: Excess use of inputs in pecan nut production (per acre)
Particulars Human labour (days)
Land (acres)
Plants (no.)
Actual use 96.60 1.00 3.46
Targeted use 93.82 0.84 3.33
Excess use % 2.97 18.51 3.80
Excess user farms % 22 22 22
REFERENCES
Ares, A., Reid, W. and Brauer, D. 2006. Production and economics of native pecan silvopastures in central United States. Agroforestry Systems, 66: 205-215.
Banker, R.D., Charnes, A. and Cooper, W.W. 1984. Some models for estimating technical and scale inefficiencies in data envelopment analysis. Management Science, 30: 1078-1092.
Benucci, G.M.N., Bonito, G., Falini, L.B., Bencivenga, M. and Donnini, D. 2012. Mycorrhizal inoculation of pecan seedlings with some marketable truffles. Acta Mycologica, 47(2): 179–184.
Charnes, A., Cooper, W. and Rhodes, E. 1978. Measuring the efficiency of decision making units. European Journal of Operational Research, 3: 429-444.
Cooper, W.W., Seiford, L.M. and Tone, K. 2006. Introduction to DEA and its uses with DEA-Solver software and references. New York: Springer.
Doane, D.P. and Seward, L.E. 2011. Measuring Skewness: A Forgotten Statistic? Journal of Statistics Education, 19(2): 1-17.
Economic Survey, 2014-15. Jammu & Kashmir, Directorate of Economics & Statistics, Planning and Development Department, Government of Jammu & Kashmir.
Ferencz, A. and Notari, M. 2010. Evaluation of organization and economics of regional apple orchard. Acta Technica Corviniensis -Bulletin of Engineering, 3(III): 121-123. Singh, R. 1975. Optimum stratification for proportional
allocation. SANKHYA, 37: 109-115.
Springer, J., Swinford, W. and Rohla, C. 2011. Profitability of Irrigated Improved Pecan Orchards in the Southern Plains, Selected Paper prepared for presentation at the Southern Agricultural Economics Association Annual Meeting, Corpus Christi, TX, February 5-8, 2011.