University of Pennsylvania
ScholarlyCommons
Publicly Accessible Penn Dissertations
1-1-2013
RNA and DNA Sequence Analysis of the Human
Transcriptome
Jonathan M. Toung
University of Pennsylvania, [email protected]
Follow this and additional works at:http://repository.upenn.edu/edissertations Part of theBioinformatics Commons, and theGenetics Commons
This paper is posted at ScholarlyCommons.http://repository.upenn.edu/edissertations/709 For more information, please [email protected].
Recommended Citation
Toung, Jonathan M., "RNA and DNA Sequence Analysis of the Human Transcriptome" (2013).Publicly Accessible Penn Dissertations. 709.
RNA and DNA Sequence Analysis of the Human Transcriptome
Abstract
The manifestation of phenotype at the cellular and organismal level is determined in large part by gene expression, or the transcription of DNA into RNA. As such, the study of the transcriptome, or the characterization and quantification of all RNA produced in the cell, is important. Recent advances in sequencing technology have allowed for unprecedented interrogation of the transcriptome at
single-nucleotide resolution. In the first part of this thesis, we use RNA-Sequencing (RNA-Seq) to study the human B-cell transcriptome and determine the experimental parameters necessary for sequencing-based studies of gene expression. We discover that deep sequencing is necessary to detect fully and quantify accurately the complexity of human transcriptomes. Furthermore, we find that at high sequencing depths, the vast majority of transcribed elements in human B-cells are detected.
In the second part of this thesis, we utilize the sequence information provided by RNA-Seq to analyze systematic differences between DNA and RNA sequence. The transmission of information from DNA to RNA is a critical process and is expected to occur in a one-to-one fashion. By comparing the DNA sequence to RNA sequence of the same individuals, we found all 12 types of RNA-DNA sequence differences (RDDs), the majority of which cannot be explained by known mechanisms such as RNA editing or transcriptional infidelity. We developed computational methods to robustly identify RDDs and control for false positives resulting from genotyping, sequencing, and alignment error. Finally, we explore the genetic basis of RDD levels, or the proportion of reads at a site bearing the sequence difference allele. In particular, we analyzed the levels of RNA editing in unrelated and related individuals and found that a significant portion of individual variation in A-to-G editing levels contains a genetic component.
In summary, our results demonstrate that RNA-Seq is a powerful technique for comprehensive and quantitative analysis of gene expression. In addition, the resolution offered by RNA-Seq enables a detailed view of sequence differences between RNA and DNA. Future work will focus on understanding the mechanisms and factors influencing RDDs. Our results suggest that RDD levels may be considered a quantitative and heritable phenotype; as such, a genetic approach may be a sensible method for finding the determinants and mechanism of RDDs.
Degree Type Dissertation
Degree Name
Doctor of Philosophy (PhD)
Graduate Group
Second Advisor Nancy Zhang
Keywords
Computational biology, Genome analysis, Next-generation sequencing, RNA Editing, RNA-Sequencing, Transcriptome analysis
Subject Categories Bioinformatics | Genetics
RNA AND DNA SEQUENCE ANALYSIS
OF THE HUMAN TRANSCRIPTOME
Jonathan M. Toung
A DISSERTATION
in
Genomics and Computational Biology
Presented to the Faculties of the University of Pennsylvania in
Partial Fulfillment of the Requirements for the Degree of Doctor of Philosophy
2013
_______________________________ Frederic Bushman
Professor of Microbiology Supervisor of Dissertation
_______________________________ Nancy Zhang
Professor of Statistics
Co-supervisor of Dissertation
_______________________________ Maja Bucan
Professor of Genetics Graduate Group Chairperson
Dissertation Committee:
ii
Dedication
Acknowledgements
While many a times it has felt that the pursuit of this degree has been a solitary
and singular effort, I would be foolish to not acknowledge the many people that have
helped me tremendously along the way.
This journey began by Dr. Ponzy Lu intermittently badgering me to pursue a Ph.D
since the first time I sought out his advice as a freshman in the fall of 2006. My
undergraduate mentor, thesis committee member, and life coach – I am truly indebted to
your tireless support of me.
I thank Dr. Vivian Cheung for her support of my studies. I thank Michael Morley
for teaching me all there is to know about bioinformatics and programming. Much of
what I have accomplished today computationally would not have been possible without
your help. Thank you Dr. Isabel Xiaorong Wang. I truly appreciate your willingness to sit
me down in your office and help with my committee meetings, my papers, my public
talks. I thank past and present members of the Cheung lab for their help and support:
Wendy Ankener, Will Bernal, Lauren Brady, Alan Bruzel, Jim Devlin, Susannah Elwyn,
Brittany Gregory, Anna Lee, Sen Sen Liu, Yaojuan Liu, Colleen McGarry, Allison
Richards, and Elizabeth So.
I would not have been able to complete this degree had it not been for individuals
who saw a precarious situation and did everything in their power to rectify it. Dr. Rick
iv
throughout the situation to make sure I could progress and move on with my studies.
Your statistical insights into the project have always been inspiring, and I am truly
grateful to have learned so much from you.
Dr. John Hogenesch, you have been a tremendous help for my last paper. Your
encouragement and advice on how to deal with the situation was invaluable. Dr. Greg
Grant, chapter 4 would not have been possible without you. Thank you for your advice
and devotion to the project.
To members of my committee, Dr. Greg Grant, Dr. Shane T. Jensen, Dr. Tom
Jongens, Dr. Ponzy Lu, Dr. Nancy Zhang and members of my academic review
committee, Dr. Maja Bucan, Dr. Rick Bushman, and Dr. John Hogenesch – thank you all
for getting me through this wild ride.
Thank you Dr. Warren Ewens and Dr. Mingyao Li for your help and guidance on
my studies.
Thank you to everyone in the Genomics and Computational Biology program. A
special thanks to Hannah Chervitz and all that you do to make our lives easier as
students.
To my parents, thank you for your support and lessons to never give up. I’m glad
we made it through another journey.
And lastly, to my dear girlfriend Esther. You deserve this degree as much as I do.
You have put up with a lot in the past three years. It has been an emotional roller coaster
and you have been with me every step of the way. Here’s to better days ahead.
Someone once told me the wise saying that life is never as good as you imagine it
ABSTRACT
RNA AND DNA-SEQUENCE ANALYSIS
OF THE HUMAN TRANSCRIPTOME
Jonathan M. Toung
Frederic Bushman
Nancy Zhang
The manifestation of phenotype at the cellular and organismal level is
determined in large part by gene expression, or the transcription of DNA into RNA. As
such, the study of the transcriptome, or the characterization and quantification of all RNA
produced in the cell, is important. Recent advances in sequencing technology have
allowed for unprecedented interrogation of the transcriptome at single-nucleotide
resolution. In the first part of this thesis, we use RNA-Sequencing (RNA-Seq) to study
the human B-cell transcriptome and determine the experimental parameters necessary for
sequencing-based studies of gene expression. We discover that deep sequencing is
necessary to detect fully and quantify accurately the complexity of human transcriptomes.
Furthermore, we find that at high sequencing depths, the vast majority of transcribed
elements in human B-cells are detected.
vi
same individuals, we found all 12 types of RNA-DNA sequence differences (RDDs), the
majority of which cannot be explained by known mechanisms such as RNA editing or
transcriptional infidelity. We developed computational methods to robustly identify
RDDs and control for false positives resulting from genotyping, sequencing, and
alignment error. Finally, we explore the genetic basis of RDD levels, or the proportion of
reads at a site bearing the sequence difference allele. In particular, we analyzed the levels
of RNA editing in unrelated and related individuals and found that a significant portion of
individual variation in A-to-G editing levels contains a genetic component.
In summary, our results demonstrate that RNA-Seq is a powerful technique for
comprehensive and quantitative analysis of gene expression. In addition, the resolution
offered by RNA-Seq enables a detailed view of sequence differences between RNA and
DNA. Future work will focus on understanding the mechanisms and factors influencing
RDDs. Our results suggest that RDD levels may be considered a quantitative and
heritable phenotype; as such, a genetic approach may be a sensible method for finding the
Table of Contents
Dedication ... ii
Acknowledgements ... iii
ABSTRACT ... v
Table of Contents ... vii
List of Tables ... x
List of Figures ... xii
Chapter 1. Introduction ... 1
1.1 The study of the transcriptome ... 1
1.2 Hybridization- and sequencing-based methods for transcriptome analysis ... 3
1.3 Next-generation sequencing methods for transcriptome analysis ... 5
1.3.1 Library preparation and sequencing ... 7
1.3.2 Genome assembly and alignment ... 8
1.3.3 Transcriptome assembly and alignment ... 10
1.3.4 Variant and genotype calling ... 13
1.3.5 Gene expression profiling ... 17
1.4 RNA-DNA sequence differences ... 18
1.4.1 Transcriptional infidelity ... 18
1.4.2 RNA editing ... 19
1.4.3 Other types of RNA-DNA sequence differences ... 24
1.5 Summary... 27
Chapter 2. RNA-Sequence Analysis of Human B-Cells ... 29
2.1 Abstract... 29
2.2 Introduction ... 31
2.3 Results ... 33
viii
2.3.6 Effect of sequencing depth on RNA-Seq measurements ... 48
2.3.7 Discovery of novel gene models by RNA-Seq ... 58
2.4 Discussion ... 60
2.5 Materials and Methods ... 63
2.5.1 Samples ... 63
2.5.2 RNA-Sequencing ... 63
2.5.3 Alignment and isoform abundance estimation ... 63
2.5.4 Sampling selection of sequence reads ... 64
2.5.5 RNA-Seq and microarray analyses ... 65
Chapter 3. RNA-DNA Sequence Differences in Humans... 66
3.1 Abstract... 66
3.2 Introduction ... 67
3.3 Results ... 69
3.3.1 RNA and DNA samples ... 69
3.3.2 RNA-DNA sequence differences observed... 73
3.3.3 EST validation of RNA-DNA sequence differences ... 78
3.3.4 Sanger sequencing validation of RNA-DNA sequence differences ... 80
3.3.5 Proteomic evidence for RNA-DNA sequence differences ... 83
3.3.6 Variation in abundance of RNA-DNA sequence differences ... 89
3.3.7 Characteristics of RNA-DNA sequence differences ... 91
3.3.8 Levels of RNA-DNA sequence differences ... 95
3.4 Discussion ... 98
3.5 Materials and Methods ... 101
3.5.1 Samples ... 101
3.5.2 RNA-Sequencing ... 102
3.5.3 Identification of RNA-DNA sequence differences ... 102
3.5.4 EST search for RNA-DNA sequence differences ... 103
3.5.5 Sanger sequencing validation of RNA-DNA sequence differences ... 103
3.5.6 Mass spectrometry analysis of proteome ... 106
Chapter 4. Detection Theory in Identification of RNA-DNA Sequence Differences Using RNA-Sequencing ... 111
4.1 Abstract... 111
4.3 Results ... 115
4.3.1 Simulated RNA-Seq datasets ... 115
4.3.2 Simulated RNA-DNA sequence differences ... 117
4.3.3 Sensitivity of RNA-DNA sequence difference detection ... 122
4.3.4 Correlation between true versus observed RDD levels ... 135
4.3.5 Receiver operating characteristic analysis of RDD detection ... 140
4.3.6 Evaluation of filters in removing false positive RDDs ... 144
4.3.7 Effect of non-random sequencing errors on FDR of RDD detection ... 161
4.3.8 Evaluation of RDDs in human lymphoblastoid cell line ... 162
4.4 Discussion ... 171
4.5 Materials and Methods ... 174
4.5.1 Simulation of RNA-Seq datasets ... 174
4.5.2 Alignment of RNA-Seq datasets ... 175
4.5.3 Simulation of RNA-DNA sequence differences ... 175
4.5.4 Repetitive regions of the genome as defined by BLAT ... 176
4.5.5 Filtering of RNA-DNA sequence differences using BLAT ... 177
4.5.6 Analysis of non-random sequencing errors in experimental RNA-Seq datasets .. 177
Chapter 5. Genetic Basis of RNA-DNA Sequence Differences ... 180
5.1 Abstract... 180
5.2 Introduction ... 182
5.3 Results ... 184
5.3.1 Individual variation in RDD levels among unrelated individuals ... 184
5.3.2 Evaluating the genetic component of individual variation in RDD levels ... 191
5.4 Discussion and Future Directions ... 198
5.5 Materials and Methods ... 200
5.5.1 Samples ... 200
5.5.2 RNA-Sequencing ... 200
5.5.3 Alignment of RNA-Seq datasets ... 203
5.5.4 Assessment of individual variation in RNA-DNA sequence difference levels ... 203
x
List of Tables
Chapter 2. RNA-Sequence Analysis of Human B-Cells
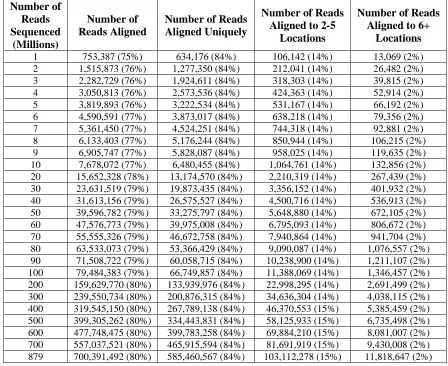
Table 2.1 RNA-Seq alignment results ...35
Chapter 3. RNA-DNA Sequence Differences in Humans Table 3.1 Statistics on RNA-Sequencing and RNA-DNA sequence differences ...71
Table 3.2 Genotypes at monomorphic sites verified by Sanger sequencing ...72
Table 3.3 Selected examples of sites that show RNA-DNA sequence differences in B-cells and EST clones ...77
Table 3.4 Sanger sequencing validation of RNA-DNA sequence difference sites ...81
Table 3.5 Detection of peptides encoding DNA or RNA forms by mass spectrometry in ovarian cancer and leukemia cells at multiple RDD sites ...86
Table 3.6 Peptides encoded by both the DNA and RNA forms ...87
Table 3.7 Most significant gene ontology enrichments for genes containing RDDs ...93
Table 3.8 Location of RNA-DNA sequence differences within genes ...94
Table 3.9 Primer sequences used for Sanger sequencing validation of RDDs ...105
Table 3.10 Primer sequences used for validating the DNA sequences of RDD sites found in peptides ...110
Chapter 4. Detection Theory in Identification of RNA-DNA Sequence Differences Using RNA-Sequencing Table 4.1 Alignment statistics of simulated RNA-Seq datasets ...116
Table 4.2 Summary statistics on distance between neighboring RNA-DNA sequence differences ...121
Table 4.3 Sensitivity of RNA-DNA sequence difference detection versus coverage ....125
Table 4.4 Sensitivity of RDD detection versus the level of sequence difference ...127
Table 4.5 Sensitivity of RDD detection in unique versus non-unique regions as determined by BLAT...132
Table 4.7 Sensitivity of RDD detection versus proximity to nearby RDDs ...134
Table 4.8 Correlation between observed and true levels of RDDs ...137
Table 4.9 Percent of sites where the observed and true levels deviate by more than 30% versus the uniqueness of the underlying site as determined by BLAT ...139
Table 4.10 Receiver operating characteristic analysis of RDD detection ...142
Table 4.11 Percentage of true versus false positive RDDs removed by BLAT filter ...145
Table 4.12 Effect of BLAT filter on false discovery rate of RDD detection ...150
Table 4.13 Effect of removing RDDs in pseudogenes on the false discovery rate of sequence difference detection ...153
Table 4.14 Effect of removing RDDs near exon junctions on the false discovery rate of sequence difference detection ...154
Table 4.15 Percentage of true versus false positives removed by BLAT filter, pseudogene filter, and removal of intronic sites within 6bp of exon junctions ...156
Table 4.16 Effect of BLAT filter, pseudogene filter, and removal of intronic sites within 6 bp of exon junctions on FDR of RDD detection ...159
Table 4.17 Alignment statistics for GM12878 RNA-Seq dataset...163
Table 4.18 RNA-DNA sequence differences found in GM12878 ...164
Table 4.19 Number of RDDs removed by various bioinformatics filters...167
Chapter 5. Genetic Basis of RNA-DNA Sequence Differences Table 5.1 List of top A-to-G RNA editing sites with significant variation in editing levels among 27 unrelated individuals ...186
Table 5.2 List of top A-to-G sites with significant genetic component to individual variation in RNA editing levels among 10 monozygotic twin pairs ...193
xii
List of Figures
Chapter 2. RNA-Sequence Analysis of Human B-Cells
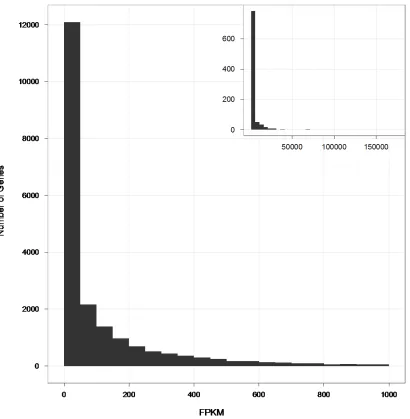
Figure 2.1 Distribution of gene expression levels in human B-cells ...37
Figure 2.2 Percent of genes overlapping various ENCODE gene regulation tracks ...38
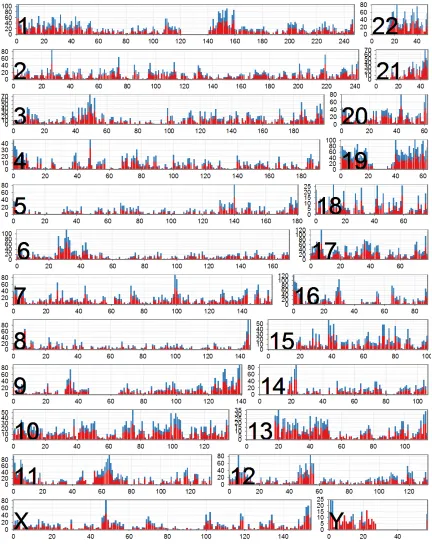
Figure 2.3 Distribution of expressed genes by chromosome ...40
Figure 2.4 Gene density versus percentage of genes transcribed ...41
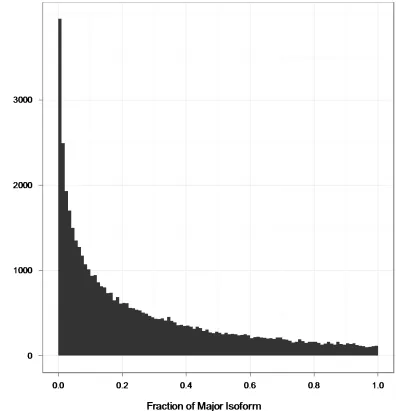
Figure 2.5 Distribution of ‘fraction of major isoform values’ ...44
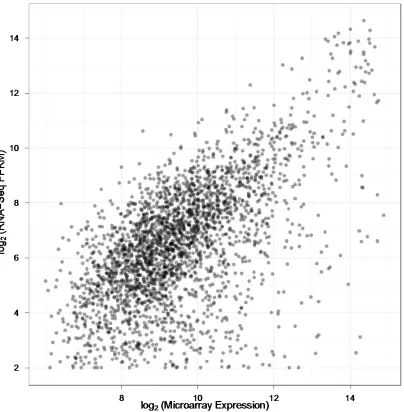
Figure 2.6 Expression values from RNA-Seq and microarrays ...46
Figure 2.7 RNA-Seq and microarray expression values versus coefficient of variation ...47
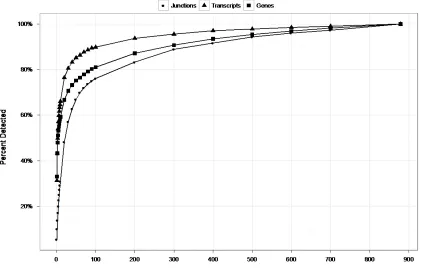
Figure 2.8 Number of junctions, transcripts, and genes detected at different sequencing depths ...49
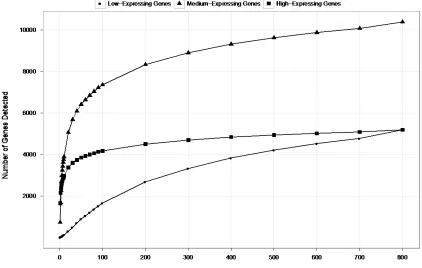
Figure 2.9 Number of genes detected at various sequencing depths ...50
Figure 2.10 Gene expression levels at different sequencing depths ...52
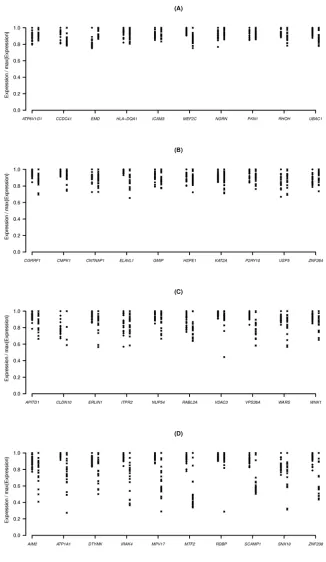
Figure 2.11 Expression levels of PHB versus sequencing depth ...55
Figure 2.12 Expression levels of BRD4 versus sequencing depth ...57
Figure 2.13 Newly identified gene on chromosome 13 ...59
Chapter 3. RNA-DNA Sequence Differences in Humans Figure 3.1 Workflow for the identification of RNA-DNA sequence differences...75
Figure 3.2 Distribution of RNA-DNA sequence difference events across 27 individuals 76 Figure 3.3 Comparison of A-to-G RNA editing levels in B-cells to those in cell types published by Church and colleagues...79
Figure 3.4 Examples of Sanger sequencing validation of RNA-DNA sequence difference sites ...82
Figure 3.5 Identification of peptides encoded by both RNA and DNA forms ...88
Figure 3.6 Number of RNA-DNA sequence difference events across 27 individuals ...90
Figure 3.7 Distribution of RNA-DNA sequence difference levels ...96
Figure 3.8 Distribution of RDD levels by frequency of event across 27 individuals ...97
Chapter 4. Detection Theory in Identification of RNA-DNA Sequence Differences
Using RNA-Sequencing
Figure 4.1 Total number of simulated RNA-DNA sequence differences ...118
Figure 4.2 Levels of simulated RNA-DNA sequence differences ...120
Figure 4.3 Sensitivity of RNA-DNA sequence difference detection versus coverage ....124
Figure 4.4 Sensitivity of RDD detection versus the sequence difference level ...129
Figure 4.5 Sensitivity of RDD detection versus uniqueness of flanking genomic sequence by BLAT ...131
Figure 4.6 True versus observed levels of RDDs ...136
Figure 4.7 Percentage of sites with observed levels that deviate from true RDD level ..138
Figure 4.8 False discovery rate of RNA-DNA sequence difference detection ...143
Figure 4.9a Percentage of false versus true positive RDDs removed by BLAT filter for dataset 1 ...147
Figure 4.9b Percentage of false versus true positive RDDs removed by BLAT filter for dataset 2 ...148
Figure 4.10 Effect of BLAT filter on false discovery rate of RDD detection ...149
Figure 4.11 Distribution of RNA-DNA sequence differences in GM12878 ...168
Figure 4.12 T-to-G RNA-DNA sequence difference at chr10:102046378 (hg19) ...169
Figure 4.13 Number of properly aligned bases in reads that overlap RDDs ...170
Chapter 5. Genetic Basis of RNA-DNA Sequence Differences Figure 5.1 False discovery rate versus false positive rate for identification of sites with significant individual variation in RDD levels ...185
Figure 5.2 Examples of sites showing significant variation in A-to-G RDD or editing levels among 27 unrelated individuals ...190
Figure 5.3 False discovery rate versus false positive rate for evaluation of genetic basis of RDDs...192
xiv
Figure 5.5 A-to-G editing levels for 10 pairs of monozygotic twins in the 3’ UTR of the
gene EIF2AK2 at chr2:37327662 (hg19) ...195
Figure 5.6 A-to-G editing levels for 10 pairs of monozygotic twins in the 3’ UTR of the
Chapter 1.
Introduction
1.1
The study of the transcriptome
The realization of phenotype at the cellular and organismal level is determined in
large part by a more proximal phenotype – gene expression, or the transcription of DNA
into RNA. As such, the study of the transcriptome, or the characterization and
quantification of all RNA produced in the cell at a given time or under a particular
condition, is critical for a deeper understanding of all biological pathways and processes.
Over the past few decades, the role of complexity at the RNA level in contributing to
disease manifestation and phenotypic variation has become increasingly more apparent
(Cooper et al. 2009; Licatalosi & Darnell 2010). From the point of transcription, RNA is
subject to a wide range of processes such as alternative transcription initiation (Davuluri
et al. 2008; Moore & Proudfoot 2009), alternative polyadenylation (Di Giammartino et
al. 2011; Lutz 2008), alternative splicing (Cooper et al. 2009; Maniatis & Tasic 2002),
RNA editing (Gott & Emeson 2000; Knoop 2011), and other post-transcriptional
modification events (Karijolich & Yu 2011; G. Martin & Keller 2007; Rottman et al.
1994). In recent years, methodological advances in sequencing and bioinformatics have
enabled genome-wide analyses of RNA at unprecedented levels of resolution and depth,
allowing for comprehensive profiles of RNA species and variation (Djebali et al. 2012;
Nagalakshmi et al. 2008). These developments lend insight into the contribution of RNA
2
studies. Next, we examine systematic RNA-DNA sequence differences (RDDs) –
discrepancies between DNA and RNA that may result from RNA editing, transcriptional
infidelity, or other unknown mechanisms. Lastly, we analyze variation in levels of RDD,
or the percentage of transcripts at a particular site that are altered, across unrelated
individuals and assess the degree to which this individual variation is determined by
genetic factors. The studies performed and methodologies used in this thesis demonstrate
the coming of a new age in modern biology where challenges lie not in the procurement
1.2
Hybridization- and sequencing-based methods for transcriptome
analysis
Traditionally, hybridization-based methods such as microarrays were used to
study gene expression and quantify RNA in a global manner (Schena et al. 1995). The
main strategy for hybridization-based approaches involves incubating fluorescently
labeled complementary DNA (cDNA) fragments with microarray chips that are fixed
with oligonucleotide probes containing known target sequences. Gene expression levels
are subsequently quantified by fluorescent detection of the probe-target pairs. Studies
using microarrays have provided key insights into the genetics and regulation of gene
expression (Brem et al. 2002; Morley et al. 2004), cancer biology (Bittner et al. 2000;
Golub et al. 1999), and various biological processes such as cell growth (Iyer et al. 1999)
and the cell cycle (Cho et al. 1998; Cho et al. 2001). Nonetheless, array methodologies
are subject to limitations that include background noise resulting from
cross-hybridization (Okoniewski & Miller 2006), dependence on known targets, and small
dynamic range. Some specialized microarrays have been designed, however, to address
some of these issues, such as the use of genomic tiling microarrays to detect unknown
transcripts (Bertone et al. 2004).
To overcome the disadvantages of hybridization-based approaches, several
sequencing-based methods have been developed to study the transcriptome. In contrast to
4
limitations and generate digital gene expression profiles in a high-throughput manner.
These tag-based methods include serial analysis of gene expression (SAGE) (Velculescu
et al. 1995) cap analysis of gene expression (CAGE) (Kodzius et al. 2006), and massively
parallel signature sequencing (MPSS) (Brenner et al. 2000). In general, these approaches
involve the introduction of recognition sites to the ends of cDNA and cutting by
restriction endonucleases to create tags that can be isolated and cloned for
high-throughput sequencing (Harbers & Carninci 2005). These approaches, however, are
expensive as they rely on Sanger sequencing, and their output is restricted to certain
regions of the transcripts, limiting the analysis of alternatively-spliced isoforms.
Recently, a high-throughput sequencing approach called RNA-Sequencing (RNA-Seq)
has been developed that overcomes many of the shortcomings of hybridization-based
1.3
Next-generation sequencing methods for transcriptome analysis
Apart from providing the scientific community with a reference genome, the
Human Genome Project spurred advancements in sequencing technology. Termed
‘next-generation sequencing technology’, these high-throughput sequencing platforms have
become more readily accessible to researchers within the past decade, replacing the more
expensive capillary sequencing methods and dramatically decreasing the cost of DNA
sequencing (Mardis 2008; Metzker 2010; Shendure & Ji 2008). The ability of
next-generation sequencing methods to provide an unprecedented amount of sequence
information at a relatively low cost has enabled both whole-genome sequencing and de
novo assembly of novel genomes (R. LiW. Fan, et al. 2010; Locke et al. 2011) in addition
to whole-genome re-sequencing of organisms with reference genomes to catalogue and
annotate genetic variants (1000 Genomes Project Consortium 2010; Bentley et al. 2008;
J. I. Kim et al. 2009; Korbel et al. 2007; S. C. Schuster et al. 2010; J. Wang et al. 2008;
Wheeler et al. 2008).
In addition to the direction application of next-generation sequencing to sequencing
of DNA (DNA-Seq), a whole host of sequencing-based assays have been developed
using next-generation sequencing platforms to interrogate genome-wide profiles of
mRNA (Mortazavi et al. 2008; Nagalakshmi et al. 2008), RNA secondary structure
(Kertesz et al. 2010; Underwood et al. 2010), transcription factor binding (X. Chen et al.
6
Seq has revealed insights into the complexity of the transcriptome, uncovering new
classes of small RNA (Lau et al. 2006; Malone & Hannon 2009; Taft et al. 2010),
discovering novel transcripts and gene fusions (Bruno et al. 2010; Levin et al. 2009; Lu et
al. 2010; Maher et al. 2009), and expanding the catalogue of alternatively-spliced
transcripts (Pan et al. 2008; E. T. Wang et al. 2008).
As of this writing, the most commonly used next-generation sequencing platforms
are the Illumina Genome Analyzer (Bentley et al. 2008) and, more recently, the Illumina
HiSeq machines, the Roche 454 Genome Sequencer FLX machines (Margulies et al.
2005; Rothberg & Leamon 2008), and the SOLiD system from Life Technologies
(McKernan et al. 2009). Other next-generation sequencing manufacturers or platforms
include Complete Genomics (Drmanac et al. 2010), Helicos BioSciences (Braslavsky et
al. 2003; Ozsolak et al. 2009), Ion Torrent from Life Technologies (Rothberg et al. 2011),
and Pacific Biosciences (Eid et al. 2009). For general applications, Illumina is currently
the market leader in the next-generation sequencing space because of low error rates and
high yield (Luo et al. 2012; Minoche et al. 2011; Quail et al. 2012), although the various
platforms have advantages that are better suited for different experiments. For example,
the Roche 454 system delivers long reads necessary for many metagenomics studies
(Turnbaugh et al. 2009; Wommack et al. 2008), Helicos sequencers allow for direct
sequencing of RNA without conversion to cDNA (Ozsolak & Milos 2011; Ozsolak et al.
2009), and the Pacific Biosciences platform allows for real-time monitoring of the
sequencing reaction (Metzker 2009) and detection of modified nucleotides (Flusberg et
next-generation sequencing workflow involves library or template preparation, sequencing and
imaging, and alignment and assembly.
1.3.1 Library preparation and sequencing
The main steps of library preparation consist of isolation of nucleic acid material,
shearing of the sample into smaller fragments, addition of adapter sequences to allow for
PCR amplification, and immobilization of the fragments to a surface. Illumina uses a
technique called solid-phase amplification (Fedurco et al. 2006) whereby fragments
hybridize to primers covalently attached to a glass slide or ‘flow cell’. Fragments are
clonally amplified using isothermal ‘bridging’ amplification, resulting in high-density
‘clusters’ originating from the same template (Bentley et al. 2008). In contrast, Roche
454 and SOLiD by Life Technologies employ a different technique called emulsion PCR
(Dressman et al. 2003) which involves bead capture of fragments and immobilization of
the beads through chemical crosslinking (Kim et al. 2007) or deposition into wells
(Leamon et al. 2003).
The next steps in the workflow calls for sequencing and imaging of the clonally
amplified templates. Illumina utilizes a strategy termed ‘cyclic reversible termination’
which involves repeated cycles of nucleotide incorporation, fluorescence imaging, and
cleavage (Bentley et al. 2008; Metzker 2005). The methodology begins with the
incorporation of a modified nucleotide containing a reversible blocking group that
terminates DNA synthesis after addition of a single base. The identity of the incorporated
8
that measures the release of inorganic pyrophosphate to infer the incorporation of
nucleotides (Ronaghi et al. 1996; Ronaghi et al. 1998). The pyrosequencing method does
not use modified nucleotides to terminate DNA synthesis, but instead relies on the
addition of nucleotides in limiting amounts and recording the luminescence following
release of pyrophosphate to infer the underlying DNA sequence (Margulies et al. 2005).
Lastly, the SOLiD system by Life Technologies uses a ‘sequencing by ligation’ approach
that uses DNA ligase (Landegren et al. 1988) and base-encoded probes (Shendure et al.
2005). Briefly, fluorescently labeled probes are hybridized to the complementary
sequencing template. DNA ligase is then added, non-ligated probes are washed away, and
the identity of the incorporated probe along with a quality score reflecting the probability
of an incorrect call is then determined by imaging.
1.3.2 Genome assembly and alignment
For genome studies, the first step in the processing of sequence reads obtained from
next-generation sequencing platforms is assembly and alignment (Flicek & Birney 2009).
Assembly of sequencing reads is necessary in cases where a reference genome does not
exist. Prior to the advent of next-generation sequencing data, Sanger sequencing
technology provided long reads (~800 nucleotides or nt), and assembly algorithms
resolved the overlap between these long reads. For the short read (36 to ~300 nt) output
of next-generation sequencing platforms, new computational methods have been
developed to address the assembly of fragments of small lengths (Zhang et al. 2011).
Two main types of strategies exist for de novo assembly: string-based methods,
implemented by a Greedy-extension algorithm, and graph-based models such as the
string-based methods, such as QSRA (Bryant et al. 2009), VCAKE (Jeck et al. 2007),
SHARCGS (Dohm et al. 2007), and SSAKE (Warren et al. 2007) are more appropriate
for small genomes with short reads, whereas software that utilize
overlap-layout-consensus, such as Forge (Diguistini et al. 2009), Shorty (Hossain et al. 2009), CABOG
(Miller et al. 2008), and Edena (Hernandez et al. 2008) are more suited for small
genomes with long reads (Zhang et al. 2011). For larger genomes, programs that use the
de Bruijn graph method (Idury & Waterman 1995; Pevzner et al. 1989) are more fitting;
algorithms that use this approach include ALLPATHS-LG (Gnerre et al. 2011),
SOAPdenovo (R. Li, H. Zhu, et al. 2010), ABySS (Simpson et al. 2009), Euler-USR
(Chaisson et al. 2009), Velvet (Zerbino & Birney 2008), ALLPATHS (Butler et al. 2008),
and Euler-SR (Chaisson & Pevzner 2008).
In cases where a reference genome exists, alignment is necessary to determine the
most likely origin for each sequencing read. Early methods relied on the use of hash-table
data structures to index sequence data and rapidly search for alignments. One strategy,
used by programs such as Eland (proprietary software of Illumina), RMAP (A. D. Smith
et al. 2008), MAQ (H. Li et al. 2008), ZOOM (H. Lin et al. 2008), SeqMap (Jiang &
Wong 2008), CloudBurst (Schatz 2009), and SHRiMP (Rumble et al. 2009), involves
hashing the short reads and subsequently scanning through the reference genome for
alignments. These software programs are relatively efficient in terms of memory usage,
but they require a lookup of the entire reference genome regardless of the number of
10
PASS (Campagna et al. 2009), ProbeMatch (Y. J. Kim et al. 2009), SOAPv1 (R. Li et al.
2008), and Stampy (Lunter & Goodson 2011). These methods use a constant amount of
memory for a given reference genome, which may be large depending on the size and
(Lunter & Goodson 2011) complexity of the genomic sequence. A third type of strategy
for alignment of next-generation sequencing data indexes the reference genome using the
Burrows-Wheeler Transform (BWT), a data compression algorithm that allows for
memory-efficient storage and fast string matching (Burrows & Wheeler 1994). Programs
that use this approach include Bowtie (Langmead et al. 2009), BWA (H. Li & Durbin
2009), and SOAPv2 (R. Li, C. Yu, et al. 2009). While BWT-based aligners are fast and
memory-efficient, they tend to be less accurate and sensitive than hash-based algorithms
(Grant et al. 2011; Lunter & Goodson 2011).
1.3.3 Transcriptome assembly and alignment
For transcriptome studies, the assembly and alignment challenge is complicated by
unequal coverage resulting from gene expression differences, strand-specific expression
of transcripts, and alternative splicing. While the reference genome can serve as a
scaffold in genome alignment for many model organisms, the existence of a truly
comprehensive transcriptome database that accounts for all possible gene isoforms does
not exist for most organisms. Thus, even for studies involving humans where a reference
genome is available, the ability of assemblers to discover gene isoforms de novo is
important. Transcriptome assembly programs mainly follow either a reference-based
strategy or de novo approach, or some combination of the two (J. A. Martin & Wang
The de novo approach for transcriptome assembly involves searching for
overlapping sequence between short reads and assembling them using a de Bruijn
approach (Pevzner et al. 2001) to form transcripts. Programs using this strategy include
Multiple-k (Surget-Groba & Montoya-Burgos 2010), Rnnotator (J. Martin et al. 2010),
Trans-ABySS (Robertson et al. 2010), and Trinity (Grabherr et al. 2011). De novo
assembly for organisms with smaller genomes has been successful, although for more
complicated eukaryotic organisms, intense computing resources are necessary. Some
disadvantages of de novo methods include the dependence on high sequencing depths (J.
Martin et al. 2010) and sensitivity to sequencing error and chimeric transcripts (Cocquet
et al. 2006).
Another strategy for transcriptome analyses of next-generation sequencing data
uses the reference genome as a basis for guided assembly. The general strategy first
involves alignment of the short reads to the genome using a splice-aware aligner, or
aligner that allows for the introduction of gaps in locations of spliced introns. Examples
of splice-aware aligners include BLAT (Kent 2002), GSNAP (T. D. Wu & Nacu 2010),
MapSplice (K. Wang et al. 2010), QPALMA (De Bona et al. 2008), SOAPv2 (R. Li, C.
Yu, et al. 2009), RUM (Grant et al. 2011), SpliceMap (Au et al. 2010), and TopHat
(Trapnell et al. 2009). These various aligners use different approaches for the alignment
of spliced reads. Early algorithms performed alignment to a transcriptome database
consisting of known isoform transcripts supplemented with sequences surrounding
12
exons are inferred from regions of the genome with coverage, and lastly, reads that failed
to align to the genome previously are mapped to junctions created between the proposed
exons (Trapnell et al. 2009). This method performs well only for highly abundant
isoforms, as the exons of low-expressing transcripts may not be properly identified.
Another shortcoming of this strategy is that alignments to the genome take precedence
over spliced alignments, which is problematic for alignments to homologous sequences in
the genome such as processed pseudogenes. The methodology used by RUM addresses
this issue, as RUM seeks and compares alignments to the genome and transcriptome
(Grant et al. 2011). The approach taken by GSNAP searches for alignments to known
junctions and also attempts to predict novel splicing events through a probabilistic model
dependent on donor and acceptor sites in the surrounding genomic sequence (T. D. Wu &
Nacu 2010). Comparative and benchmark analyses have been performed on these various
splice-aware aligners, and the results indicate that GSNAP and RUM have the highest
accuracy in terms of overall alignment and splice junction detection (Grant et al. 2011).
Following alignment of the reads to the genome with a splice-aware aligner, reads
that overlap are clustered to build a graph representing all possible splice variants, and
finally, isoforms are resolved by traversing through the graph. Programs that adopt the
reference-based approach to transcriptome assembly include Cufflinks (Trapnell et al.
2010), G-Mo.R-Se (Denoeud et al. 2008), and Scripture (Guttman et al. 2010). Cufflinks
assembles gene isoforms by first creating an overlap graph from all reads within a locus
in the genome and then creates transcripts by determining the minimum number of
traversals through the graph that explains the splice junctions observed (Trapnell et al.
between bases connected by a splice junction, and then assembles transcripts by
searching for traversals through the graph that are supported by statistically significant
expression (Guttman et al. 2010). The differences in graph formation and traversal
methods between Cufflinks and Scripture suggests that Cufflinks may be more
conservative in isoform detection, and a recent comparison between Cufflinks and
Scripture has shown that indeed Cufflinks has higher specificity and sensitivity for
finding known introns (Robertson et al. 2010).
A third approach to transcriptome assembly involves a combination of de novo and
reference-based assembly. Algorithms that use both approaches combine the ability of de
novo methods to find novel isoforms and the sensitivity and specificity in splice junction
detection of referenced-based strategies. Some programs, such as Trans-ABySS
(Robertson et al. 2010) and Oases (Schulz et al. 2012), begin by a referenced-based
assembly of reads, followed by de novo assembly of reads that failed to align to the
genome. For situations where a high quality reference genome does not exist, an
alternative approach involves de novo assembly of reads into contigs and subsequent
alignment of the contigs to the reference genome. The reference genome, and in some
cases protein sequences, can be used to join and fill in gaps between contigs to form
longer transcripts (Crawford et al. 2010; Surget-Groba & Montoya-Burgos 2010).
1.3.4 Variant and genotype calling
The goals of genome sequencing projects include the comprehensive
14
loci (Ng, Bigham, et al. 2010; Ng, Buckingham, et al. 2010; Ng et al. 2009; O'Roak et al.
2011; Tennessen et al. 2012). These studies, among other applications of high-throughput
sequencing, rely critically on the accurate identification of genetic variants and
genotyping of individual samples using next-generation sequencing data. Many
frameworks and computational pipelines for variant and genotype calling have been
developed. In general, they involve many steps of calibration, filtering, and statistical
analyses. The general approach starts with methods for reducing base-calling errors in
raw reads along with further recalibration of base quality scores, local realignment, and
filtering of duplicate reads after assembly and alignment of reads. Variants, or sites where
at least one of the observed bases is different from the reference, are then identified and
the corresponding genotypes are inferred. For studies involving multiple samples,
datasets can be pooled across individuals to increase the power of detection. Smaller
variants, such as single-nulceotide polymorphisms (SNPs) and short insertions and
deletions, require different algorithms and strategies than large structural variants such as
insertions, deletions, inversions, duplications, copy-number variations (CNVs), and
translocations. As such, many different programs aimed at different variants have been
developed for the comprehensive analyses of DNA-Seq datasets.
The proper identification of variants and determination of genotype is affected by
sequencing and alignment error. Thus, various precautionary steps are taken to reduce the
amount of false positives resulting from spurious signals in next-generation sequencing
datasets. The first step in most frameworks for variant and genotype calling involves
optimization of base calling procedures. After assembly and alignment of reads, further
with low mapping scores, are taken. Base-calling algorithms generally output a base call
in addition to a Phred quality score that represents the probability of an error in base
calling (Ewing & Green 1998). Reports have shown, however, that these quality scores
co-vary with sequencing platform, reaction cycle, and local sequence features (Brockman
et al. 2008; M. Li et al. 2004; R. Li, Y. Li, et al. 2009; Nakamura et al. 2011). As such,
various de-noising algorithms, such as Ibis (Kircher et al. 2009) and BayesCall (Kao &
Song 2011; Kao et al. 2009) for Illumina, Pyrobayes (Quinlan et al. 2008) for Roche 454,
Rsolid (H. Wu et al. 2010) for SOLiD, and SysCall for Illumina and SOLiD (Meacham et
al. 2011) have been developed to reduce the error rates for base calling. After assembly
and alignment, many variant calling pipelines remove reads aligning to multiple locations
in the genome or reads with low mapping quality scores. In order to account for the
correlation of sequencing error with the position of a base within the read (Balzer et al.
2010; Minoche et al. 2011), some variant calling algorithms further recalibrate
sequencing base quality scores (DePristo et al. 2011; H. Li et al. 2009; R. Li, Y. Li, et al.
2009; R. Li, C. Yu, et al. 2009; McKenna et al. 2010).
Many algorithms have been developed for the identification and genotyping of
SNPs. Early methods for genotyping SNPs relied on filtering out bases with Phred quality
scores less than 20 and identifying a site as heterozygous if the percentage of
non-reference bases at any given site is between 20 and 80% (Harismendy et al. 2009; J.
Wang et al. 2008). This method is a good approximation, however, only when the
16
consideration various parameters such as allele frequencies and patterns of linkage
disequilibrium have been developed to address these issues (Nielsen et al. 2011). These
algorithms include GATK (DePristo et al. 2011; McKenna et al. 2010), MAQ (H. Li et al.
2008), QCall (Le & Durbin 2011), Samtools (H. Li et al. 2009), SOAPv2 (R. Li, C. Yu,
et al. 2009), and VarScan (Koboldt et al. 2009). After genotyping has been performed on
individual samples, datasets can be pooled to filter out singletons and assemble a list of
SNP variants.
In addition to SNP discovery programs, many different approaches have been
developed for the identification of short insertions and deletions (indels) and larger
structural variants. These methods include Dindel (Albers et al. 2011), inGAP (Qi et al.
2010), GATK (DePristo et al. 2011; McKenna et al. 2010), MoDIL (S. Lee et al. 2009),
Samtools (H. Li et al. 2009), and VarScan (Koboldt et al. 2009) among others (Krawitz et
al. 2010; D. R. Smith et al. 2008). For the detection of larger structural variants,
algorithms rely critically on the use of paired-end reads, or sequencing of fragments from
two ends of the library read, to infer deviations from expected distances or relative
orientations between two locations in the genome (Campbell et al. 2008; Kidd et al. 2008;
Korbel et al. 2007). This paired-end mapping technique has allowed for genome-wide
characterization of large structural variants such as insertions, deletions, inversions,
duplications, copy-number variations (CNVs), and translocations. Computational
methods developed for robust detection of such variants include ABI SOLiD Software
Tools (McKernan et al. 2009), BreakDancer (K. Chen et al. 2009), MoDIL (S. Lee et al.
2009), PEMer (Korbel et al. 2009), Pindel (Ye et al. 2009), SegSeq (Chiang et al. 2009),
1.3.5 Gene expression profiling
Applications of next-generation sequencing technology to the study of RNA have
led to many insights into the complexity of the transcriptome. In particular, RNA-Seq has
been used to probe various aspects of the transcriptome such as gene expression
(Graveley et al. 2011; Mortazavi et al. 2008; Nagalakshmi et al. 2008), alternative
splicing (Cloonan et al. 2008; Sultan et al. 2008; Wilhelm et al. 2008), alternative
transcription start site usage (Trapnell et al. 2010; Twine et al. 2011), and alternative
polyadenylation (Ozsolak et al. 2010; Sandberg et al. 2008; E. T. Wang et al. 2008)
among others. These features of the transcriptome, along with many others, are critically
dependent on accurate methods for quantifying gene expression from RNA-Seq data.
Reported initially in 2008, the standard measurement of gene expression is ‘FPKM’, or
fragments per kilobase of exon model per million mapped reads (Mortazavi et al. 2008).
This calculation of gene expression accounts for differences in input sizes across
experiments through normalization of the total number of reads aligned and corrects for
variation in gene size by dividing by the sum of exon lengths. Improving upon the
standard ‘FPKM’ measurement, various other adjustments have been proposed to address
non-uniform coverage of gene transcripts (Roberts et al. 2011) and uncertainty resulting
from reads that align to multiple locations in the genome (B. Li et al. 2010). For studies
of differential gene expression, different computational pipelines such as Cufflinks
(Trapnell et al. 2012), DEGseq (L. Wang et al. 2010), DESeq (Anders & Huber 2010),
18
1.4
RNA-DNA sequence differences
The single-nucleotide resolution provided by next-generation sequencing
technology permits detailed examination of DNA and RNA sequence. In particular, the
interrogation of the genome and transcriptome by deep sequencing permits systematic
comparisons between DNA and RNA sequence. In general, the transmission of sequence
information from DNA to RNA is expected to occur in a one-to-one fashion (Crick
1970). There are, however, known exceptions to this rule: transcriptional infidelity, or
errors introduced by RNA polymerase during the synthesis of RNA, and RNA editing,
the modification of RNA transcripts by various mechanisms to alter the original RNA
sequence specified in the genome. Recently, with advances in next-generation sequencing
technology, many researchers have performed genome-wide studies comparing DNA and
RNA sequences from the same sample and found many more editing events than
previously known in addition to RNA-DNA sequence differences (RDDs) that cannot be
explained by known mechanisms.
1.4.1 Transcriptional infidelity
Errors introduced during transcription by RNA polymerases are rare, with an
estimated frequency of less than 1 in 105 in bacteria and eukaryotes (Blank et al. 1986; de
Mercoyrol et al. 1992; Rosenberger & Hilton 1983). Strategies for ensuring high
transcriptional accuracy include discriminative substrate selection (Kireeva et al. 2008;
Libby & Gallant 1991; Temiakov et al. 2004; Vassylyev et al. 2007) and proofreading
capabilities (Borukhov et al. 1993; Erie et al. 1993; Izban & Luse 1992; Kuhn et al. 2007;
Sydow & Cramer 2009). Despite these mechanisms to ensure faithful transcription, errors
of the incoming nucleotide with the template (Sydow et al. 2009), non-templated
incorporation from an abasic template site (Damsma et al. 2007), transcription of DNA
lesions (Brueckner et al. 2007; Damsma et al. 2007), or template misalignment (Kashkina
et al. 2006; Pomerantz et al. 2006). Furthermore, studies on RNA polymerase show that
misincorporation rates are correlated with the type of mismatch (Sydow et al. 2009) and
surrounding sequence context (Kashkina et al. 2006).
1.4.2 RNA editing
RNA editing refers to targeted sequence alteration of the RNA transcript,
resulting in sequence that is different from the underlying DNA template. Originally
discovered in trypanosomes as an insertion event of four uridine residues to restore a
reading-frame shift in the DNA (Benne et al. 1986), the term has since come to
encompass a diverse set of sequence revisions of the RNA transcript in a wide range of
organisms (Gott & Emeson 2000; Knoop 2011). In lower organisms, various types of
editing mechanisms have been uncovered since the initial discovery of insertional editing
in trypanosomes. For example, paramyxoviruses control the expression of two different
isoforms of phosphoprotein by introducing either one or two additional guanosines in the
mRNA transcript co-transcriptionally (Cattaneo et al. 1989; S. M. Thomas et al. 1988;
Vidal et al. 1990a). The insertion event is always found to occur within a short stretch of
guanosines, and thus a stuttering mechanism has been proposed in which the viral
polymerase repeatedly copies a cytosine in the template (Vidal et al. 1990b). In
20
2002; Mahendran et al. 1991). Other examples of RNA editing in lower organisms
include pyrimidine and purine transitions, transversions of guanosine to cytidine, and
conversions of uridine to purines among other sequence revisions in dinoflagellates
(Dorrell & Howe 2012; Jackson et al. 2007; S. Lin et al. 2002; Zauner et al. 2004) and
U-to-C conversions in placazoa (Burger et al. 2009).
In plants, RNA editing occurs in the form of pyrimidine exchanges in
mitochondrial and chloroplast transcripts. Since the initial discovery of C-to-U
substitutions to reconstitute evolutionarily conserved amino acids in wheat and evening
primrose mitochondria (Covello & Gray 1989; Gualberto et al. 1989; Hiesel et al. 1989),
other instances of C-to-U editing have been observed in the mitochondria of many
different land plants (Fang et al. 2012; Hiesel et al. 1994; Malek et al. 1996; Sper-Whitis
et al. 1996; Sper-Whitis et al. 1994; W. Wang et al. 2012). Less common than the
commonly observed C-to-U editing, U-to-C exchanges have also been observed in the
mitochondria hornworts (Steinhauser et al. 1999; Yoshinaga et al. 1996), lycophytes
(Grewe et al. 2009), and some seed plants (Gualberto et al. 1990; W. Schuster et al.
1990). Shortly after the discovery of mitochondrial RNA editing, C-to-U editing of
chloroplasts was reported in maize (Hoch et al. 1991) and subsequently in all land plants
with the exception of the marchantiid liverworts (Freyer et al. 1997; Inada et al. 2004;
Kugita et al. 2003; Tillich et al. 2005; Tsudzuki et al. 2001; Wolf et al. 2004). Studies
have demonstrated that chloroplast editing in plants is essential for protein function
(Bock et al. 1994) and that specificity is conferred by local sequences (Bock et al. 1996;
Chaudhuri et al. 1995; Sutton et al. 1995). Recent efforts to find the mechanism
repeat (PPR) protein family as playing a key and necessary role (S. R. Kim et al. 2009;
Kotera et al. 2005; Okuda et al. 2010; Robbins et al. 2009; Yu et al. 2009; Zehrmann et
al. 2009; Zhou et al. 2009).
In metazoa, two main types of editing are known to exist: A-to-I changes result
from deamination of adenosine to inosine by ADAR, a family of adenosine deaminases
that act on RNA (Nishikura 2010; Orlandi et al. 2012; Wulff & Nishikura 2010), and
C-to-U differences arise from deamination of cytidine to uridine by ABOBEC1, a member
of the AID/APOBEC gene family (Conticello 2012; Keegan et al. 2001; Smith et al.
2012; Wedekind et al. 2003). Inosine is recognized by the translational machinery as
guanosine, and thus, A-to-I RNA editing by ADAR is functionally equivalent to A-to-G
changes. Discovered initially for its ability to unwind RNA duplexes through adenosine
deamination (Bass & Weintraub 1988), ADAR is now recognized for its involvement in
post-transcriptional A-to-I editing of various double-stranded RNA substrates, playing a
role in proteome diversification (Pullirsch & Jantsch 2010), regulation of gene expression
through alternative splicing (Laurencikiene et al. 2006; Rueter et al. 1999; Schoft et al.
2007) and RNA interference (Alon et al. 2012; Borchert et al. 2009; Kawahara et al.
2008; Kawahara et al. 2007; Liang & Landweber 2007; Nishikura 2006; Reid et al. 2008;
Yang et al. 2006). Early insights into the function of ADAR came from reports that a
glutamine-to-arginine codon change in glutamate receptors controls ion flow in mouse
brain (Sommer et al. 1991). Subsequent studies have demonstrated that ADAR likewise
22
and psychiatric disorders (Bhogal et al. 2011; Grohmann et al. 2010; Sawada et al. 2009;
Silberberg et al. 2012; Tan et al. 2009; Zhu et al. 2012). Furthermore, RNA editing by
ADAR is necessary for proper development and normal life as ADAR-deficient
invertebrates exhibit behavioral defects (Palladino et al. 2000; Tonkin et al. 2002),
ADAR1-knockout mice are embryonic lethal (Q. Wang et al. 2000), and
ADAR2-knockout mice are viable but die prematurely (Higuchi et al. 2000).
Within the past decade, different approaches have been developed to identify
A-to-I editing sites in a global manner. Prior to the development of these genome-wide
screens, only a few genes were known to be targets of ADAR (Bass 2002;
Hoopengardner et al. 2003; Morse & Bass 1999). An initial study aimed at global
discovery of RNA editing sites searched in large databases of expressed sequence tags
and found more than 12,000 sites in 1,600 genes, increasing the number of previously
known editing sites in humans by more than two orders of magnitude (Levanon et al.
2004). This work revealed that the majority of A-to-I editing sites in humans are located
within noncoding regions of the gene, typically in Alu elements, a class of short
interspersed elements (SINEs) unique to primates that comprises approximately 10% of
the human genome (Batzer & Deininger 2002). With the emergence of next-generation
sequencing technology, recent studies have used RNA-Seq to identify editing sites in a
global manner across different cell types and organisms (Bahn et al. 2012; Chepelev
2012; Ju et al. 2011; J. B. Li et al. 2009; Park et al. 2012; Peng et al. 2012; Ramaswami et
al. 2012). These studies confirm the notion that A-to-I RNA editing in mammalian
systems is widespread, with estimates ranging from approximately 1,000 to over 400,000
majority of editing sites are within noncoding regions (mainly the 3’UTR and introns)
and that codon changes in protein sequences are rare (Kleinman et al. 2012). Expanding
the search for editing events beyond processed mRNA transcripts, some next-generation
sequencing studies have investigated RNA editing in different species of RNA, such as
small RNA, lending insight into crosstalk between the ADAR and RNA intereference
pathways (Alon et al. 2012; Warf et al. 2012; D. Wu et al. 2011). Other RNA-Seq studies
have focused on the temporal aspect of editing by sequencing nascent RNA, discovering
that the majority of A-to-I editing in Drosophila occurs cotranscriptionally (Rodriguez et
al. 2012).
The second type of RNA editing in metazoa is C-U deamination by APOBEC1
(Keegan et al. 2001). Discovered for its role in producing two distinct forms of
apolipoprotein B: apoB100 and the shorter isoform apoB48, which results from the
conversion of a glutamine codon to a stop codon through C-to-U deamination in apoB
mRNA (S. H. Chen et al. 1987; Hospattankar et al. 1987; Powell et al. 1987; Smith et al.
1997), APOBEC1 is a zinc-dependent cytidine deaminase that achieves editing site
specificity through local sequence motifs (Backus & Smith 1994; Hersberger &
Innerarity 1998; Hersberger et al. 1999; Shah et al. 1991) and the RNA-binding
“APOBEC1 complementing factor” ACF (Mehta et al. 2000). ApoB is a lipoprotein that
plays a critical role in the transport of cholesterol and triglycerides in the plasma (Chan
1992). In humans, C-to-U editing of apoB mRNA occurs only in the small intestine but
24
apoB100 in modulating LDL levels is important in the development of atherosclerosis, as
high LDL levels are a major risk factor for coronary heart disease (Ross 1995). In
contrast, apoB48, which is produced in the small intestine and lacks the carboxyl
terminus of apoB100, aids in the synthesis and secretion of chylomicrons (Kane et al.
1980). In contrast to widespread A-to-I RNA editing, only a few additional targets of
APOBEC1 have been identified apart from apoB mRNA, such as the editing of glycine
receptors (Legendre et al. 2009; Meier et al. 2005), NAT1 (novel APOBEC target) mRNA
(Yamanaka et al. 1997), and the neurofibromatosis NF1 mRNA (Skuse et al. 1996).
Recent genome-wide studies using RNA-Seq have uncovered 32 more mRNA target sites
of APOBEC1, all of which are in AU-rich segments of the 3’ untranslated regions (3’
UTR) of gene transcripts (Rosenberg et al. 2011). The localization of these editing sites
to the 3’ UTR of transcripts may alter binding sites for RNA-binding proteins, abolish or
create miRNA seed sequences, or affect additional post-transcriptional processes such as
polyadenylation, subcellular localization, or translational efficiency, although further
research into the biological impact of these editing events remains to be done.
1.4.3 Other types of RNA-DNA sequence differences
In addition to A-to-I editing by ADAR and C-to-U editing by APOBEC1 in
metazoa and other types of RNA editing processes in other organisms, many researchers
have reported the discovery of RNA-DNA sequence differences (RDDs) with unknown
mechanisms. We refer to these RDDs as noncanonical RDD events. Initially, knowledge
of these RDDs arose from observations of discrepancies between cloned transcripts of
DNA versus cDNA. Examples include a C-to-U difference in the WT1 gene implicated in
α-galactosidase (Novo et al. 1995), and various types of RDDs in the β amyloid precursor
protein and ubiquitin-B protein genes of Alzheimer’s and Down patients (van Leeuwen et
al. 1998), the transcobalamin II gene (Qian et al. 2002), the androgen receptor gene
(Martinez et al. 2008), and in HIV mRNA of chronically infected H9 cells (Bourara et al.
2000). In addition to these isolate examples in individual genes, genome-scale analyses of
expressed sequence tags revealed elevated levels of non-random RDDs in cancer samples
versus those of normal tissue (Bianchetti et al. 2012; Brulliard et al. 2007).
With recent advances in sequencing and informatics, several groups have utilized
next-generation sequencing technology to perform systematic and genome-wide
comparisons of DNA and RNA sequence. In 2011, Cheung and colleagues obtained
RNA-Seq data on a group of 27 unrelated individuals in the Centre d’Etude du
Polymorphisme Humain (CEPH) collection (Dausset et al. 1990) for whom low-coverage
whole-genome sequence information is available and found widespread occurrences of
all 12 types of RDDs, the majority of which cannot be explained by known mechanisms
(M. Li et al. 2011). A few of these noncanonical RDD events were further validated by
Sanger sequencing and also shown to be translated into protein by mass spectrometry.
Shortly thereafter, other groups reported similar findings of noncanonical RDD events
using cell lines derived from different ethnic groups (Ju et al. 2011) and tissue types
(Bahn et al. 2012).
However, several research groups subsequently challenged the existence of
26
Majewski 2012; W. Lin et al. 2012; Peng et al. 2012; Pickrell et al. 2012; Schrider et al.
2011). To correct for these various sources of error, several research groups developed
different filtering criteria and computational techniques for the accurate identification of
RDDs (Kleinman et al. 2012; Peng et al. 2012; Ramaswami et al. 2012). These pipelines
aim to account for misalignment in challenging regions of the genome such as repetitive
sequences, pseudogenes, homologous sequences, and exon-exon junctions, and address
experimental noise such as strand and positional bias in sequencing error. The results
from these stringent computational pipelines indicate that A-to-G events comprise
approximately 80 to 90% of all RDDs identified and are able to be reproducibly validated
using Sanger sequencing technology at rates of about 90% across various studies (Peng et
al. 2012; Ramaswami et al. 2012). In contrast, noncanonical RDD events vary from not
being able to be confirmed by Sanger sequencing (Ramaswami et al. 2012) to validation
rates of approximately 50% (Peng et al. 2012). As such, the debate over the existence and
prevalence of noncanonical RDDs in humans continues persists, with evidence
suggesting that they do occur albeit at a low frequency. Further mechanistic studies are
1.5
Summary
The study of the transcriptome, or the complete set of transcribed RNA species in
the cell at any given time under a particular set of conditions, is critical for understanding
how expression of information in the genome is translated into overall phenotypic
variation. Recent advances in sequencing technology have enabled genome-wide studies
of RNA output at unprecedented depths and resolution. In Chapter 2, we explore the use
of next-generation sequencing technology in global analyses of gene expression. In
particular, we obtain deep RNA sequence information of cultured human B-cells to
quantify the expression levels of all genes and their transcripts and assess the depths of
sequencing necessary for sequencing-based studies. We provide the results of our
transcriptome analysis as a public resource for others interested in the expression and
structure of genes in human B-cells. Next, in Chapter 3, we examine systematic sequence
differences between RNA and DNA of the same individual, or sequence alterations that
may result from processes such as RNA editing, transcriptional infidelity, or other
unknown mechanisms. In light of the ongoing debate over the prevalence and existence
of RNA-DNA sequence differences (RDDs) mediated by unknown mechanisms, we
perform in silico and experimental analyses to evaluate the precision and power of
next-generation sequencing technology and associated computational methods in the detection
of RDDs in chapter 4. Using various bioinformatics algorithms and filtering methods to
28
genomic template sequence, vary across individuals and furthermore, the degree to which
this variation is genetically determined.
In summary, this thesis provides a resource for those interested in the study of
transcriptomes using RNA-Seq technology and computational methods. In particular, this
work lends insight into the analysis of gene expression and systematic detection of
sequence variants between RNA and DNA genome-wide. The results from the gene
expression profiling of human B-cells are available on the UCSC Genome Browser, and
the computational pipeline for the identification of RDDs is outlined in the thesis. Lastly,
the work on the heritability of RDDs lays the foundation for future genetic analyses of
the determinants influencing systematic sequence differences between DNA and RNA
Chapter 2.
RNA-Sequence Analysis of Human B-Cells
2.1
Abstract
RNA-Sequencing (RNA-Seq) allows for quantitative measurement of expression
levels of genes and their transcripts. In this chapter, we analyzed the transcriptome of
cultured human B-cells. In particular, we sequenced complementary DNA fragments
(cDNA) derived from human lymphoblastoid cell lines and obtained 879 million 50
base-pair reads comprising 44 Gigabases of sequence. The results enabled us to evaluate the
expression profile of B-cells and to assess experimental parameters for sequencing-based
studies. Overall, we identified 20,766 genes and 67,453 of their alternatively-spliced
isoforms. More than 90% of genes with multiple exons are alternatively-spliced, and for
most genes, one isoform is expressed predominantly. We observed that while
chromosomes differ greatly in gene density, the percentage of transcribed elements in
each chromosome is less variable. In addition, genes involved in related biological
processes are expressed at more similar levels than genes with different functions.
Besides the analysis of gene expression levels, we also used the data to investigate the
effect of sequencing depth on gene expression measurements. While 100 million reads
are sufficient to detect most expressed genes and transcripts, about 500 million reads are
needed to measure accurately their expression levels. We provide examples in which
deep sequencing is needed to determine the relative abundance of genes and their
30
readers to study the expression and structure of genes in human B-cells. The majority of