https://doi.org/10.5194/ms-10-229-2019
© Author(s) 2019. This work is distributed under the Creative Commons Attribution 4.0 License.
Stability analysis of bicycles by means of analytical
models with increasing complexity
Alberto Doria1, Sergio Roa2, and Luis Muñoz2
1Department of Industrial Engineering, University of Padova, Padova, 35131, Italy 2Department of Mechanical Engineering, Universidad de los Andes, Bogota, 111711, Colombia
Correspondence:Alberto Doria ([email protected])
Received: 7 March 2019 – Revised: 6 May 2019 – Accepted: 23 May 2019 – Published: 12 June 2019
Abstract. The basic Whipple-Carvallo bicycle model for the study of stability takes into account only geometric and mass properties. Analytical bicycle models of increasing complexity are now available, they consider frame compliance, tire properties, and rider posture. From the point of view of the designer, it is important to know if geometric and mass properties affect the stability of an actual bicycle as they affect the stability of a simple bicycle model. This paper addresses this problem in a numeric way by evaluating stability indices from the real parts of the eigenvalues of the bicycle’s modes (i.e., weave, capsize, wobble) in a range of forward speeds typical of city bicycles. The sensitivity indices and correlation coefficients between the main geometric and mass properties of the bicycle and the stability indices are calculated by means of bicycle models of increasing complexity. Results show that the simpler models correctly predict the effect of most of geometric and mass properties on the stability of the single modes of the bicycle. Nevertheless, when the global stability indices of the bicycle are considered, often the simpler models fail their prediction. This phenomenon takes place because with the basic model some design parameters have opposite effects on the stability of weave and capsize, but, when tire sliding is included, the capsize mode is always stable and low speed stability is chiefly determined by weave stability.
1 Introduction
The stability of bicycles has drawn the attention of scien-tists since the development of the first modern bicycles. The first dynamic models for understanding the bicycle dynam-ics were written independently by two scientists at the end of the nineteenth century: Whipple (1899) and Carvallo (1899). The Whipple–Carvallo bicycle model (WCBM) (Meijaard et al., 2007) consists in the linearized equations of motion of the bicycle and the rider. This model makes it possible to con-duct open loop analysis with the rider hands-off the handle-bar. Many authors have analyzed bicycle stability using the WCBM (Limebeer and Sharp, 2006; Meijaard et al., 2007; Schwab et al., 2007; Sharp, 2008) by solving the eigenvalue problem in order to analyze the modes of vibration of the system.
Starting from the WCBM many linearized bicycle models of increasing complexity have been developed to study bi-cycle stability. Some researchers have extended the WCBM
in order to include compliance of the front assembly (CFA). This compliance commonly includes the effects of the frame head tube, the fork, and the wheel (Doria and Roa, 2017; Doria et al., 2017; Klinger et al., 2014; Limebeer and Sharp, 2006; Plöchl et al., 2012; Sharp, 2008). These models add an additional velocity degree of freedom to the WCBM in order to take into account the lateral velocity of the front-assembly due to compliance. Other authors have extended the model including tire mechanics (Doria et al., 2013; Doria and Roa, 2017; Klinger et al., 2014; Sharp, 2008; Souh, 2015). When tire lateral slip is considered at least four degrees of freedom (DOFs) are needed to model the bicycle.
mod-els requires cumbersome time-domain simulations and spe-cific identification methods for extracting the properties of the modes of vibration from time-domain data.
The rider with his/her mass, stiffness and damping char-acteristics has a large effect on bicycle dynamics, even if the control actions (Kooijman and Schwab, 2013) are neglected and a completely passive behavior is assumed. For this rea-son, some researchers have integrated the bicycle model with rider models composed of rigid bodies (the limbs) connected by means of joints (the articulations) and by lumped stiffness and damping elements (Schwab et al., 2012; Doria and Tog-nazzo, 2014). These models make it possible to simulate the passive response of the rider both in the hands-off and in the hands-on configuration.
The extensions of the WCBM improve the quality and range of reliability of the stability analysis. For instance, when the front-assembly compliance and tire mechanics are included, the wobble mode appears as an additional mode of vibration and bicycle stability at relatively high speed is bet-ter predicted. Additionally, when the hands-on condition is analyzed, the weave, capsize and wobble modes are changed with respect to the hands-off condition, in particular the wob-ble mode becomes more damped due to the rider’s arms in-fluence (Klinger et al., 2014; Roa et al., 2018). Nonetheless, it is useful to determine the limits and potentialities of each model.
The purpose of this paper is to compare different models of increasing complexity in terms of their capability of pre-dicting bicycle stability. Since bicycle stability depends on many parameters, only the effect of geometrical properties is analysed, tire properties, stiffness properties, and rider body properties are kept constant. The possible geometric config-urations are explored numerically with a design of experi-ment (DOE) approach based on the space filling method pro-posed by Sobol (1967). This method compared with a ran-dom method assures a lower uncertainty for the same number of sample points (Saltelli et al., 2008) which are associated with the computational effort. The stability of each bicycle configuration is evaluated by means of numerical indices that are calculated from the eigenvalues obtained by means of the models of increasing complexity.
2 Bicycle models
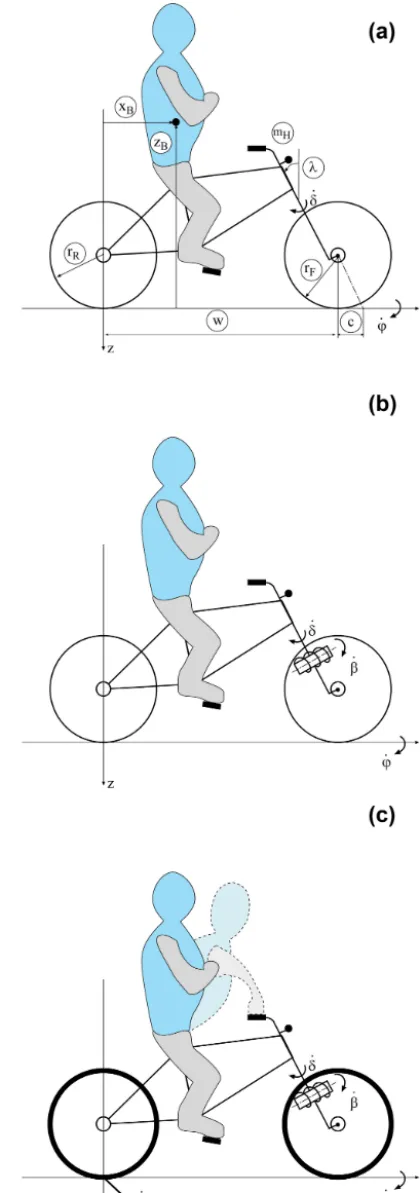
The simplest model considered in this research is the WCBM, that was checked and reviewed in Meijaard et al. (2007). This model has two velocity degrees of freedom (DOFs): the steer rotation of the handlebar around the steer-ing axis δ˙, and the roll rotation of the rear frame and rider around the longitudinal axisϕ˙. Since the bicycle components (front frame, rear frame, and wheels) and the rider are as-sumed to be rigid bodies and the wheels are asas-sumed to be rigid disks, which roll without sliding, the stability features foreseen by this model depend only on the geometric and
Table 1.Tire and fork parameters.
Parameter Value
Front-assembly stiffnesskβ (Nm rad−1) 2800 Front-assembly dampingcβ(Nm s rad−1) 25 Height of front-assembly twist axishW(m) 0.44 Cornering stiffnessCF α(–) 12.7 Camber stiffnessCF γ (–) 1.15 Self-aligning stiffnessCMα(m) 0.31 Twisting stiffnessCMγ (m) 0.052 Overturning stiffnessCMx(m) 0.015 Relaxation length due to sideslipσα(m) 0.075 Relaxation length due to camberσγ(m) 0.0075
mass properties. A set of 25 geometric and mass properties is needed to describe this bicycle model (Meijaard et al., 2007). Actually, some of these parameters cannot be affected by the designer, e.g. rear assembly (rear frame plus rider) mass and inertia chiefly depend on the properties of the rider’s body. Other parameters are interconnected, e.g. wheel mass and in-ertia depend on the radius of the wheel. For this reason, a reduced set of parameters is considered in this research, they are: the front and rear wheel radii (rF andrR), massmH of fork plus handlebar, wheelbase (w), trail (c), caster angle (λ), and the coordinates of the center of mass of the rear assem-bly (xBandzB), which largely depend on the position of the saddle. Since the aim of this research is the study of the sin-gle effect of each of these eight parameters, the mathematical model was carefully implemented in order to avoid that the variation in a parameter affects other parameters. Figure 1a shows the WCBM with the design parameters.
The second model considered in this research is the im-provement of the WCBM recently proposed in Doria et al. (2017), see Fig. 1b. This model accounts for front as-sembly compliance by introducing a revolute joint, a rota-tional spring, and a rotarota-tional damper (not shown in the fig-ure); the revolute joint defines the deformation axis of the front frame that makes possible the lateral displacement of the front wheel. Therefore, the number of DOFs increases to three, and the new variableβ˙ is the velocity about the de-formation axis of the front frame. The values of rotational stiffness and damping and the position of the deformation axis were identified by means of experimental tests and are kept constant in all the numeric calculations here reported, they are summarized in Table 1.
Figure 1.Bicycle models.
kept constant in the numerical calculations here reported. In particular, the values of cornering stiffness, camber stiffness and overturning stiffness that are reported in Table 1 are the mean values of the characteristics of six different tires tested in two laboratories. The values of self-aligning stiffness and twisting stiffness are the mean values of the characteristics of three tested tires.
In all the previous models the rider with the hands-off the handlebar is simulated assuming the center of mass and in-ertia properties as in Meijaard et al. (2007). The model de-veloped in Klinger et al. (2014) makes it possible to simulate bicycle dynamics considering the rider with the hands-on the handlebar as well. In order to avoid introducing new DOFs, the rider’s body is connected to the handlebars by means of arms equipped with joints located at the shoulders, elbows and wrists, according to the approach suggested in Schwab et al. (2012). In the hands-on model, a bent-forward posture is assumed, and the center of mass and inertia properties are modified accordingly (Moore et al., 2009).
3 Stability indices
Stability of bicycles and powered-two-wheeled vehicles usu-ally is analyzed by plotting the real and imaginary parts of the eigenvalues against forward speed (Meijaard et al., 2007). This research focuses on the stability of city bicycles and the nominal geometric and mass properties of the reference bicy-cle are set equal to the ones of the benchmark bicybicy-cle defined in (Meijaard et al., 2007). Figures 2–5 represent the eigen-value plots of the bicycle with the reference parameters of Tables 1 and 2 that are obtained carrying out stability analy-sis by means of the four models here considered.
In the field of bicycle dynamics very few stability indices have been defined. With reference to stability analysis carried out by means of the WCBM, which predicts only the weave and capsize modes, weave speedvwea, capsize speed vcap, and self-stability range Ssr2are defined, see Fig. 2. Weave speed is the lowest speed at which the weave mode becomes stable (negative real part of the eigenvalue), whereas capsize speed is the lowest speed at which the capsize mode becomes unstable.vwea andvcapare modal stability indices, because they give information about the stability of a specific mode of vibration, but they do not tell if the bicycle is globally stable or unstable. The third stability index (Ssr2) is the speed range on which the uncontrolled bicycle is stablevwea< v < vcapand it is a global stability index. These indices are very simple and clear, but they have a limit, since they do not give information about the level of stability/instability.
Figure 2.Eigenvalues against speed using the WCBM and the nominal parameters in Tables 1 and 2.
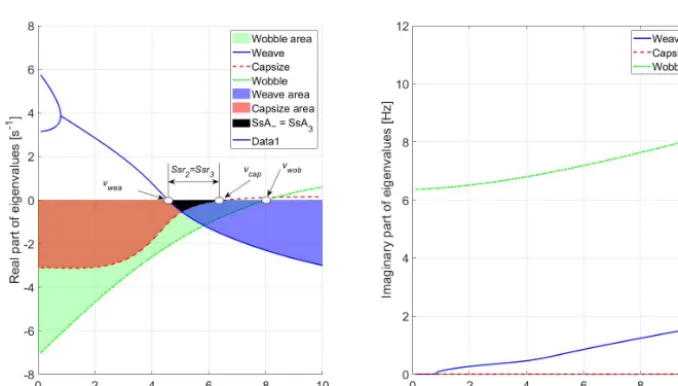
Figure 3.Eigenvalues against speed using the WCBM with CFA and the nominal parameters in Tables 1 and 2.
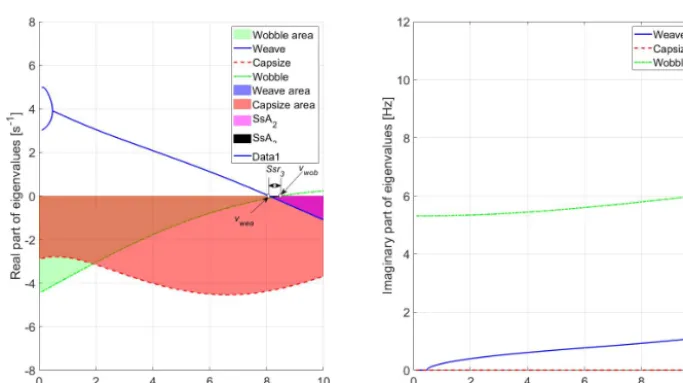
can be analyzed using the three modes stability index (Ssr3), which is the range of speeds on which all the three modes (weave, capsize and wobble) are stable. It is worth noticing that in some cases Ssr3is determined by the weave and cap-size modes only, because the wobble mode becomes unstable at speeds larger thanvcap(see Fig. 3). In other cases, Ssr3is determined by the weave mode only, because the capsize and wobble modes are always stable in the range of speed that is analyzed (see Fig. 4). In some cases, as in Fig. 5, Ssr3is determined by the weave and wobble mode, because capsize is always stable.
In order to improve the stability analysis, the concept of stability area (Doria and Roa, 2017) is used in the framework of this research.
Dealing with single mode stability, the stability area index is the area formed by the curve of the real part of an
eigen-value and the speed axis when this real part is negative:
Amode= vmax
Z
0
δmode(v)·Re(γmode(v))·dv (1)
δmode(v)=
1 Re(γmode(v))≤0
0 Re(γmode(v))>0 (2)
Figure 4.Eigenvalues against speed using the complete model and the nominal parameters in Tables 1 and 2, hands-off.
Figure 5.Eigenvalues against speed using the complete model and the nominal parameters in Tables 1 and 2, hands-on.
which seldom reach larger speeds. Racing bicycles and cer-tain electrical bicycles can operate at higher speed regimes. Some preliminary tests showed that, if the speed range is in-creased, sometimes the eigenvalue plots are not simply the extrapolations of those presented in this paper, therefore spe-cific analyses are required.
Global stability can be studied considering the self-stability area, which is the intersection of the self-stability areas of the modes. If two modes are considered:
SsA2=Awea∩Acap (3)
If three modes are considered:
SsA3=Awea∩Acap∩Awob (4)
The self-stability area index gives information about the damping of the system when all modes are stable.
4 Sensitivity analysis
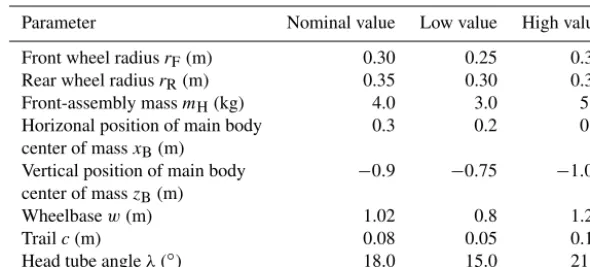
Table 2.Nominal values and ranges of geometric and mass properties.
Parameter Nominal value Low value High value
Front wheel radiusrF(m) 0.30 0.25 0.36
Rear wheel radiusrR(m) 0.35 0.30 0.37
Front-assembly massmH(kg) 4.0 3.0 5.0
Horizonal position of main body 0.3 0.2 0.4 center of massxB(m)
Vertical position of main body −0.9 −0.75 −1.05 center of masszB(m)
Wheelbasew(m) 1.02 0.8 1.24
Trailc(m) 0.08 0.05 0.11
Head tube angleλ(◦) 18.0 15.0 21.0
design parameters are considered:rR,rF,mH,xB,zB,w,c, λ.
4.1 Variance-based sensitivity of the stability indices The analysis of the interactions of the different design pa-rameters and their effect on the stability indices is per-formed through the variance-based method presented in Sobol (2001); Saltelli et al. (2008) and numerically imple-mented by Cannavo (2012). In the framework of this ap-proach, two factors are said to interact when their contri-bution to the variance of the output cannot be expressed as the sum of their single contributions. In this paper, the im-portance of the interactions between variables on the stabil-ity indices is studied. To this aim, the contribution to the total variance of the single parameters (i.e., first-order in-teractions), and the contribution to the total variance of the pairs of parameters (i.e., second-order interactions) are calcu-lated. When these contributions are calculated, the remaining variance is associated to higher-order interactions (i.e., third-order or higher).
For a design parameter Xi, the corresponding sensitivity index of its effect on the outputY is calculated as the variance of the expectation ofY conditional onXi normalized by the unconditional variance ofY, as presented in Eq. (5) (Saltelli, 2008).
Si =
V[E(Y|Xi)]
V(Y) (5)
For a pair of design parametersXi,Xj, (withi6=j) the cor-responding sensitivity index of their effect on the outputY isSij. This value is calculated as the normalized variance of the expectation ofY conditional onXi andXj minusSiand Sj, as presented in Eq. (6).
Sij =
VE Y|Xi, Xj
−V[E(Y|Xi)]−V
E Y|Xj
V(Y)
(6)
For the numerical implementation of the method, a total of 40 000 points are used for the exploration of the domain and
the evaluation of the sensitivity indices. Each parameter is sampled with a uniform probability density function, within the range defined by the lower and upper bounds presented in Table 2.
4.1.1 Variance-based sensitivity of the stability indices of the single modes
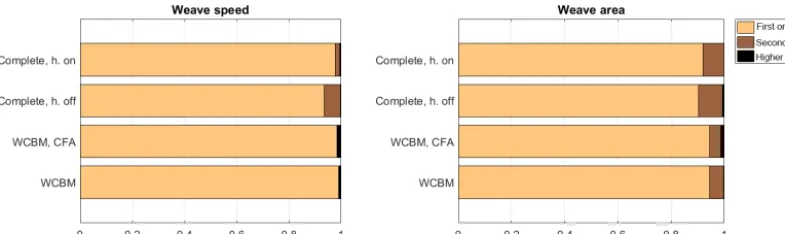
Figure 6 presents the contribution of first, second, and higher order interactions, to the variance of the weave mode indices calculated by means of the various bicycle models. The sum of the sensitivities of the weave speed index (vwea) to each single parameter (first-order interactions) explains 93.5 % or more of the total variance. The model with the lowest per-centage of the total variance explained by the first-order in-teractions is the complete model with the “hands-off” con-dition. For the same model, it is found that the first-order sensitivities explain 90.3 % of the total variance of the weave area index (Awea).
Figure 7 summarizes the results of the sensitivity analysis for the capsize mode indices, showing the contribution of the orders of interaction. First-order interactions explain 97.8 % or more of the total variance of the capsize speed index (vcap). It is worth noticing that for the complete model the capsize mode remains stable over the range of speed considered (0 to 10 m s−1). Even if capsize mode is stable, it is possible to calculate the capsize area index (Acap), which is related to the damping of this mode. It is found that for the capsize area index the complete bicycle model in “hands-on” condition has the lowest percentage of the total variance explained by the first-order interactions (97.3 %).
Figure 6.Sensitivity of the weave mode to first, second, and higher orders of interaction. Models of increasing complexity from bottom to top.
Figure 7.Sensitivity of the capsize mode to first, second, and higher orders of interaction. Models of increasing complexity from bottom to top.
the complete model in the “hands-on” condition is adopted, 90.4 % of the total variance is associated to the first-order interactions. For the wobble area index (Awob), the first-order interactions explain 85.8 % of the total variance when the WCBM with CFA is used, 86.9 % when the full model in “hands-off” condition is used, and 91.3 % when the full model in “hands-on” condition is used. Regarding the effect of the second-order interactions on vwob andAwob, the in-teraction between the two coordinates of the location of the center of mass of the main body (xB,zB) is the most relevant contribution for some models (i.e., over 5 %).
4.1.2 Variance-based sensitivity of the global stability indices of the bicycle
The analysis of the interactions of the design parameters with the global stability indices is also performed by means of the variance-based method. Figure 9 presents the contribution of first, second, and higher order interactions to the variance of Ssr2and SsA2. For these indices, the variances are mainly explained by the contribution of first order terms. The model with the largest effect of second order and high order inter-actions is the complete model with the “hands-off” condi-tion, in this case the first order interactions explain 93.3 % of the total variance of Ssr2and 89.6 % of the total variance of SsA2.
Figure 10 shows the sensitivity of Ssr3 and SsA3 to the different orders of interaction. The sum of the variances ex-plained by the first-order interactions is smaller for the 3-modes global stability indices than for the 2-3-modes global stability indices. For the Ssr3, the sum of the first-order vari-ances explains 62.2 % of the total variance in the case of the complete model in “hands-on” condition. For the complete model in “hands-off” condition, the first-order interactions explain 71.6 % of the total variance, and for WCBM the with the CFA 75.9 % of the total variance is associated to the first-order interactions. For SsA3, the first-order interactions ex-plain 52.6 % of the total variance when the complete model in “hands-on” condition is used, 70.4 % when the complete model in “hands-off” condition is used, and 72.5 % when the WCBM with CFA is used. Regarding the effect of the second-order interactions on Ssr3 and SsA3, the interaction between the radius of the front wheel and the wheelbase (rF, w) presents an important contribution for the complete model (i.e., over 5 %), and the interaction between the two coordi-nates of the location of the center of mass of the main body (xB,zB) presents a relevant contribution for the WCBM with CFA.
4.2 Correlation analysis of the stability indices
Figure 8.Sensitivity of the wobble mode to first, second, and higher orders of interaction. Models of increasing complexity from bottom to top.
Figure 9.Sensitivity of the stability indices taking into account weave and capsize to first, second, and higher orders of interaction. Models of increasing complexity from bottom to top.
and the area index. A space-filling computational experiment is used, implementing a quasi-Monte Carlo exploration of the domain based on a Sobol low discrepancy sequence (Sobol, 1967). 40 000 points are evaluated, and the results are used for the computation of the correlation coefficients.
ρxy= σxy σxσy
(7)
σx2=1
n
Xn
i=1(xi−x)
2 (8)
σy2=1
n
Xn
i=1(yi−y)
2 (9)
σxy= 1 n
Xn
i=1(xi−x)(yi−y) (10) In the present case,σyis the standard deviation of an output (e.g., capsize speed),yi are the values computed for all the simulations, andy is the arithmetic average ofyi.σx is the standard deviation of a design parameter (e.g., wheelbase), xi are the values of the parameter taken for the study, andx is the arithmetic average ofxi.σxyis the covariance between an output and a design parameter. The correlation coefficient represents the normalized measure of the strength of linear
relationship between variables, and ranges from−1 to 1. Val-ues close to 1 indicate a strong linear positive relationship between the variables; values close to−1 indicate a strong linear negative relationship between them (anti-correlation); values close or equal to 0 indicate no evidence of linear rela-tionship between variables.
4.2.1 Effect of geometric parameters on the stability of the single modes
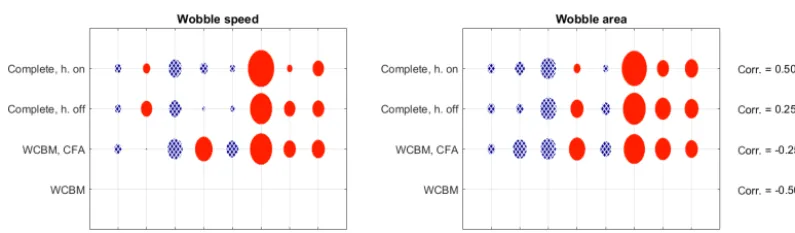
Figures 11, 12, and 13 summarize the results of the correla-tion analysis. The correlacorrela-tion coefficients are shown in solid red when they represent positive correlations, and in dotted blue when they represent negative correlations. The circles that represent each correlation coefficient have an area that is proportional to the magnitude of the index.
Figure 10.Sensitivity of the stability indices taking into account the three modes to first, second, and higher orders of interaction. Models of increasing complexity from bottom to top.
Figure 11.Correlation coefficients for the indices of the weave mode. Models of increasing complexity from bottom to top. Speed range: 0 to 10 m s−1.
of front assembly compliance does not strongly modifyvwea andAwea, there are only minor variations in the values of the correlation coefficients. When the full bicycle model is con-sidered (with front assembly compliance and sliding tires) most of the bicycle parameters roughly show the same effect on vwea andAwea that they showed with the simpler mod-els. The exception is the effect ofxBandλonvwea, because with the full model when these parameters increase, there is a decrease invwea(stabilizing effect).
Therefore, as far as the weave mode is concerned, it can be stated that the predictions on weave stability made by the simplest models are confirmed when more complex models are adopted, there are only some variations in the relative importance of the various parameters.
All the previous results dealt with the hands-off condition, the full model makes it possible to study the hands-on con-dition as well. Positioning the rider’s hands on the handlebar has a very small influence on the stability of the weave mode considering both the weave speed index and the weave area index.
Figure 12 makes it possible to analyze the effect of geo-metric parameters on the stability of the capsize mode. The basic WCBM shows thatc,rF, andxBhave a strong corre-lation with the capsize speed index: an increment inrFhas a de-stabilizing effect, because it decreases the capsize speed, whereas increments onxBorchave a stabilizing effect. The analysis of capsize stability by means of the capsize area
in-dex confirms the previous results but shows that zB has a moderate influence on capsize stability. The inclusion in the model of front assembly compliance does not influence the capsize stability indices. Conversely, the introduction of slid-ing tires in the bicycle model has a very large effect on the capsize mode, which remains stable on the full range. The correlation coefficients of the capsize area index calculated by means of the full model with hands-on the handlebar are in good agreement with the correlation coefficients calcu-lated by means of the simpler models, only the effects ofc, wandλare different. The simpler models present a strong positive correlation of the capsize area andc, and the com-plete model has only a weak correlation for the same pair. With the simpler models the coefficients ofw andλ show a weak positive correlation, whereas with the full model the correlation coefficient ofw is negative and large, while the correlation coefficient of λ is negative but negligible. The correlation analysis (carried out by means of the full model) shows that the “hands-on” condition has negligible effect on capsize stability.
param-Figure 12.Correlation coefficients for the indices of the capsize mode. Models of increasing complexity from bottom to top. Speed range: 0 to 10 m s−1.
Figure 13.Correlation coefficients for the indices of the wobble mode. Models of increasing complexity from bottom to top. Speed range: 0 to 10 m s−1.
etermHhas a negative correlation coefficient (de-stabilizing effect). The correlation coefficients of Awob calculated by means of the same model have a similar trend, with only two noticeable differences: a moderate negative correlation coefficient ofrFwithAwob, and an increased positive corre-lation coefficient ofcwithAwob. When the sliding behavior of tires is considered, there are two phenomena that are in-dependently able to generate a wobble mode: front assembly compliance (Doria et al., 2017) and tire model with relax-ation length (Sharp, 2008). Correlrelax-ation coefficients ofvwob and geometric parameters calculated by means of the hands-off model show that the most influential parameters have the same effect on wobble stability they showed with the WCBM with CFA. Only parameterxBhas a different effect on wob-ble stability with a negligiwob-ble correlation with wobwob-ble speed. Correlation analysis betweenAwoband the geometric param-eters shows results very similar to the ones obtained with the WCBM with CFA, only the correlation coefficient ofxBis weaker but it maintains the same sign. Correlation analysis carried out with the full model with hands-on the handlebar shows some differences with respect to the hands-on case, but all the parameters maintain the same effect on stability.
4.2.2 Effect of geometric parameters on the global stability of the bicycle
Figure 14.Correlation coefficients for the stability indices taking into account weave and capsize. Models of increasing complexity from bottom to top. Speed range: 0 to 10 m s−1.
Figure 15.Correlation coefficients for the stability indices that consider the three modes (i.e., capsize, weave, and wobble). Models of increasing complexity from bottom to top. Speed range: 0 to 10 m s−1.
latter effect being stronger thus the self-stability range in-creases withc. Conversely, in the full modelcincreasesvwea (de-stabilizing effect) but it has no effect onvcap, hence the self-stability range decreases ifcincreases. A similar argu-ment holds true for the effect ofrF. The self-stability range of weave and capsize slightly changes if the full model with hands-on is considered. Figure 14 also shows that the geo-metric parameters influence the SsA2 index roughly in the same way they influence Ssr2.
The simplest model that can be used for calculating the self-stability indices taking into account three modes (weave, capsize, and wobble) is the WCBM with front compliance, see Fig. 15.
Correlation analysis shows that in this case parameter xB has the highest stabilizing effect followed by w andc, whereas parameterzBhas the highest destabilizing effect fol-lowed by mH andrF. When tire sliding is included in the model, parametersmH,zB, andwmaintain their correlations on Ssr3 and SsA3, only with small changes in magnitude. Parameter xB reduces its correlations with Ssr3 and SsA3, whereas parametercchanges the sign of its correlations with Ssr3and SsA3. When the tire sliding is included, the impor-tance ofrFgrows and takes on a strong stabilizing effect. On the one hand, tire properties did not show a very large influ-ence onvwobandAwob(see Fig. 13). On the other hand, when tire sliding is included in the model the correlation
coeffi-cients ofcandrF show similar changes in both the stability of two and three modes. Therefore, it may be concluded that these phenomena are mainly related to capsize and weave stability. Actually, Figs. 3 and 4 show that the large differ-ences in the stability range and area that take place when tire sliding is considered are mainly due to the modifications in the loci of capsize and weave. Finally, the full model makes it possible to analyze the effect of geometric parameters on Ssr3 andSsA3 with hands-on the handlebar. There are not large differences with respect to the hands-off case, but pa-rameterxBwith hands-on has a weak de-stabilizing effect.
The comparison between the stability indices calculated with 2 and 3 modes shows that some parameters change their effect on stability: with 3 modes the increase in w has a strong stabilizing effect, instead of the weak de-stabilizing effect that it has with 2 modes; additionally, with 3 modes the increase inmH has a weak de-stabilizing effect, instead of the negligible effect that it has with 2 modes. This phe-nomenon is due to the large effect ofwandmH on wobble stability (see Fig. 13).
5 Conclusion
unstable at the highest speeds considered in the framework of this research (i.e., 10 m s−1for a city bicycle). Nevertheless, the stability features of weave and capsize are not strongly modified and the effects of the geometric and mass proper-ties on the stability of these modes that are predicted by the WCBM still hold true. The analysis of the global stability indices (Ssr and SsA) shows that some parameters (mH,w) have an effect on the global stability of the three modes oppo-site to the one they showed in the WCBM, considering only weave and capsize modes. This happens becausemH andw has a strong effect of wobble stability.
The introduction of tire slip in the model has an impor-tant effect on stability, because not only the wobble mode appears, but also the capsize mode becomes stable over the whole range of speeds. Therefore, even if the influence of the various geometric and mass properties on the stability of the single modes (weave and capsize) is very similar to the one predicted by the WCBM, the effect on global stability is often different. This phenomenon takes place because some parameters have opposite effects on the stability of weave and capsize and in the simple WCBM their effect on global stability derives from a combination of the effects they have on the single modes. Conversely, in the presence of tire slip, the capsize mode is always stable and no longer relevant, thus the combined effects do not take place, and global stability is dominated by the weave and wobble modes. Only param-etersxBandzBmaintain the effect of stability they showed in the WCBM.
A different posture of the rider with hands-on the handle-bar does not strongly change the effect of mass and geometric parameters on the stability indices. The most important effect is that with hands-onxBhas a small de-stabilizing effect.
According to the presented results, it is possible to state that the simple WCBM gives useful hints for understanding the physical phenomena determining bicycle stability, espe-cially at low speed. The simpler models give more accurate information about the stability of the single modes than about the global stability of the bicycle; therefore they can be use-ful when the stability of a single mode is the main concern, because the other modes can be stabilized by the rider, or become unstable at very high speed. Generally speaking, a full bicycle model is strongly recommended for studying the global stability properties of actual bicycles.
Data availability. All the data used in this manuscript can be ob-tained by request from the corresponding author.
Author contributions. AD coordinated the research activity and analyzed the results. SR developed the numerical codes and carried out the simulations. LM developed the correlation analysis and an-alyzed the results.
Competing interests. The authors declare that they have no con-flict of interest.
Financial support. This research has been partially supported by the Colombian Administrative Department of Science, Technology, and Innovation (Colciencias) (grant no. Doctorate Formation Pro-gram 617 of 2013).
Review statement. This paper was edited by Anders Eriksson and reviewed by James Sadauckas and one anonymous referee.
References
Bulsink, V., Doria, A., van de Belt, D., and Koop-man, B.: The effect of tyre and rider properties on the stability of a bicycle, Adv. Mech. Eng., 7, 1–19, https://doi.org/10.1177/1687814015622596, 2015.
Cannavo, F.: Sensitivity analysis for volcanic source modeling qual-ity assessment and model selection, Comput. Geosci., 44, 52–59, https://doi.org/10.1016/j.cageo.2012.03.008, 2012.
Carvallo, E.: Théorie du mouvement du monocycle et de la bicy-clette, Gauthier-Villars, Paris, France, 1899.
Cossalter V., Doria A., Pegoraro R. and Trombetta L.: On the non-linear behaviour of motorcycle shock absorbers, Proceedings of the Institution of Mechanical Engineers, Part D: Journal of Automobile Engineering, 224, 15–27, https://doi.org/10.1243/09544070JAUTO1273, 2010.
Doria, A. and Roa, S.: On the influence of tyre and structural proper-ties on the stability of bicycles, Vehicle Syst. Dyn., 56, 947–966, https://doi.org/10.1080/00423114.2017.1403032, 2017. Doria, A. and Tognazzo, M.: The influence of the dynamic
re-sponse of the rider’s body on the open-loop stability of a bicy-cle, Proceedings of the Institution of Mechanical Engineers, Part C: Journal of Mechanical Engineering Science, 228, 3116–3132, https://doi.org/10.1177/0954406214527073, 2014.
Doria, A., Tognazzo, M., Cusimano, G., Bulsink, V., Cooke, A., and Koopman, B.: Identification of the mechanical properties of bicy-cle tyres for modelling of bicybicy-cle dynamics, Vehibicy-cle Syst. Dyn., 51, 405–420, https://doi.org/10.1080/00423114.2012.754048, 2013.
Doria, A., Favaron, V., Taraborrelli, L., and Roa, S.: Parametric analysis of the stability of a bicycle taking into account geomet-rical, mass and compliance properties, Int. J. Vehicle Des., 75, 91–123, https://doi.org/10.1504/IJVD.2017.090908, 2017. Dressel, A. and Rahman, A.: Measuring sideslip and camber
char-acteristics of bicycle tires. Vehicle Syst. Dyn., 50, 1365–1378, https://doi.org/10.1080/00423114.2011.615408, 2012.
Klinger, F., Nusime, J., Edelmann, J., and Plöchl, M.: Wob-ble of a racing bicycle with a rider hands on and hands off the handlebar, Vehicle Syst. Dyn., 52, 51–68, https://doi.org/10.1080/00423114.2013.877592, 2014.
Limebeer, D. and Sharp, R.: Bicycles, motorcycles, and models, IEEE Contr. Syst. Mag., 26, 34–61, https://doi.org/10.1109/MCS.2006.1700044, 2006.
Meijaard, J., Papadopoulos, J., Ruina, A., and Schwab, A.: Lin-earized dynamics equations for the balance and steer of a bicy-cle: a benchmark and review, Proc. R. Soc. A, 463, 1955–1982, https://doi.org/10.1098/rspa.2007.1857, 2007.
Moore, J., Hubbard, M., Kooijman, J., and Schwab, A. L.: A method for estimating physical properties of a combined bicycle and rider, in: Proceedings of the ASME 2009 International De-sign Engineering Technical Conferences, San Diego, California, USA, 30 August–2 September 2009, DETC2009-86947, 2011– 2020, 2009.
Plöchl, M., Edelmann, J., Angrosch, B., and Ott, C.: On the wobble mode of a bicycle, Vehicle Syst. Dyn., 50, 415–429, https://doi.org/10.1080/00423114.2011.594164, 2012.
Roa, S., Doria, A., and Muñoz, L.: Optimization of the bicycle weave and wobble modes, in: Proceedings of the ASME 2018 International Design Engineering Technical Conferences, Que-bec City, QueQue-bec, Canada, 26–29 August 2018, V003T01A022, 2018.
Saltelli, A., Ratto, M., Andres, T., Campolongo, F., Cariboni, J., Gatelli, D., Saisana, M., and Tarantola, S.: Global sensitivity analysis: the primer, John Wiley & Sons, West Sussex, England, 2008.
Schwab, A., Meijaard, J., and Kooijman, J.: Some recent develop-ments in bicycle dynamics, in: Proceedings of the 12th IFToMM World Congress in Mechanism and Machine Science, Besançon, France, 18–21 June 2007, 1–6, 2007.
Schwab, A., Meijaard, J., and Kooijman, J.: Lateral dy-namics of a bicycle with a passive rider model: stabil-ity and controllabilstabil-ity, Vehicle Syst. Dyn., 50, 1209–1224, https://doi.org/10.1080/00423114.2011.610898, 2012.
Sharp, R.: On the stability and control of the bicycle, Appl. Mech. Rev., 61, 060803, https://doi.org/10.1115/1.2983014, 2008. Sobol, I.: On the distribution of points in a cube and the approximate
evaluation of integrals, USSR Comp. Math. Math+, 7, 86–112, https://doi.org/10.1016/0041-5553(67)90144-9, 1967.
Sobol,: I. Global sensitivity indices for nonlinear mathemati-cal models and their Monte Carlo estimates, Math. Com-put. Simulat., 55, 271–280, https://doi.org/10.1016/S0378-4754(00)00270-6, 2001.
Souh, B.: Influence of tire side forces on bicycle self-stability, J. Mech. Sci. Technol., 29, 3131–3140, https://doi.org/10.1007/s12206-015-0711-z, 2015.