R E S E A R C H
Open Access
Automated classification for HEp-2 cells based
on linear local distance coding framework
Xiang Xu
1, Feng Lin
1*, Carol Ng
2and Khai Pang Leong
2Abstract
The occurrence of antinuclear antibodies (ANAs) in patient serum has significant relation to some specific
autoimmune diseases. Indirect immunofluorescence (IIF) on human epithelial type 2 (HEp-2) cells is the recommended methodology for detecting ANAs in clinic practice. However, the currently practiced manual detection system suffers from serious problems due to subjective evaluation. In this paper, we present an automated system for HEp-2 cells classification. We adopt a bag-of-words (BoW) framework which has shown impressive performance in image classification tasks because it can obtain discriminative and effective image representation. However, the information loss is inevitable in the coding process. Therefore, we propose a linear local distance coding (LLDC) method to capture more discriminative information. Our LLDC method transforms original local feature to more discriminative local distance vector by searching for local nearest few neighbors of the local feature in the class-specific manifolds. The obtained local distance vector is further encoded and pooled together to get salient image representation. The LLDC method is combined with the traditional coding methods to achieve higher classification accuracy. Incorporated with a linear support vector machine classifier, our proposed method demonstrated its effectiveness on two public datasets, namely, the International Conference on Pattern Recognition (ICPR) 2012 dataset and the International Conference on Image Processing (ICIP) 2013 training dataset. Experimental results show that the LLDC framework can achieve superior performance to the state-of-the-art coding methods for staining pattern classification of HEp-2 cells.
Keywords: Indirect immunofluorescence; HEp-2 cells classification; Linear local distance coding; Local distance vector
Introduction
Indirect immunofluorescence (IIF) image analysis has become a hot research topic in recent years. The IIF on human epithelial type 2 (HEp-2) cells is the hallmark protocol for detecting antinuclear antibodies (ANAs) in patient serum, which are in connection with the occur-rence of autoimmune diseases such as rheumatoid arthri-tis, systemic lupus erythematosus, and multiple sclerosis [1]. If the ANAs are contained in patient serum, they bond to the nuclei of the HEp-2 cells, forming a molecu-lar complex. Unbound antibodies will be washed off and a fluorescein-conjugated anti-human immunoglobulin will be retained. Washing after the second incubation will remove any unbound secondary immunoglobulin. The ANAs are finally revealed as fluorescent cells under the fluorescence microscope. The fluorescence intensity and
*Correspondence: [email protected]
1School of Computer Engineering, Nanyang Technological University, 50 Nanyang Ave., 639798, Singapore, Singapore
Full list of author information is available at the end of the article
the positive staining patterns for each slide image are identified by highly qualified and skillful physicians.
Due to the effectiveness and high quality of IIF image analysis, we have witnessed a growing demand for diag-nostic tests for systemic autoimmune diseases using IIF strategy. However, it is evaluation subjective, labor inten-sive, and time consuming [2]. Hence, computer-aided diagnostic (CAD) systems aiming to determine the pres-ence of ANAs in the IIF images, offers a solution to overcome all the above limitations and lead to more reli-able test results. The typical flow consists of six main techniques, namely, automated preparation of slides with robotic devices [3], image acquisition [4,5], image seg-mentation [6], mitotic cell recognition [7], fluorescence intensity classification [8], and staining pattern recogni-tion [2,9]. While all aspects of the CAD systems contribute to the automation of IIF procedure in one way or another, staining pattern classification is the most challenging task in the research community. Classifying images into mean-ingful categories is a challenging and important task [10].
Moreover, compared with the visual signal in the general object classification, HEp-2 cells do not contain abundant structural information. In addition, the features between various HEp-2 cells are much more similar than those between different objects or natural scene images. There-fore, in this study, we investigate into the feature extrac-tion and machine learning methods for automatic staining pattern classification of HEp-2 cells.
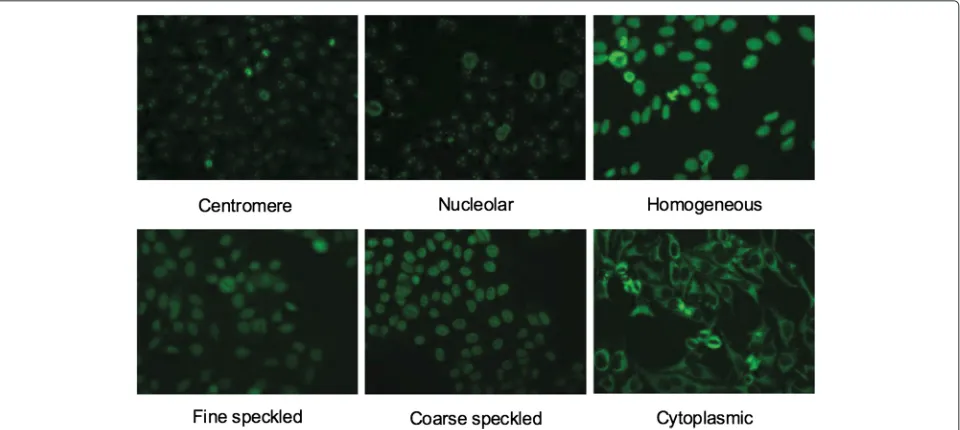
The most frequent staining patterns of HEp-2 cells in clinical practice are as follows [11]:
• Centromere: characterized by 40 to 60 discrete speckles distributed throughout the interphase nuclei and characteristically found in the condensed nuclear chromatin during mitosis as a bar of closely
associated speckles;
• Nucleolar: characterized by large coarse speckles within the nucleoli of interphase cells, with less than six speckles per cell;
• Homogeneous: characterized by a uniform diffuse fluorescence of the entire interphase nuclei and fluorescence of the chromatin of mitotic cells; • Fine speckled : characterized by a fine granular
nuclear staining of interphase cell nuclei in a uniform distribution;
• Coarse speckled : characterized by dense, intermediate-sized particles in interphase nuclei together with large speckles;
• Cytoplasmic: characterized by staining of the cytoplasm exclusive of the nucleus.
In addition, two staining patterns less frequent occur-ring in practical clinic are also considered in this paper:
• Nuclear membrane: a smooth homogeneous ring-like fluorescence of the nuclear membrane in interphase cells;
• Golgi : staining of a polar organelle adjacent to and partly surrounding the nucleus, composed of irregular large granules.
Examples of specimen images with the most frequent staining patterns are shown in Figure 1.
The most popular image classification framework con-sists of two major modules: bag-of-words (BoW) and spatial pyramid matching (SPM). In the framework, an image representation is generated via the following steps. Firstly, local descriptors are extracted from the image. Then, a pre-defined codebook is applied to encode the local descriptors into codes accordingly. Next, the image is divided into increasingly finer subregions. Multiple codes from each subregion are pooled together. Finally, the final image representation is generated by concatenating the histograms from all subregions together.
The framework of SPM based on BoW has been success-fully applied to image classification [12,13], and in recent years, it has been improved for HEp-2 cell classification [14,15]. It seems to be suitable for the HEp-2 cell classi-fication task. Within the framework, how to encode each local feature has significant impact on the final classifica-tion performance. The tradiclassifica-tional and the simplest coding method is vector quantization (VQ) [16], which assigns a local feature to the closest visual word in the code-book, introducing unrecoverable discriminative informa-tion loss. The soft assignment (SA) coding method [17-19] is proposed to reduce information loss by assigning a local feature to different visual words according to its
memberships to multiple visual words. Apart from infor-mation loss, traditional SPM based on VQ has to use a classifier with nonlinear Mercer kernels, resulting in addi-tional computaaddi-tional complexity and reducing scalability for real application. To alleviate these limitations, sparse-coding-based SPM (ScSPM) [12], local coordinate coding (LCC) [20], and locality-constrained linear coding (LLC) [13] aim at obtaining a nonlinear feature representation which works better with linear classifiers.
All the improved methods represent images more accurately and achieve impressive image classification performance. However, information loss in feature quan-tization is still inevitable and affects the performance for good image classification performance. To avoid informa-tion loss caused by coding, naive Bayes nearest neighbor (NBNN) method [21] is proposed by retaining all of the feature descriptors. It shows competitive classification performance with coding-based methods as it alleviates information loss and keeps the discrimination of input features. However, NBNN is sensitive to noisy features and easy to be dominated by outlier features. To simulta-neously inherit the advantage of the BoW framework and the NBNN method, linear distance coding (LDC) method [22] has been proposed recently to utilize the discrimina-tive information lost by the traditional coding methods. It transforms each local feature into adistance vectorvia calculating neighbors in every class-specific manifold.
In this paper, we propose a novel linear local distance coding (LLDC) method to increase the accuracy of stain-ing patterns classification. The LLDC method adopts fea-ture extraction-coding-poolingframework based onlocal distance vector which is a modification of the distance vector. Local distance vector is generated by using only the local neighbors in a merged feature dataset instead of calculating neighbors in every class-specific feature dataset. Therefore, it can ignore disturbance from iso-lated classes. Using image-to-class distance makes it more class-specific as desired for classification. Meanwhile, dis-tance vector in LDC method is obtained by using a linear coding scheme which aggravates the information loss. Local distance vector is only based on Euclidean distance and avoids coding process in distance vector transforma-tion, therefore it is more discriminative. In additransforma-tion, it is proved that image representations via coding distance pat-terns are complementary to the ones from the original coding methods [22]. Therefore, we directly concatenate the image representations based on local distance vector and local features to achieve superior performance.
In summary, the main contributions of this study are as threefold: (i) we propose a novel local distance vec-tor based on the image-to-class distance. It is more class specific than original local feature. Unlike distance vector, it eliminates the need to calculate the distance for each class, therefore it can speed up the calculation and achieve
better classification performance by ignoring the distur-bance from the distant classes. (ii) We propose a LLDC method based on the transformed local distance vector. It takes the advantages of BoW framework and NBNN method. It reduces the information loss caused by tra-ditional coding methods while capturing salient features. (iii) The image representations produced by the LLDC method are complementary to the ones from the origi-nal coding methods. Their combination can yield superior performance compared with only using single represen-tation. Experiments on two public HEp-2 cells datasets consistently show that the image representation produced by the LLDC framework achieves better performance compared with state-of-the-art coding methods.
The rest of the paper is organized as follows. ‘Related work’ section introduces some related publications on HEp-2 cells classification. ‘Distance vector’ section pro-poses the linear local distance coding framework. Experi-mental results are reported in the ‘Experiments and anal-yses’ section. Finally, ‘Conclusions’ section concludes this work.
Related work
To overcome the limitations in manual inspection, feature extraction and machine learning methods have recently been used in automatic staining pattern classification of HEp-2 cells. In the literature, Perner et al. [23] use auto-matic thresholding via Otsu’s algorithm to segment the individual cells, followed by extracting a set of textural fea-tures and use decision tree classifier. Soda et al. [24] utilize a multiple expert system based on a set of specific features related to statistical and spectral components to assign the pattern of single cell. Cordelli and Soda [25] experi-mentally compare four different methods for converting a color image into a gray scale one, which are weighted con-version, green channel, intensity channel, and Helmholtz-Kohlrausch (HK) conversion. By considering a heteroge-neous set of features, e.g., statistical descriptors, spectral measures, and morphological descriptors, AdaBoost clas-sifier based on intensity channel achieves the best average performance. To extract features of the slide images with-out segmentation, our group verifies the effectiveness of scale invariant feature transform (SIFT) for represent-ing HEp-2 slide images [26]. Wiliem et al. [27] propose a dual-region codebook-based descriptor combined with the nearest convex hull classifier.
Aforementioned works are based on private datasets and/or different experimental protocols. While each of them addresses one or two aspects in technical advance-ment, it is difficult in reproduction of their procedures and comparative study in their performance.
first edition of the HEp-2 Cells Classification Contest hosted by the International Conference on Pattern Recog-nition (ICPR) 2012 with a publicly available HEp-2 cell database (ICPR 2012 dataset) was released. Applying the same database and experimental protocol, different sys-tems can be compared and evaluated based on the bench-mark. Nosaka et al. [28] utilize an extension of local binary pattern (LBP) descriptor, named co-occurrence of adjacent local binary patterns (CoALBP), to extract textural features. Using linear support vector machine (SVM), their method won the first prize in HEp-2 cell classification contest with around 69% of classification accuracy. Xiangfei et al. [11] extract statistical intensity features. After a normalization step, a global texton dic-tionary is built via K-means clustering which is used to encode images’ features into frequency histograms. They utilize the kNN classifier with χ2 distance. Li et al. [29] extract LBP, Gabor, discrete cosine transform (DCT), and some global appearance-based statistical fea-tures for image representation. Then, a combination of SVMs using a modified AdaBoost.M1 is used in order to improve classification performance. Liu and Wang [11] adopt a deep learning scheme to automatically learn the discriminative features from dense image patches. Follow-ing a BoW pipeline, a linear SVM is learned based on the BoW representations. Ghosh and Chaudhary [30] test the performance of various features like BoW representation based on speeded-up robust features (SURF), region-of-interest (ROI)-based feature, texture-based feature, and normalized histogram of orientated gradients (HOG) fea-tures. Experimental results show that the combination of HOG, texture-, and ROI-based features using SVM clas-sifier achieves the best classification performance. All the participated methods are reported in [11] for reference.
Inspired by the first edition of the contest for HEp-2 cells classification, increasing researches aroused for improving the performance of HEp-2 cells classification. Based on the same dataset (ICPR 2012 dataset) and exper-imental protocols, researchers can evaluate their work in a more convincing way. For example, Di Cataldo et al. [31] propose a classification approach based on subclass discriminant analysis (SDA) using the integration of mor-phological, global, and local texture features. It obtains an accuracy of 72.2%. Liu and Wang [32] utilize the linear projections of the image pixels as the descriptors and pro-pose a multi-projection-multi-codebook strategy to gen-erate multiple pooled vectors for the image. The pooled vectors are concatenated to get the final image represen-tation. It can achieve an overall classification accuracy of 66.6%.
Methodology
In this section, we present the details of the proposed coding method called the LLDC method based on local
distance vector. Our proposed method maintains superior discriminative capability and effectiveness of the tradi-tional coding-based methods. It provides better gener-alization capability by using the distance between local feature and certain class to estimate image membership. Meanwhile, it preserves more discriminative information by avoiding coding process while obtaining image-to-class distance. Furthermore, the LLDC method avoids poor estimates from isolated classes by eliminating the need to calculate distance vector for each class. Hence, the LLDC method can achieve superior image classification performance compared with the other coding schemes.
Distance vector
The essential idea of LDC method [22] is to calculate the distance vector which is an alternative discrimina-tive pattern of local feature in theclass-specific manifold coordinatesystem.
Let X = {x1,x2,. . .,xN} ∈ RD×N be a set of D-dimensional local features extracted from an image. It is assumed that the local features of each class are sampled from a class-specific manifoldMc = mc1,mc2,. . .,mcnc, which is determined by clustering local features of the training images from the corresponding class c. Then, the distance vector which denotes the distance between a local featurexiand classcis computed by:
d(xi,c)=xi−xci 2
2, (1)
wherexci denotes the mapped point ofxiin classc. It can be computed as a linear combination of its neighboring features in the manifoldMc. The LDC method calculates
xci as follow:
min uc
i
xi−Mcuci 2
2, (2)
s.t. ucij=0, if mcj ∈Nik
1Tuci =1,∀i
whereuci =
uci1,uci2,. . .,ucin c
is the linear coefficient of
xion the manifoldMcandNikdenotes the set ofknearest neighbors ofxi onMc. Then, the distance vector can be redefined as:
dci =d(xi,c)=xi−xci 2
2 =xi−M cuc
i 2
2. (3) Each local feature of an image is transformed to its dis-tance vectordi =
d1i,di2,. . .,dCi , whereC is the class number.
vector is obtained by utilizing the approximate fast solu-tion of the LLC coding method which inherently induces information loss. Meanwhile, distance vector treats every class equally because it is produced through calculating the distance from local feature to each class. Such oper-ation easily brings in the uncorrelated informoper-ation of classes which are far from query local feature, and con-sequently arouses unnecessary interference. Therefore, distance vector can be improved further to perform better in image classification tasks.
Local distance vector
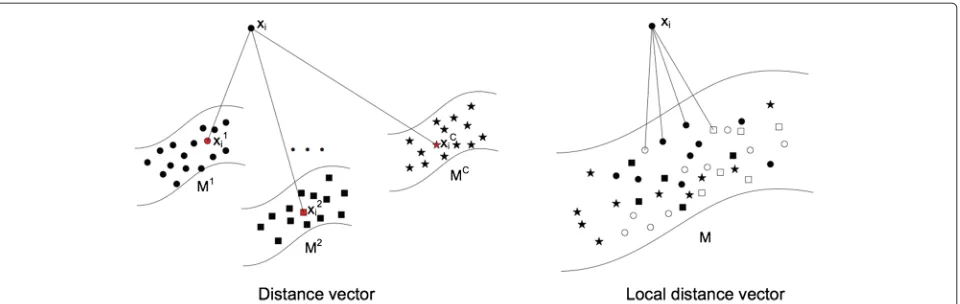
It is verified that using the distance between local fea-ture and classes (i.e., image-to-class distance) can provide better generation capability. We propose a novel dis-tance pattern, called local disdis-tance vector, to define the distance from local feature to a specific class. Local dis-tance vector eliminates the need to search for the nearest few neighbors in every class-specific manifold to gen-erate distance vectors. Instead, it merges all the class-specific manifolds together to form a single dataset, i.e., M = M1,M2,. . .,MC = {mi}ni=1, where mi is called ‘anchor points’ [33] andnis the total number of points. To obtain the class-specific distance, we search for k nearest neighbors of a local feature xi in M, denoted as NN(xi,k) = {p1,p2,. . .,pk} ∈ M. Each neighborpihas a label Class{pi}identifying it belongs to which class. We define the distance fromxito those classes found in thek nearest neighbors as follow:
ˆ
dic=min{pj|Class(pj)=c}xi−pj22 . (4) The difference between distance vector and local dis-tance vector is shown in Figure 2. Our proposed local distance vector is less influenced by isolated classes since it only calculates distance vector for some classes which are close to the query feature. On the con-trary, distance vector has to calculate the distance between the local feature and each class; it is inevitable to bring in some irrelative information from distant classes.
For those classes that are not found in the k nearest neighbors, we use the distance to thek+1 nearest neigh-bors ofxi to estimate the class-specific distance. And the local distance vector of the local featurexiis denoted as
ˆ di =
ˆ
d1i,dˆi2,. . .,dˆCi
. The local distance vectors of an image is described in Algorithm 1.
Unlike the original local features, local distance vec-tor is more class specific as desired for classification. Such class-specific distance captures the underlying man-ifold structure of the local features [22]. Meanwhile, it is obtained by using its nearest few neighbors avoid-ing codavoid-ing process and ignoravoid-ing some irrelative classes
Algorithm 1 Local distance vector Input:
Local features{xNi=1}of a input imageI; the merged datasetM.
Output:
Local distance vectorsdˆi,i=1, 2,. . .,N.
fori←1;i≤N;i←i+1do p1,p2,. . .,pk+1
←NN(xi,k+1)
ifcategorycis found in theknearest neighbors ofxi
then ˆ
dci =min{pj|Class(pj)=c}xi−pj22.
else ifcategorycis not found in theknearest neigh-borsthen
ˆ
dci =xi−pk+122. end if
Obtaindˆi=
ˆ
d1i,dˆ2i,. . .,dˆCi
for the local descriptor
xi.
end
far from the local feature. Thus, it gains stronger dis-criminative capability and more robustness to noise and outlier features. Local distance vector obtains another advantage inherited from distance pattern, that is, all local distance vectors within the same class are more similar in the distance feature space due to the class-specific characteristic. Therefore, it can cooperate better with following pooling procedure. Furthermore, the cal-culation of local distance vector is significantly faster than that of distance vector because it is produced by searching for nearest neighbors within a merged reference dataset.
Linear local distance coding framework
Our proposed LLDC method utilizes local distance vec-tor to generate discriminative and effective image fea-tures, then adopts coding-pooling framework to obtain robust image representation. To verify the effectiveness and generalization of the proposed local distance trans-formation, we apply two different linear coding method respectively, i.e., locality-constrained LLC [13] and local soft-assignment coding method (LSC) [19], to encode local distance vectors due to their high efficiency and prominent performance.
Let X = {x1,x2,. . .,xN} ∈ RD×N be a set of D-dimensional local features extracted from an image. Given a codebook learned beforehand withMentities, i.e.,B= {b1,b2,. . .,bM} ∈ RD×M, the codes of an imageY =
Figure 2Distance vector vs. local distance vector.xiis a query local feature. Distance vector searches the mapping pointxiwhich is determined by the nearest few neighbors in each manifoldMc. Local distance vector retrieves only the local neighborhood inM=M1,M2,. . .,MC.
resulting LLC codes of an image can be calculated via following criteria:
min Y
N
i=1
xi−Byi22+λeiyi22, (5)
s.t. 1Tyi=1,∀i
where is element-wise multiplication, ei ∈ RM is the locality adaptor that measures the similarity between the input descriptor xi and codebook entities bj, and it is defined as:
eij=exp
xi−bj2
σ
, (6)
whereσ is used to adjust weight-decay speed for locality adaptor.
With respect to the LSC method, it assigns a local fea-ture to the k nearest visual words of the codebook as follows:
yij= exp
−βd˜xi,bj
M
l=1exp
−βd˜(xi,bl)
, (7)
˜
d(xi,bl)=
d(xi,bl) , if bl ∈Nk(xi)
0 , otherwise.
whered˜(xi,bj)is the local version ofd(xi,bj)which is the original distance betweenxiandbj, andNk(xi)defines the knearest neighbors ofxiin codebook.
Within the proposed LLDC framework, the local dis-tance vectors are transformed from local features, then the local distance vector and the original local feature are separately encoded and pooled to generated two image representations. It is verified that the image representa-tions produced by the coding methods based on distance patterns are complementary to the ones from the original coding methods [22]. Consequently, we directly concate-nate them to extract more discriminative and descriptive image representation.
An overview of the LLDC framework is shown in Figure 3 including following steps:
(1) The local features,X= {xi}Ni=1, are extracted from every image;
(2) The local distance vectors,dˆ =
ˆ di
N
i=1, are transformed from local features one-by-one following Algorithm 1;
(3) Local distance vectors are encoded by using LSC or LLC coding scheme based on a pre-trained codebook
B= {bi}Mi=1;
(4) Max-pooling strategy is performed on the codes within each spatial subregionIas follow:
V
ˆ
d=max
yk|yk ∈I
, (8)
where max is performed element wisely for the involved vectors in each subregion and
=1, 2,. . .,Lis the numbering of subregions; (5) The image representation based on local distance
vector can be generated by concentrating all the pooled features from every subregion, i.e.,
Vdˆ=
V1
ˆ
d;V 2
ˆ
d;. . .;V
L
ˆ
d
. And the representation is normalized by:
Vdˆ =Vdˆ/Vdˆ 2; (9) (6) The original local features are also aggregated under
the coding-pooling framework through steps 3 to 5 to get the image representationV; and
(7) The final image representation obtained by combining aforementioned two image
representationsVdˆandVis fed into a linear SVM classifier to classify the staining patterns of HEp-2 cells.
Experiments and analyses
In this section, we verify the effectiveness and improve-ment of our proposed LLDC framework for HEp-2 cells classification.
Dataset
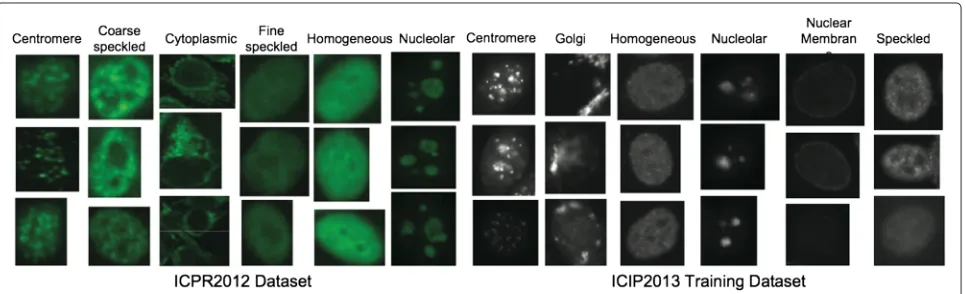
In order to evaluate the performance of the proposed LLDC method, we use two HEp-2 cells datasets: the ICPR 2012HEp-2 cell classification contestdataset (ICPR 2012 dataset) and International Conference on Image Process-ing (ICIP) 2013Competition on cells classification by fluo-rescent image analysistraining dataset (ICIP 2013 training
dataset). Some examples of the datasets are shown in Figure 4.
The ICPR 2012 dataset consists of 1,455 HEp-2 cells segmented from 28 slide images which are acquired by means of a fluorescence microscope (40-fold magnifica-tion) coupled with a 50-W mercury vapor lamp and a dig-ital camera utilizing a CCD with square pixel of 6.45μm. The images have a resolution of 1, 388×1, 038 pixels and color depth of 24 bits. Each image can be categorized into one of six staining patterns, namely centromere (ce), coarse speckled (cs), cytoplasmic (cy), fine speckled (fs), homogeneous (ho), and nucleolar (nu). Also, fluorescent intensity, i.e., positive or intermediate, is assigned to each image. The cells in the images are manually segmented and annotated by specialists. According to the experimen-tal protocol of the ICPR 2012 contest, the ICPR 2012 dataset is divided into a training set with 721 cells from half of the slide images and a test set with 734 cells from rest of the slide images. The composition of the dataset is reported in Table 1.
The HEp-2 cell images of ICIP 2013 dataset is obtained by using a monochrome high dynamic range cooled microscopy camera which is fitted on a microscope with a plan-apochromat 20×/0.8 objective lens and an LED illu-mination source. So far, only the training dataset is avail-able. The ICIP 2013 training dataset contains 13,596 cells which are categorized into six classes: homogeneous (ho), speckled (sp), nucleolar (nu), centromere (ce), nuclear membrane (nm), and golgi (go). The dataset includes two patterns less frequent occurring in the practical clinic, which are nuclear membrane pattern and golgi pattern. Thus, it offers a more realistic evaluation on the auto-matic classification algorithms. We partition the ICIP 2013 training dataset into a training set consisting of 6,842 cells from 42 slide images and a test set consisting of 6,754 cells from 41 slide images. See Table 2 for detailed information about the dataset.
Table 1 Composition of the ICPR 2012 dataset
Type Training set Test set Total
Centromere 208 149 357
Homogeneous 150 180 330
Nucleolar 102 139 241
Coarse Speckled 109 101 210
Fine Speckled 94 114 208
Cytoplasmic 58 51 109
Total 721 734 1,455
Each table item represents the number of cells.
Experimental settings
We firstly extract dense SIFT features as the local feature. SIFT features are invariant to scaling and rotation and par-tially invariant to illumination change, viewpoint change, and noise. These properties are advantageous in HEp-2 cells classification as cell images are unaligned and have high within-class variabilities. In our experiments, SIFT features are extracted at single scale from densely located patches of gray-level images. The patches are centered at every 6 pixels and with a fixed size of 18×18 pixels.
To obtain local distance vectors, the number of anchor points{mci}for each class manifoldMcare fixed to 1,024, then the size of the merged M for our proposed local distance vectors transformation is 6, 144× 128. For the original SIFT features and the corresponding local dis-tance vectors, all the codebooks in coding process contain 1,024 visual words learned from training samples by using k-means clustering method. One of the most important parameters for our proposed LLDC method iskLDV that defines the neighborhood of a local feature in local dis-tance vector transformation. In the following coding pro-cess, the number of neighbors in the LLC method (i.e., kLLC) is another parameter which can influence the clas-sification performance. We also utilize the LSC method to encode the local distance vector, therefore the impact of neighbor size (i.e., kLSC) will be discussed while the smoothing factorβis fixed as 10. We study the influence
Table 2 Composition of the ICIP 2013 training dataset
Type Training set Test set Total
Centromere 1,279 1,462 2,741
Homogeneous 1,347 1,147 2,494
Nucleolar 1,273 1,325 2,598
Speckled 1,391 1,440 2,831
Nuclear Membrane 1,190 1,018 2,208
Golgi 362 362 724
Total 6,842 6,754 13,596
Each table item represents the number of cells.
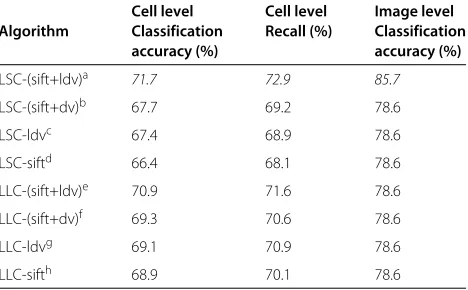
Table 3 Classification performance on the ICPR 2012 dataset
Cell level Cell level Image level
Algorithm Classification Recall (%) Classification
accuracy (%) accuracy (%)
LSC-(sift+ldv)a 71.7 72.9 85.7
LSC-(sift+dv)b 67.7 69.2 78.6
LSC-ldvc 67.4 68.9 78.6
LSC-siftd 66.4 68.1 78.6
LLC-(sift+ldv)e 70.9 71.6 78.6
LLC-(sift+dv)f 69.3 70.6 78.6
LLC-ldvg 69.1 70.9 78.6
LLC-sifth 68.9 70.1 78.6
The italicized items represent the best performance.
aThe LLDC method based on the concatenated representations from LSC-sift and LSC-ldv.
bThe LDC method based on the concatenated representations from LSC-sift and LSC-dv.
cThe LSC method based on local distance vector. dThe LSC method based on SIFT features.
eThe LLDC method based on the concatenated representations from LLC-sift and LLC-ldv.
fThe LDC method based on the concatenated representations from LLC-sift and LLC-dv.
gThe LLC method based on local distance vector. hThe LLC method based on SIFT features.
of these parameters for HEp-2 cells classification in the ‘Discussion’ section.
After coding process, SPM is used through partition-ing each image into three increaspartition-ingly finer subregions, i.e., 1×1, 2×2, and 4×4. We apply max-pooling strat-egy to pool the codes for each spatial subregion. The obtained features within all the subregions are concate-nated, then the final image representation is fed into a lin-ear SVM classifier in the training and testing phases using the LIBLINEAR package [34], thanks to its efficiency in implementation. The linear SVM is trained based on the training set by tenfold cross-validation strategy and tested using the test set.
The experimental results are reported at the cell level and the image level, respectively. At the cell level, let
Table 4 The cell-level classification confusion matrix of LSC-(sift+ldv) using the ICPR 2012 dataset
ce (%) cs (%) cy (%) fs (%) ho (%) nu (%)
ce 84.2 3.4 0.6 0.0 1.3 10.5
cs 6.9 72.3 3.8 12.1 4.9 0.0
cy 0.0 0.0 100.0 0.0 0.0 0.0
fs 22.8 1.7 2.6 39.1 32.9 0.9
ho 6.7 4.5 0.0 11.1 76.0 1.7
nu 20.1 0.0 5.6 0.7 7.9 65.7
Table 5 The image-level classification confusion matrix of LSC-(sift+ldv) method using the ICPR 2012 dataset
ce (%) cs (%) cy (%) fs (%) ho (%) nu (%)
ce 100.0 0.0 0.0 0.0 0.0 0.0
cs 0.0 66.7 0.0 33.3 0.0 0.0
cy 0.0 0.0 100.0 0.0 0.0 0.0
fs 0.0 0.0 0.0 50.0 50.0 0.0
ho 0.0 0.0 0.0 0.0 100.0 0.0 nu 0.0 0.0 0.0 0.0 0.0 100.0
Each italicized item represents the classification accuracy for each staining pattern.
tpi,tni,fpi andfni respectively denote the true positives, true negatives, false positives, and false negativesfor an individual staining pattern classci. In our experiments, we use the performance measuresaccuracyandrecallat the cell level which are formulated as:
accuracy = tpi
tpi+tni+fpi+fni, (10)
recall =
tpi tpi+fni
C , (11)
whereCis the number of cell classes.
At the image level, the prediction for staining pattern of each image is decided by the most frequently assigned pattern of the cells within that image. In our experi-ments, we use the number of correctly classified images divided by the number of all the images as the image-level classification accuracy.
Experimental results on the ICPR 2012 dataset
We first test performance of the proposed LLDC method on the ICPR 2012 dataset following the experimental pro-tocol of theHEp-2 cells classification contest by dividing the cell images into a training set and a test set. The subdi-vision is performed while maintaining approximately the
Table 6 Classification performance on the ICIP 2013 training dataset
Cell level Cell level Image level
Algorithm Classification Recall (%) Classification
accuracy (%) accuracy (%)
LSC-(sift+ldv) 77.6 74.5 90.2
LSC-(sift+dv) 74.7 72.5 87.8
LSC-ldv 74.6 72.8 87.8
LSC-sift 73.2 71.9 87.8
LLC-(sift+ldv) 79.1 76.2 90.2
LLC-(sift+dv) 75.9 74.1 87.8
LSC-ldv 76.1 74.2 87.8
LLC-sift 75.8 73.3 87.8
The italicized items represent the best performance.
Table 7 The cell-level classification confusion matrix of LLC-(sift+ldv) using the ICIP 2013 training dataset
ho (%) sp (%) nu (%) ce (%) nm (%) go (%)
ho 84.6 11.4 2.2 0.0 1.6 0.2
sp 8.8 73.9 7.8 8.4 0.8 0.3
nu 1.4 5.1 80.5 6.6 3.2 3.2
ce 1.7 15.9 2.4 79.9 0.1 0.0
nm 3.7 4.5 0.6 0.5 87.0 3.7
go 7.7 1.4 35.6 0.3 3.9 51.1
Each italicized item represents the classification accuracy for each staining pattern.
same image pattern distribution over the two sets [11]. To assess the performance of our method, we compare four different image representations: the original SIFT-based BoW image representation (LLC/LSC-sift), the distance-vector-based image representation (LLC/LSC-(sift+dv)), our proposed image representation using local distance vector (LLC/LSC-ldv) and the proposed concatenated image representation (LLC/LSC-(sift+ldv)). Table 3 gives the comparison results of the cell-level and image-level classification performances. It can be observed that the proposed LLDC method outperforms all the other meth-ods. It is worth noting that the LLDC method outper-forms CoALBP [28] which is the winner of the contest with 70.4% of the cell-level classification accuracy and 68.4% of recall. Furthermore, the performance obtained by LLC/LSC-(sift+ldv) is better than that obtained by LLC/LSC-sift and LLC/LSC-ldv. In particular, the classi-fication performance achieved by LSC-(sift+ldv) is better than that achieved by LLC-(sift+ldv).
Table 4 shows the confusion matrix at the cell level by the proposed LLDC method using the LSC strategy on the concatenated image representation. The entry in the confusion matrix corresponds to row i, and column j rep-resents the percentage of cells from classiassigned to class j. It is obvious that cytoplasmic, centromere, and homoge-neous patterns are classified more accurately than the oth-ers. More particularly, cytoplasmic can achieve 100% of
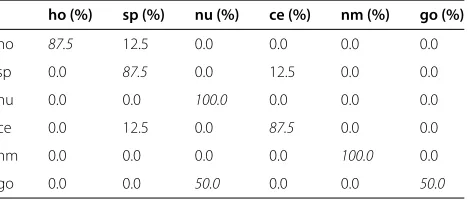
Table 8 The image-level classification confusion matrix of LLC-(sift+ldv) using the ICIP 2013 training dataset
ho (%) sp (%) nu (%) ce (%) nm (%) go (%)
ho 87.5 12.5 0.0 0.0 0.0 0.0
sp 0.0 87.5 0.0 12.5 0.0 0.0
nu 0.0 0.0 100.0 0.0 0.0 0.0
ce 0.0 12.5 0.0 87.5 0.0 0.0
nm 0.0 0.0 0.0 0.0 100.0 0.0
go 0.0 0.0 50.0 0.0 0.0 50.0
Figure 5Classification accuracy of the LLDC method under variouskLDVon ICPR 2012 dataset.
classification accuracy. Compared to the cytoplasmic pat-tern with distinguishable shape and centromere patpat-tern with clear fluorescent dots, speckled pattern and homo-geneous pattern have similar characteristics and have hard-to-find discriminative features that hard to separate. To evaluate the classification performance at the image level, we report the corresponding confusion matrix in Table 5. Similarly, the table represents the percentage
of images of class i identified to class jwith respect to the total number of images in the test set. Our pro-posed LLDC method obtains 85.7% of the image-level classification accuracy, which indicates that 12 images are correctly classified while there are 14 images in the test set. Centromere, cytoplasmic, homogeneous, and nucleo-lar patterns achieve 100% of classification accuracy. The most frequent mistake is existed between fine speckled
Figure 7Classification accuracy of the LLDC method using LLC strategy under variouskLLC.
and homogeneous pattern, which is a common mistake at the cell level.
Experimental results on the ICIP 2013 training dataset
Based on the ICIP 2013 training dataset, the classification performance of different algorithms at the cell level and the image level is shown in Table 6. Our proposed LLDC
method achieves the best performance. Particularly, LLC-(sift+ldv) can achieve better classification performance than LSC-(sift+ldv). Table 7 shows the confusion matrix at the cell level by the proposed LLDC method using the LLC strategy on the concatenated image representation. Nuclear membrane pattern gets the highest classification accuracy rate, followed by homogeneous pattern as they
Table 9 Running time(s) for each method
LSC-(sift+ldv) LSC-ldv LSC-sift LLC-(sift+ldv) LLC-ldv LLC-sift
ICPR 2012 453.7 346.1 192.0 440.6 330.8 190.4
ICIP 2013 2,605.7 2,089.9 1,244.4 2,587.6 2,063.1 1,199.9
have distinguished characteristic compared with other patterns. Golgi pattern is often mistaken for nucleolar pattern, because some golgi pattern have large speckles within the nucleoli while some only have several cluster of irregular granules, which is just similar to nucleolar pat-tern. Table 8 illustrates the confusion matrix at the image level. The proposed LLDC method obtains the classifica-tion accuracy of 90.2% at the image level, which means that 37 images are correctly identified while there are 41 images in the test set. Nucleolar and nuclear membrane patterns particularly obtain 100% of image-level accuracy. It is evident that golgi pattern is wrongly classified as nucleolar, which is very common at the cell level.
Discussion
To provide a more comprehensive analysis of the pro-posed LLDC method, we further evaluate its performance with respect to the number of nearest neighbors for cal-culating local distance vector and the coding process, respectively. It should be noted that the classification performance evaluated in this section is classification accuracy at the cell level.
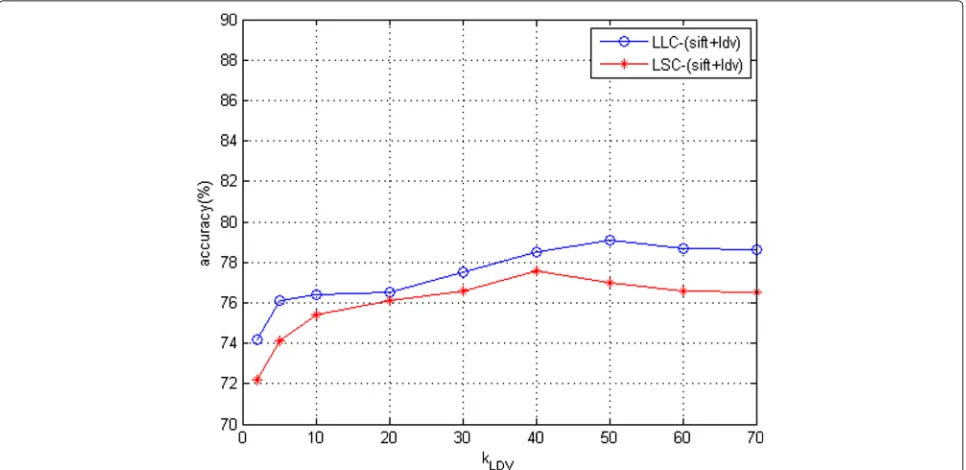
Neighbor number kLDV on calculating local distance vector: In our proposed method, we firstly introduce a merged manifoldMfor all the classes. Secondly, we trans-form the original local features to local distance vectors by searching the nearestkLDVneighbors around the local feature without regard to classes isolated from the local feature. Figures 5 and 6 show classification the accuracy under various values ofkLDV for ICPR 2012 dataset and ICIP 2013 training dataset, respectively. Obviously, the proposed LLDC method achieves the best classification
performance when kLDV = 35 while using LSC coding
scheme for ICPR 2012 dataset. For ICIP 2013 training dataset, kLDV = 50 is the best choice while using LLC coding scheme.
Neighbor number kLLC on LLC method: We
investi-gate the effect on classification performance under vari-ous neighbor number,kLLC, in approximated LLC coding scheme. Figure 7 shows the performance using kLLC ∈ {2, 5, 10, 20, 30,. . ., 70}. As can be seen, the best classifica-tion accuracy is achieved whenkLLC = 5 andkLLC = 60 for ICPR 2012 dataset and ICIP 2013 training dataset, respectively.
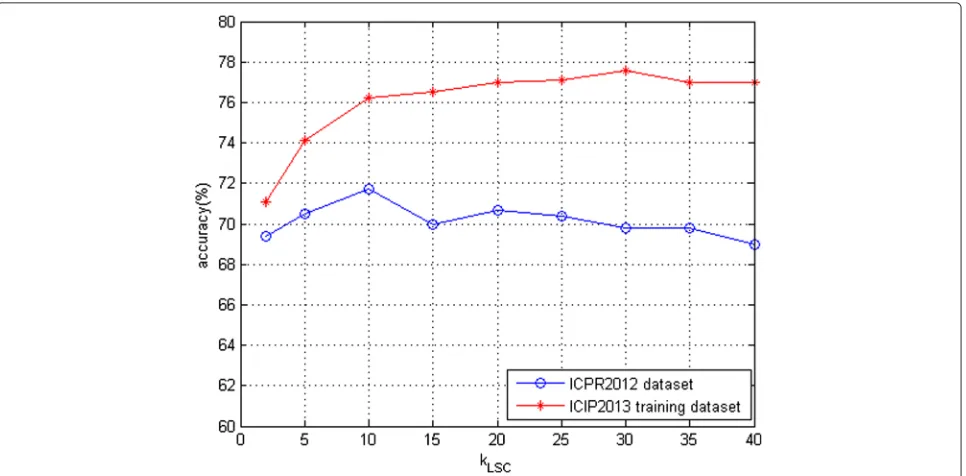
Neighbor number kLSC on LSC method: With respect
to LSC coding strategy, only kLSC nearest neighbors of a local feature are considered in coding procedure. We
discuss the impact of differentkLSCfor staining patterns classification performance. Figure 8 shows the classifi-cation accuracy under kLSC ∈ {2, 5, 10, 15, 20,. . ., 40}. Obviously,kLSC = 10 is the best choice for ICPR 2012 dataset whilekLSC=30 is the best for ICIP 2013 training dataset.
At last, we evaluate the running time for each method as show in Table 9. Our proposed framework combines two kinds of image representations, therefore it needs more computational time.
Conclusions
In this study, we have presented a promising framework, LLDC, for automatic staining pattern classification of HEp-2 cells to support the diagnosis of specific autoim-mune diseases. The LLDC framework can extract more discriminative information and consequently gives better HEp-2 cells classification performance than many exist-ing codexist-ing methods. The LLDC method is based on local distance vector which captures discriminative infor-mation via image-to-class distance. Furthermore, local distance vector improves the classification performance by making adjustments only to the classes found in the local kLDV nearest neighbors around the local features. It can avoid disturbance from isolated classes. Addition-ally, the distance patterns and the original local features are proven to be complementary to each other. There-fore, the concatenation of two image representations can achieve higher classification accuracy. Experimen-tal results on the ICPR 2012 dataset and the ICIP 2013 training dataset validate that the proposed LLDC frame-work can provide superior performance for HEp-2 cells classification, compared with the some improved coding methods.
Compared with traditional coding methods, the LLDC framework is time consuming as it needs to transform original local features to local distance vectors one-by-one and it is an integration of two kinds of image represen-tations. In the future, we plan to design a new model to reduce the algorithm’s complexity [35] while improving the accuracy.
Competing interests
The authors declare that they have no competing interests.
Acknowledgements
Author details
1School of Computer Engineering, Nanyang Technological University, 50
Nanyang Ave., 639798, Singapore, Singapore.2Department of Rheumatology, Allergy and Immunology, Tan Tock Seng Hospital, 11 Jalan Tan Tock Seng, 308433, Singapore, Singapore.
Received: 20 December 2014 Accepted: 30 March 2015
References
1. PL Meroni, PH Schur, ANA screening: an old test with new recommendations. Ann. Rheum. Dis.69(8), 1420–1422 (2010) 2. R Hiemann, T Büttner, T Krieger, D Roggenbuck, U Sack, K Conrad,
Challenges of automated screening and differentiation of non-organ specific autoantibodies on HEp-2 cells. J. Autoimmun. Rev.9(1), 17–22 (2009)
3. P Soda, G Iannello, inIEEE Int. Symp. on Computer-Based Med. Syst. A multi-expert system to classify fluorescent intensity in antinuclear autoantibodies testing (Maribor, Slovenia, 2006), pp. 219–224 4. R Hiemann, N Hilger, U Sack, M Weigert, Objective quality evaluation of
fluorescence images to optimize automatic image acquisition. J. Cytom. Part A.69(3), 182–184 (2006)
5. LS Cheong, F Lin, HS Seah, K Qian, F Zhao, PS Thong, KC Soo, M Olivo, S-Y Kung, Embedded computing for fluorescence confocal endomicroscopy imaging. J. Signal Process. Syst.55(1–3), 217–228 (2009)
6. G Percannella, P Soda, M Vento, inIEEE Int. Symp. on Computer-Based Med. Syst. A classification-based approach to segment HEp-2 cells (Roma, Italy, 2012), pp. 1–5
7. P Foggia, G Percannella, P Soda, M Vento, inIEEE Int. Symp. on Computer-Based Med. Syst. Early experiences in mitotic cells recognition on HEp-2 slides (Perth, Australia, 2010), pp. 38–43
8. P Soda, G Iannello, M Vento, A multiple expert system for classifying fluorescent intensity in antinuclear autoantibodies analysis. Pattern Anal. Appl.12(3), 215–226 (2009)
9. R Hiemann, N Hilger, J Michel, J Nitschke, A Boehm, U Anderer, M Weigert, U Sack, Automatic analysis of immunofluorescence patterns of HEp-2 cells. Ann. N. Y. Acad. Sci.1109(1), 358–371 (2007)
10. J Yu, F Lin, H-S Seah, C Li, Z Lin, Image classification by multimodal subspace learning. Pattern Recognit. Lett.33(9), 1196–1204 (2012) 11. P Foggia, G Percannella, P Soda, M Vento, Benchmarking HEp-2 cells
classification methods. IEEE Trans. Med. Imaging.32(10), 1878–1889 (2013)
12. J Yang, K Yu, Y Gong, T Huang, inProc. CVPR. Linear spatial pyramid matching using sparse coding for image classification (Miami, Florida, USA, 2009), pp. 1794–1801
13. J Wang, J Yang, K Yu, F Lv, T Huang, Y Gong, inProc. CVPR. Locality-constrained linear coding for image classification (Perth, Australia, 2010), pp. 3360–3367
14. A Wiliem, C Sanderson, Y Wong, P Hobson, RF Minchin, BC Lovell, Automatic classification of human epithelial type 2 cell indirect immunofluorescence images using cell pyramid matching. Pattern Recogn.47(7), 2315–2324 (2014)
15. L Shen, J Lin, S Wu, S Yu, HEp-2 image classification using intensity order pooling based features and bag of words. Pattern Recogn.47(7), 2419–2427 (2014)
16. S Lazebnik, C Schmid, J Ponce, inProc. CVPR. Beyond bags of features: spatial pyramid matching for recognizing natural scene categories, vol. 2 (Salt Lake City, Utah, USA, 2006), pp. 2169–2178
17. JC van Gemert, J-M Geusebroek, CJ Veenman, AW Smeulders, inProc. ECCV. Kernel codebooks for scene categorization (Marseille, France, 2008), pp. 696–709
18. JC van Gemert, CJ Veenman, AW Smeulders, JM Geusebroek, Visual word ambiguity. IEEE Trans. Pattern Anal. Mach. Intell.32(7), 1271–1283 (2010) 19. L Liu, L Wang, X Liu, inProc. ICCV. In defense of soft-assignment coding
(Barcelona, Spain, 2011), pp. 2486–2493
20. K Yu, T Zhang, Y Gong, inProc. NIPS. Nonlinear learning using local coordinate coding (Vancouver, British Columbia, Canada, 2009), pp. 2223–2231
21. O Boiman, E Shechtman, M Irani, inProc. CVPR. In defense of nearest-neighbor based image classification (Anchorage, Alaska, USA, 2008), pp. 1–8
22. Z Wang, J Feng, S Yan, H Xi, Linear distance coding for image classification. IEEE Trans. Image Process.22, 537–548 (2013) 23. P Perner, H Perner, B Müller, Mining knowledge for HEp-2 cell image
classification. J. Artif. Intell. Med.26(1), 161–173 (2002) 24. P Soda, G Iannello, Aggregation of classifiers for staining pattern
recognition in antinuclear autoantibodies analysis. IEEE Trans. Inf. Technol. Biomed.13(3), 322–329 (2009)
25. E Cordelli, P Soda, inIEEE Int. Symp. on Computer-Based Med. Syst. Color to grayscale staining pattern representation in IIF (Bristol, United Kingdom, 2011), pp. 1–6
26. X Xu, F Lin, C Ng, KP Leong, Staining pattern classification of ANA-IIF based on sift features. J. Med. Imaging Health Inform.2(4), 419–424 (2012) 27. A Wiliem, Y Wong, C Sanderson, P Hobson, S Chen, BC Lovell, inIEEE
Workshop on Applications of Computer Vision (WACV). Classification of human epithelial type 2 cell indirect immunofluoresence images via codebook based descriptors (Clearwater Beach, FL, USA, 2013), pp. 95–102 28. R Nosaka, Y Ohkawa, K Fukui, inPac. Rim Symp. Advances in Image and
Video Technol. Feature extraction based on co-occurrence of adjacent local binary patterns, (2012), pp. 82–91
29. K Li, J Yin, Z Lu, X Kong, R Zhang, W Liu, inPattern Recognition (ICPR), 2012 21st International Conference On. Multiclass boosting SVM using different texture features in HEp-2 cell staining pattern classification (Tsukuba Science City, Japan, 2012), pp. 170–173
30. S Ghosh, V Chaudhary, inProc. ICPR. Feature analysis for automatic classification of HEp-2 florescence patterns: computer-aided diagnosis of auto-immune diseases (Tsukuba Science City, Japan, 2012), pp. 174–177 31. S Di Cataldo, A Bottino, I Ul Islam, T Figueiredo Vieira, E Ficarra, Subclass
discriminant analysis of morphological and textural features for HEp-2 staining pattern classification. Pattern Recogn.47(7), 2389–2399 (2014) 32. L Liu, L Wang, HEp-2 cell image classification with multiple linear
descriptors. Pattern Recognit.47(7), 2400–2408 (2014)
33. K Yu, T Zhang, inProc. ICML. Improved local coordinate coding using local tangents (Haifa, Israel, 2010), pp. 1215–1222
34. R-E Fan, K-W Chang, C-J Hsieh, X-R Wang, C-J Lin, Liblinear: a library for large linear classification. J. Mach. Learn. Res.9, 1871–1874 (2008) 35. F Zhao, F Lin, HS Seah, Binary sipper plankton image classification using
random subspace. Neurocomputing.73(10), 1853–1860 (2010)
Submit your manuscript to a
journal and benefi t from:
7Convenient online submission 7Rigorous peer review
7Immediate publication on acceptance 7Open access: articles freely available online 7High visibility within the fi eld
7Retaining the copyright to your article