International Journal of Engineering & Technology IJET-IJENS Vol:15 No:05 33
The Dynamic Effect of PVB Interlayer Thickness on
Laminated Glass Window
Kook Chan Ahn
Department of Automotive Engineering, Gyeongnam National University of Science and Technology, Jinju 660-758, KOREA Telp. +82-55-751-3641 Fax.: +82 -55-751-3649
e-mail: [email protected]
Abstract-- Small mass impact on laminated glass windows caused by hailstones and windborne debris can create internal damage that reduces the strength of the structure significantly. The effect of PVB interlayer on automotive and architectural glass window like the monolithic and laminated glass is studied by the use of the coded finite element program. To model and predict the impact response of both the monolithic and laminated glasses, an approach based on the Sun's higher-order beam finite element and Dharani's PVB interlayer model is proposed. The verification of the numerical model is conducted by using an energy balance model and wave propagation method for impacts on the monolithic and laminated glass beams. The present finite element results show a good agreement with those of wave propagation method in view of maximum contact force and the history of wavefront but the maximum contact force of an energy balance model tends to overestimate. The impact responses such as the time histories of contact force and wavefront regarding change of PVB interlayer thickness are compared with each other between the monolithic and laminated glasses with the same total glass thickness. Consequently, it may be concluded that the existence of the PVB interlayer between the monolithic and laminated glass has significant effect on impact responses such as the histories of contact force, impact energies and wavefront etc. but the variation of the PVB interlayer thickness in laminated glass does not affect so much.
Index Term-- laminated glass, dynamic effect, PVB interlayer, finite element, wave propagation
1. INTRODUCTION
Laminated glass (LG) is widely used as windows in architectural applications and windshields in automotive industry. LG consists of two or more layers of glass plies adhered by a interlayer made of polyvinyl butyral (PVB). Two soda-lime glass plies are separated by an adhesive polymer that prevents the glass plies from shattering on impact thereby greatly reducing the possibility of injury caused by sharp pieces of flying glass. However, unlike the monolithic glass (MG) that fails in a brittle manner, LG can reduce the number of dangerous flying fragments as many fragments will be adhered by the PVB layer. Hence, the risk of injuries of people can be significantly reduced. The main purposes of the PVB interlayer are to provide absorption to the impact energy and adhesion to the two glass plies. At the same time, the PVB interlayer can act as a barrier avoiding penetration. Another advantage of LG is that it is possible to reduce the weight of the glass of the same total thickness. Despite of their
advantages, however, the efficient application of LG is limited because of the difficulties in their strength calculations at the stage of their design.
Foreign object like a small stone thrown into the windows shall give an impact to architectural and automotive glass. For optimal design of LG that minimizes body injury and property damage during a vehicle accident is required a thorough understanding of the impact behaviors of automotive glass subjected to dynamic impact. Impacts are often classified as low velocity and high velocity impacts. However, a more relevant classification was proposed by Olsson[1] as boundary-controlled and wave-boundary-controlled impact. The impact response type is governed by the impactor-plate mass ratio and not by impact velocity[2]. If the impactor mass divided by the effective mass of plate is lower than 1/5 (dynamic wave-controlled impact), the plate deformation is localised to the vicinity of the impact point and, the contact force and plate deformation are never in phase as shown in Figure 1(a). If the impactor-total plate mass ratio is larger than 2 (quasi-static boundary-controlled impact), the entire plate is deformed during the impact, and the contact force and plate deformation are slightly out of phase as shown in Figure 1(b)[5].
(a) (b)
Fig. 1. Comparison between (a) wave-controlled and (b) boundary-controlled impact (Olsson[3, 4]).
International Journal of Engineering & Technology IJET-IJENS Vol:15 No:05 34 experimental works by Sun and his co-workers[6-8]. Sun and
Huang[6] developed a higher-order beam finite element with six degrees of freedom for the dynamic response of elastic isotropic beams subjected to impulsive loadings. This higher order beam finite element showed to be more efficient than the conventional element with four degrees of freedom. Comprehensive literature reviews on the effect of impact on composite materials were presented by Abrate[9-11]. Olsson[1] presented wave propagation method which is an approximate solution for impacts on infinite composites. A series of papers on impact of LG for automotive and architectural applications has been published by Dharani and his coworkers[12-19]. In several earlier studies on laminated architectural glazing, the PVB interlayer has been traditionally modeled as linear-viscoelastic[12, 13]. The most recent his works[15-18] on LG have shown that PVB can be modeled as linear elastic. Jalham[20] presented the effect of thickness of the bonding interlayer on the mechanical behavior of laminated glass.
In this study, a new finite element approach in conjunction with Sun's higher-order finite element theory, Dharani's PVB interlayer model and the Hertzian contact law is used to predict the overall impact responses on the MG and LG. The glass plies and PVB interlayer are modeled as linear elastic. The effectiveness of the developed finite element program for this study is verified in comparison with an energy balance model and wave propagation method in response of the MG and LG due to small mass impact and then the effect of PVB interlayer thickness on automotive glass window response is investigated. That is, the dynamic results such as the histories of contact force and deflection during impact are obtained to study the effect of PVB interlayer thickness for the MG and LG. From these results, the impact behaviors of LG are compared with those of the MG of the same total glass thickness. And, also, the effect of the thickness of PVB interlayer on impact response of LG is studied.
2.THEORETICAL BACKGROUND
2.1 Finite element model
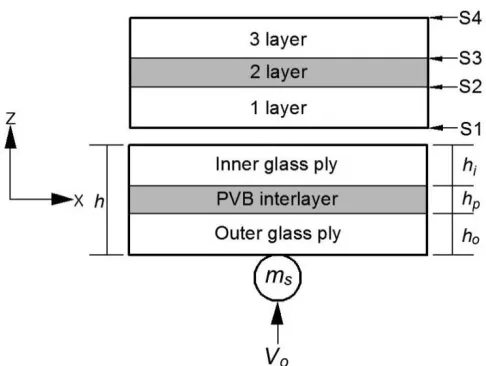
Consider a LG beam consisting of multiple layers of total thickness h subjected to transverse impact by a steel ball of radius R with initial impact velocity V0, as shown in Figure 2. The thickness of the outer and inner plies and the PVB interlayer in LG beam are h0, hi and hp, respectively. The origin of the coordinate system is located at the midplane with the z axis normal to the midplane.
Fig. 2. Schematic diagram of small mass impact on a laminated glass.
To analyze impact response of LG beam between target and impactor, the element displacement function by Sun and Huang[6] is taken as
5 6 4 5 3 4 2 3 2
1 a x a x a x a x a x a
v (1)
where v is the transverse displacement and ai are constant coefficients. The three degrees of freedom at each node are the transverse displacement v, the rotation , and the curvature k. The coefficients ai in Equation (1) can be replaced by the six generalized nodal displacements at the two end nodes and, as a result, the displacement function can be alternatively expressed in terms of the nodal displacements. The laminated glass is often treated as an equivalent MG by using equivalent geometry and material properties[21]. Wei et al.[16] proposed equivalent properties for the whole LG panel. These relationships (the rule of mixtures) are given as
) /(
)
( g o p p g i o p i
e E h E h E h h h h
E
(2) )
/( )
( g o p p g i o p i
e v h v h v h h h h
v )
/( )
( g o p p g i o p i
e h h h h h h
where Ee, Ge, ve and e are equivalent Young's modulus, equivalent shear modulus, equivalent Poisson's ratio and equivalent density of the whole LG panel. The equivalent material properties of LG are used to calculate the contact stiffness from
n
ka
F (3)
where the contact stiffness k is given as ) /(
)
( g o p p g i o p i
e G h G h G h h h h
International Journal of Engineering & Technology IJET-IJENS Vol:15 No:05 35 e e s s s E v E v R k 2 2 1 1 3 4
(4)
Glass is widely used in many engineering applications (vehicles, aircraft, buildings and electronic etc.). The simple applications of this material have the shape of a glass beam panels. In case of impact of a hard projectile, impact responses are expected to occur in the impact zone where direct contact of the projectile and the glass takes place. Thus, it is very important to estimate accurately the contact force and its history. The relaxation modulus G(t) for a linear viscoelastic material is generally given in the form
t e G G G t
G() ( 0 ) (5)
where G∞ is the long time shear modulus, G0 is the short time shear modulus and β is the decay factor.
Since the impact duration is in the range of milliseconds, the stress relaxation modulus G(t) of PVB changes very little during impact. In this short time, PVB behaves like a solid glassy material. The linear elastic treatment of the PVB not only facilitates a closed-form solution but also results in a significant reduction in computational time. In the time durations for low velocity impact problems, the difference in stresses obtained by treating the PVB as linear viscoelastic and linear elastic is less than 2%[16]. The most recent works [15-18] have shown that PVB can be modeled as linear elastic by using the short term shear modulus for a transient response. The Young's modulus Ep and the Poisson's ratio νp for the PVB are given in terms of short term shear modulus G = G0 andbulk modulus K as
) 3 /( 9KG0 K G0
Ep (6) ) 2 6 /( ) 2 3
( K G0 K G0
p
In this study, therefore, the PVB will be modeled as a linear elastic material. The governing equation of this structures dynamic behavior is given by the Hamilton's principle in the following form } { } ]{ [ } .. ]{
[M u k u F
(7)
where [M] and [K]are the mass and stiffness matrix of the beams, respectively.
{
u
}
and {u..} are the displacement and acceleration vector, respectively. {F} is the equivalent of external load, which includes the impact force.In order to get numerical solution on the impact responses of the MG and LG beams, we adopt another equations of the Hertzian contact law applied the rule of mixtures[9], Newton's second law for the dynamic equation of the impactor and Newmark's integration scheme for solving the dynamic equations of the target and the impactor for each time step
including Equation (4). Similar simulating process were described in detail in Ref. [22-24].
2.2 MATHEMATICAL MODELS 2.2.1 Energy balance model
An energy balance model is often used to analyze impact dynamics for composite structures. When the overall deflection of the structure are negligible compared to the local indentation, the problem is reduced to that of an impact on a half-space, and the maximum contact force and the contact duration are given by Abrate[11]
3 6 2
15 5 3 4 5 K V M F (8) 5 1 2 2 2145 . 3 VK
M
T
(9)2.2.2 Wave propagation model for infinite structures
Through a single nonlinear ordinary differential equation[1, 11], the maximum contact force is given by
2 / 3 5 / 1 6 3 2 ]
[k M V
F
(10)
After contact ceases, the deflection at the point of impact remains constant while the deformation propagates outward. The wavefront a (distance between the wavefront and the impact point, or length of wave-affected area) in the x-direction, can be estimated using
A
t mD
a 18
4 1
11 2 1
2
(11)
Constant A in Equation (5 ) is defined as 4
1 22 11 66
12 2 )/( )
(D D D D
A
(12)
where Dij are called the bending stiffness which can be calculated from laminate theory.
In the y-direction, the wavefront b is approximately located at a distance
4 / 1 22 11/ )
/(D D
a
b
International Journal of Engineering & Technology IJET-IJENS Vol:15 No:05 36 Equations (11-13) provide an estimate of the size of the
deformed zone during impact[11].
3. NUMERICAL INVESTIGATION
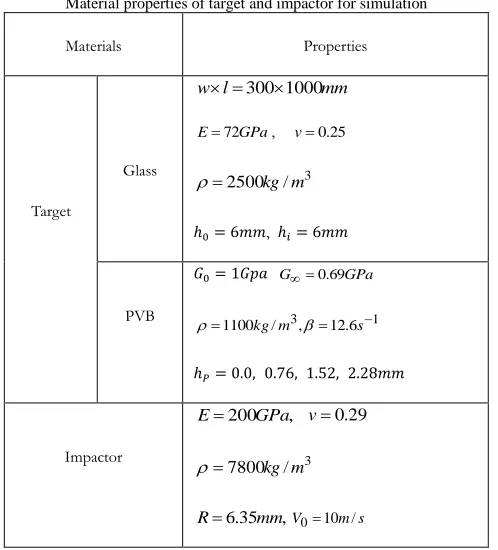
A higher-order beam finite element is conducted for the study of the impact response of the MG and LG beams with the same total glass thickness due to small mass impact. It is applied to the contact law that both loading and unloading process are treated as elastic because the glass is a brittle material. The thicknesses of the MG and LG beams considered in this study are 12, 12.76, 13.52 and 14.28mm, respectively. In other words, the thicknesses of PVB interlayer of LG beams are 0.76(2 interlayers), 1.52(4 interlayers) and 2.28(6 interlayers)mm. The models are assumed to be impacted at the center by an impactor with radius 6.35mm and are simply supported on both side edges. The material properties of target and impactor for simulation are shown in Table I.
Table I
Material properties of target and impactor for simulation
Materials Properties
Target
Glass
mm l
w 3001000
GPa
E72 , v0.25
3
/ 2500kg m
ℎ0= 6𝑚𝑚, ℎ𝑖= 6𝑚𝑚
PVB
𝐺0= 1𝐺𝑝𝑎 G0.69GPa
1 3, 12.6
/
1100
kg m s
ℎ𝑃= 0.0,_0.76,_1.52,_2.28𝑚𝑚
Impactor
, 200GPa
E v0.29
3
/ 7800kg m
, 35 .
6 mm
R V010m/s
4. RESULTS AND DISCUSSION
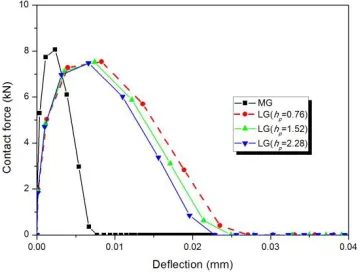
In order to verify the coded finite element program for this study, the present finite element analysis is compared with an energy balance model that the maximum contact force and the contact duration can be estimated, and wave propagation method that the maximum contact force can be predicted simply. Figure 3 shows the histories of contact force and deflection for various PVB interlayer thicknesses obtained from the present finite element analysis at velocity 10m/s. From Figure 3, the maximum contact forces for both the MG and LG occur at around 20μs after the initial impact. We can
see that the maximum contact force in the MG is a little (7-8%) larger than those of LG, but PVB thickness in LG has no significant effect on contact force for small mass impact. And also we can see that the deflections of beam in LG are larger than that of the MG, and the higher the thickness of PVB interlayer in LG, the higher the magnitude of deflection becomes.
Next, for verification of this coded program, the present numerical results are compared with those of energy balance model and the wave propagation model as shown in Table 2. Table 2 shows that maximum contact forces between present study and wave propagation model are agreed well to each other, however, energy balance model tends to overestimate maximum contact force after the onset of impact. Abrate[11] showed that this trend in energy balance model occurs since it does not account for wave propagation. And also results of contact duration between present study and energy balance model are agreed well to each other. Therefore, it is shown that this approach can be applied to automotive glass window response problem due to small mass impact.
Fig. 3. Contact force and deflection histories for various PVB interlayer thicknesses.
Table II
Comparison of max. contact force and contact duration between the present study, energy balance model and wave propagation model PVB
interlayer thickness (mm)
Max. contact force (N) Contact duration (μs) Present
study
Energy balance model
Wave propagation
model
Present study
Energy balance model MG 0.00 8070 8390 8070 37.0 36.0
LG
International Journal of Engineering & Technology IJET-IJENS Vol:15 No:05 37 Figure 4 shows the relationship of contact force and
deflection of the MG and LG beams with same total glass thickness subjected to impact loading. Figure 4 shows the identical results as the same as Figure 3 because of low flexure stiffness of PVB interlayer at given velocity. We can see that the maximum contact force does not occur at the maximum deflection. It shows a typical wave-controlled impact [Figure 1(a)] that the beam deflection is localized to the region around the impact point, and the contact force and deflection are never in phase.
Figure 5 depicts relationships of contact force and indentation according to variation of PVB interlayer thickness. The rigid impactor hitting the deformable target involves loading and unloading processes. The loading process is represented by curve O-A, whereas the unloading process is represented by curve A-O. The energy of the impactor is the product of contact force by displacement, thus, the area under these closed curves represents the loading and unloading energy phase, respectively. If energy loss is negligible, the area under the loading curve O-A represents the initial energy (Ei), which is the same as the kinetic energy at the start of impact. The area under the unloading curve A-O represents the rebound energy (Er) to the impactor. The absorbed energy (Ea) dissipated during the impact is Ei minus Er and is shown in the loop area of the contact force- displacement curve O-A-O. From Figure 5, it may be concluded that the existence of PVB interlayer between the MG and LG has significant effect but the thickness of PVB interlayer in LG does not affect so much on the absorbed energy of target by small mass impact.
Fig. 4. Comparison of contact force and beam deflection for various PVB interlayer thicknesses.
Fig. 5. Comparison of contact force and indentation for various PVB interlayer thicknesses.
Figure 6 shows relationship of contact stiffness and equivalent bending stiffness for various PVB interlayer thicknesses. It can be seen that the higher the thickness of PVB interlayer, the smaller the contact stiffness and the higher the equivalent bending stiffness due to low flexure stiffness of PVB interlayer. Figure 7 depicts relationship of beam deflection, ball displacement and indentation for various PVB interlayer thicknesses. It can be seen that from Figure 7 the thickness of PVB interlayer has significant effect on beam deflection but does not affect so much on ball displacement and indentation.
International Journal of Engineering & Technology IJET-IJENS Vol:15 No:05 38
Fig. 7. Relationship of beam deflection, ball displacement & indentation for various PVB interlayer thicknesses.
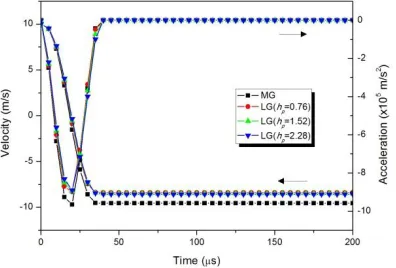
Velocity and kinetic energy histories for various PVB interlayer thicknesses are given in Figures 8 and 9. The velocity and energy at the time zero are the initial velocity and energy of impactor at which the impactor hits the target. Velocity curves of Figure 8 decrease and take negative values and remain constant by time. These negative values represent rebound velocity of the impactor. Minimum kinetic energy in Figure 9 occurs when velocity is zero. At Figure 9, the lowest tip of the curve shows minimum kinetic energy and the end of curve that remain constant shows the rebound energy. And, also, the energy difference between initial energy and rebound energy becomes absorbed energy by target.
From Figure 8, we can see that velocity histories for LG beams except the MG is independent of the thickness of PVB interlayer. It can be seen that from Figure 9 the existence of PVB interlayer between the MG and LG has significant effect on rebound energy but PVB thickness in LG does not affect so much. Figures 10 and 11 show relationships for summarizing the impact responses of Figures 8 and 9 through the numerical analyses at various PVB interlayer thicknesses.
From Figure 10, three closed loops of kinetic energy-displacement curve for LG except the MG have approximately same area. And also it can be seen that from Figure 11 PVB interlayer number is no significant effect on absorbed and rebound energies of LG except the MG.
Fig. 8. Velocity histories for various PVB interlayer Thicknesses.
Fig. 9. Kinetic energy histories for various PVB interlayer Thicknesses.
Fig. 10. Comparison of kinetic energy and ball displacement for various PVB interlayer thicknesses.
Fig. 11. Relationship of kinetic, rebound and absorbed energies for various PVB interlayer thicknesses.
International Journal of Engineering & Technology IJET-IJENS Vol:15 No:05 39 Therefore multiple reflections occur and the bending motion is
established. After contact duration of 40μs as shown in Figure 12, the sizes of the wavefront (deformed zone) predicted by Equation (11) and present analysis are a=31.3mm and 35mm which mean that the disturbance initiated by the impact at the center of the beam would travel 31.3mm and 35mm in the x- and -x-direction on infinite structures. For this 300x1000mm beam, the disturbance does not reach the boundary and is not reflected back. And, also, the impactor-plate mass ratio (0.00) is smaller than 2. Therefore, wave propagation method (wave-controlled impact) for infinite is still valid for impact analysis of this finite structures.
Table 3 shows comparison of wavefront between the present study and wave propagation model for various PVB interlayer thicknesses. From Table 3, it can be seen that results of present study are a little larger than those of wave propagation model but two results are agreed well to each other in condition of the same PVB interlayer thickness. The difference between these two results may be considered that this analysis is a complete model taking into account the full dynamic behaviors of the beam and boundary conditions, and the reference is a simple model for impacts on infinite structures. Therefore, the present finite element analysis means a reasonable model which can be described accurately impacts on this finite structures
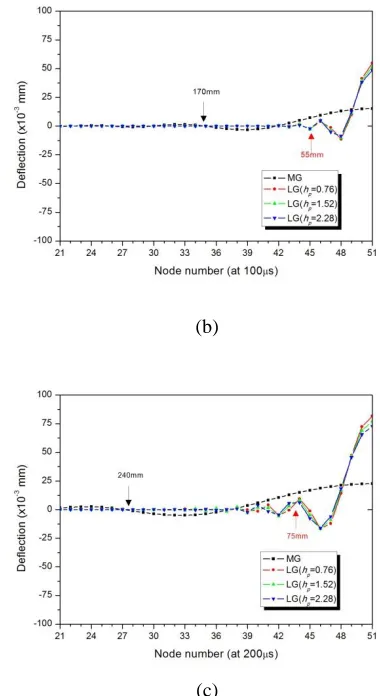
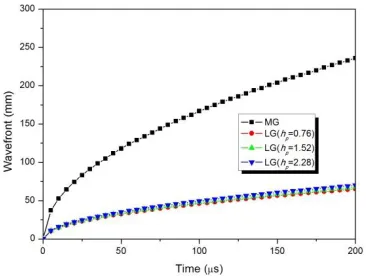
Figure 13 shows wavefront histories in x-direction at impact point for various PVB interlayer thicknesses obtained from this analysis in conjunction with wave propagation model. From Table 3 and Figure 13, we can see that the higher the thickness of PVB interlayer in LG is, the larger the wavefront becomes because of the bending rigidity of beam even though the difference is a little. But because the difference of wavefront due to various thickness of PVB interlayer of LG except the MG is very small, it can be concluded that the thickness of PVB interlayer is no significant on the magnitude of wavefront.
(a)
(b)
(c)
Fig. 12. Wavefront from impact point (node=51) by impact response at (a) 40μs (b) 100μs and (c) 200μs after impact for various PVB interlayer
thicknesses. Table III
Comparison of wavefront between the present study and wave propagation model for various PVB interlayer thicknesses
PVB interlayer thickness (mm)
Model
Contact time (μs) 40 100 200
MG 0.00
Wave propagation
model 105 167 236 Present study 110 170 240
LG 0.76
Wave propagation model
International Journal of Engineering & Technology IJET-IJENS Vol:15 No:05 40
Fig. 13. Wavefront histories in x-direction at impact point for various PVB interlayer thicknesses.
5. CONCLUSION
In the present study, a finite element approach for solving the effect of PVB interlayer thickness on LG window response under small mass impact is proposed and the corresponding finite element program is coded. Numerical results using the program are compared with those of energy balance model and wave propagation method, and are verified by a good agreement among these results. The impact energy and the wavefront of LG under various PVB interlayer thickness are additionally analyzed and compared with each other.
Through the present numerical results, it can be concluded that absorbed energy on LG regardless of PVB interlayer thickness is relatively large compared to the MG at the same total glass thickness. This means that PVB interlayer of LG beam may eventually be protected from impact damage because of higher absorbed ratio during impact. And, also, results indicate that LG is more impact resistant than the MG. But we can see that the variation of PVB interlayer thickness of LG does not affect so much on impact responses like the histories of contact force, kinetic energy and wavefront. The results of this research may be used a guide in making some preliminary design considering impact for LG composed of multilayer with different material properties in the future.
ACKNOWLEDGEMENT
This work was supported by Gyeongnam National University of Science and Technology Grant 2015.
REFERENCES
[1] Olsson, R., 1992, “Impact Response of Orthotropic Composite Plates Predicted from a One-parameter Differential Equation,” AIAA J., 30 (6), pp. 1587–1596.
[2] Olsson, R., 2000, “Mass Criterion for Wave Controlled Impact Response of Composite Plates,” Composites, Part A: Applied Science and Manufacturing, 31 (8), pp. 879–887.
[3] Olsson, R., 2003, “Closed Form Prediction of Peak Load and Delamination Onset Under Small Mass Impact,” Composite Structures, 59, pp. 341-349. [4] Olsson, R., 2010, “Analytical Model for Delamination Growth During
Small Mass Impact on Plates,” Int. J. of Solids and Structures, 47, pp. 2884-2892.
[5] Morinièere, F. D., Alderliesten, R. C., and Benedictus, R., 2012, “Energy Distribution in GLARE and 2024-T3 Aluminium During Low-velocity Impact,” 28th International Congress of the Aeronautical Sciences, pp. 1-9.
[6]Sun, C. T., and Huang, S. N., 1975, “Transverse Impact Problems by Higher Order Beam Finite Element,” Computers & Structures, 5, pp. 297-303.
[7]Sun, C. T., and Yang, S. H., 1980, “Contact Law and Impact Responses of Laminated Composites,” NASA-CR-159884.
[8]Yang, S. H., and Sun, C. T., 1982, “Indentation Law for Composite Laminates,” ASTM STP 787, pp. 425-449.
[9]Abrate, S., 1998, Impact on composite structures, Cambridge University Press, Cambridge, UK.
[10]Abrate. S., 1994, “Impact on Laminated Composites : Recent Advances,” Appl. Mech. Rev.47(11), pp. 517-44.
[11]Abrate. S., 2001, “Modeling of Impacts on Composite Structures,” Composite Structures, 51, pp. 129-138.
[12]Dharani, L. R., and Ji, F. S., 1998, “Dynamic Analysis of Normal Impact of Occupant Head on Laminated Glass, SAE Paper, No. 980862.
[13]Dharani, L. R., Ji, F. S., Behr, R. A., Minor, J. E., and Kremer, P. A., 2004, “Breakage Prediction of Laminated Glass Using the Sacrificial Ply Design Concept,” ASCE J., Archit. Eng., 10(4), pp. 126–135.
[14]Wei, J., and Dharani, L. R., 2005, “Fracture Mechanics of Laminated Glass Subjected to Blast Loading,” Theor. Appl. Fracture Mech., 44(2), pp. 157– 167.
[15]Wei, J., Shetty, M. S., and Dharani, L. R., 2006, “Stress Characteristics of a Laminated Architectural Glazing Subjected to Blast Loading,” Computer & Structures, 84, pp. 699-707.
[16]Wei, J., and Dharani, L. R., 2006, “Response of Laminated Architectural Glazing Subjected to Blast Loading,” Int. J. of Impact Eng., 32, pp. 2032-2047.
[17]Zhao, S., Dharani, L. R., Chai, L., and Barbat, S. D., 2006, “Analysis of Damage in Laminated Automotive Glazing Subjected to Simulated Head Impact,” Eng. Fail. Anal., 13, pp. 582-597.
[18]Zhao, S., Dharani, L. R., and Liang, X., 2008, “Analysis of Damage in Laminated Architectural Glazing Subjected to Blast Loading, Adv. Struct. Eng.,11, pp. 129-134.
[19]Shetty, M. S., Wei, J., Dharani, L. R., and Stutts, D. S., 2013, “Analysis of Damage in Laminated Architectural Glazing Subjected to Wind Loading and Winddborne Debris Impact,” Buildings, 3, pp. 422-441.
[20]Jalham, I. S., and Alsaed, O., 2011, “The Effect of Glass Plate Thickness and Type and Thickness of the Bonding Interlayer on the Mechanical Behavior of Laminated Glass,” New J. of Glass and Ceramics, 1, pp. 40-48. [21]Xu, J., Li, Y., Lu, G., and Zhou, W., 2009, “Reconstruction Model of
Vehicle Impact Speed in Pedestrian–vehicle Accident,” Int. J. of Impact Eng., 36, pp. 783-788.
[22]Kim, B. H., Ahn, K. C., and Lee, C. W., 2014, “Low Velocity Impact Behaviors of a Laminated Glass,” Smart Science, 2(4), pp. 209-213. . [23]Ahn, K. C., 2015, "Prediction of Wavefront on Laminated Composites Due
to Wave-Controlled Impact," Int. J. of Engineering & Technology IJET-IJENS, 15 (2), pp. 23~29.
![Fig. 1. Comparison between (a) wave-controlled and (b) boundary-controlled impact (Olsson[3, 4])](https://thumb-us.123doks.com/thumbv2/123dok_us/1359468.1645036/1.612.351.525.443.640/fig-comparison-wave-controlled-boundary-controlled-impact-olsson.webp)