Time-Frequency Signal Processing for Automated
Infant Cry Classification
J. Saraswathy,
a,*M. Hariharan,
bWan Khairunizam,
aI. Zunaidi,
aJ. Sarojini,
cN. Thiyagar,
dY. Sazali,
eShafriza
Nisha,
aS.A. Bakar,
aZ.M. Razlan
aa School of Mechatronic Engineering, University Malaysia Perlis (UniMAP),
Campus Pauh Putra, 02600 Perlis, Malaysia *Email: [email protected]
b Departmentof Electronics Engineering,National Institute of Technology,Srinagar (Garhwal)-246174, Uttarakhand, India c School of Bioprocess Engineering, University Malaysia Perlis (UniMAP),
Campus Jejawi 3, 02600 Arau, Perlis, Malaysia
d Head of Department, Consultant Pediatrician & Adolescent Medicine Specialist,
Department of Pediatrics,
Hospital Sultanah Bahiyah, 05460 Alor Setar, Kedah, Malaysia
e Universiti Kuala Lumpur Malaysian Spanish Institute,
Kulim Hi-Tech Park, 09000 Kulim, Kedah, Malaysia
Abstract-- This work proposes a novel investigation of time-frequency (t-f) based signal processing approach using Quadratic time-frequency distributions (QTFDs) namely Spectrogram (SPEC), Wigner-Ville distribution (WVD), Smoothed-Wigner Ville distribution (SWVD), Choi-William distribution (CWD) and Modified B-distribution (MBD) for classification of infant cry signals. T-f approaches have provedas an efficient approach for applications involving the non stationary signals. In feature extraction, a cluster of t-f based attributes were extracted from the suggested t-f approaches by extending time-domain and frequency-domain features to the joint (t-f) domain. Conventional features such as Mel-frequency cepstral coefficients (MFCCs) and Linear prediction coefficients (LPCs) were also extracted and their effectiveness was compared with the suggested methodology. The efficacy of the extracted feature vectors was validated using probabilistic neural network (PNN) and general regression neural network (GRNN). The proposed methodology was implemented to classify different sets of infant cry signals cry including binary and multiclass problems. Findings of this study significantly demonstrate the use of t-f method as an efficient practical clinical decision tool for infant cry classification.
Index Term-- Infant cry, Time-frequency analysis, Feature extraction, Classification
1. INTRODUCTION
The infant cry classification analysis implies objective methods, classification of different pattern of infant cry utterances and adoption of artificial and digital signal processing approaches. It is an immense field of research and according to the past researches the infant cry classification can be sorted into three different divisions of investigations: (1) Discrimination of normal and pathological cries namely deafness [1-5], sudden infant death syndrome (SIDS) [6], cleft palate [7-8], brain damage [9], hydrocephalus [10], asphyxia [11-15], hyperbilirubinemia [16-17], autism [18-19], hypothyroidism [20-21], cri du chat [22], Ankyloglossia with deviation of the epiglottis and larynx (ADEL) [23], Respiratory disorders [8], X-Chromosomal abnormalities
[24-25], heart defects [26-27] and neurological disorders [28], (2) Recognition of infant identity [29-30] and (3) Classification of the physical emotions of newborn namely anger, fear, discomfort, pain, and hunger [31-33].
Traditionally, infant cry classifications is restricted to the subjective methods especially the auditory perception and spectrographic analysis rely indeed on the expertise of human power in interpreting the status of observed cry signals. With the advance of information technology, the automatic non-invasive methods are widely applied and have reported pivotal merits in infant cry classification area. In the classification of different patterns of cry utterances, a plethora of techniques is constantly proposed.A large amount of acoustic cry features such as pitch information, spectral features, harmonic analysis, linear prediction coding and MFCCs [3-15] has been suggested to characterize the cry signals. However, most of the research works concentrated mainly on the application of MFCCs and LPCs in analyzing the non-stationary characteristics of newborn cry signals even though these methods limited to non stationary based analysis [34].
distribution (WVD), Smoothed-Wigner Ville distribution (SWVD), Choi-William distribution (CWD) and Modified B-distribution (MBD) for characterization of different patterns of newborn cry signals.In feature extraction, a group of t-f based features is extracted from the suggested t-f approaches by extending time-domain and frequency domain features to the joint (t-f) domain. Due to the complexity concern, only the best distribution from QTFDs (QTFD best) is selected and used
for classification by analyzing the discrimination capability of the extracted t-f features. In addition, conventional features such as Mel-frequency cepstral coefficients (MFCCs) and Linear prediction coefficients (LPCs) are also extracted to compare the efficacy of the t-f features. The extracted features are statistically validated. Different supervised classifiers namely probabilistic neural network (PNN) and general
regression neural network (GRNN) are exerted to discriminate the different patterns of cry signals. The findings of the study revealed encouraging outcomes and justified the approach proposed in this paper.
2. DATABASE
A Mexican database which normally referred as Baby
Chillanto database is considered for investigation [5]. It
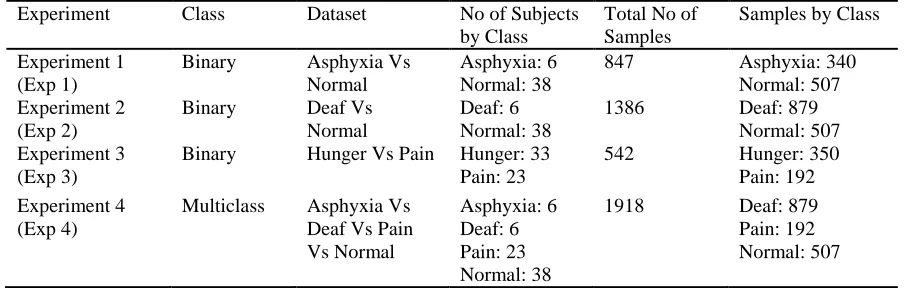
comprises of several class of cry signals namely normal, asphyxia, deaf, hunger and pain. Different cry datasets including binary and multi class are attempted using the cry database. Table 1 shows detail information on the infant cry database used, in terms of number of subjects involved in recording, total number of samples by class and the approached cry datasets for analysis as well.
Table I
Information on cry database used and approached cry datasets for analysis.
Experiment Class Dataset No of Subjects
by Class
Total No of Samples
Samples by Class
Experiment 1 (Exp 1)
Binary Asphyxia Vs
Normal
Asphyxia: 6 Normal: 38
847 Asphyxia: 340
Normal: 507 Experiment 2
(Exp 2)
Binary Deaf Vs
Normal
Deaf: 6 Normal: 38
1386 Deaf: 879
Normal: 507 Experiment 3
(Exp 3)
Binary Hunger Vs Pain Hunger: 33
Pain: 23
542 Hunger: 350
Pain: 192
Experiment 4 (Exp 4)
Multiclass Asphyxia Vs Deaf Vs Pain Vs Normal
Asphyxia: 6 Deaf: 6 Pain: 23 Normal: 38
1918 Deaf: 879
Pain: 192 Normal: 507
3. METHODOLOGY
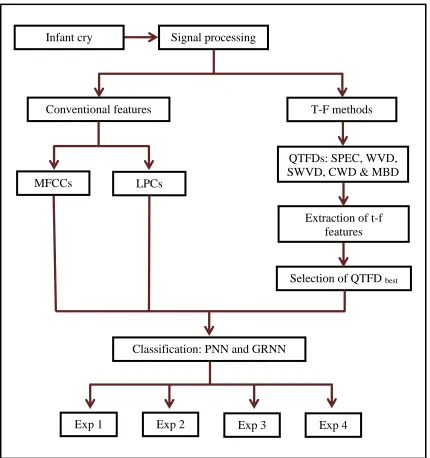
The block diagram of proposed study is figured in Fig. 1. The current study is attempted to investigate the effectiveness of the suggested t-f approach (QTFDs: SPEC, WVD, SWVD, CWD and MBD) for classification of newborn cry signals. Apart from the extraction of a cluster of t-f based features the signal processing phase also deals with the extraction of the state of the art attributes (MFCCs and LPCs) for comparison purpose. In this current study, hamming window is implemented to separate the investigational cry samples of 1s into frames of 50 ms with no overlaps. Subsequently, 16 coefficients of MFCCs (The first extracted MFCC coefficient is not considered for analysis) and LPCs are extracted from each frame by applying the MFCC and LPC techniques respectively [1-5]. The t-f based features are extracted from the investigational cry signals using the different members of QTFD. Latter due to the complexity concern, only the best QTFD (QTFD best) is selected and accounted for further
investigation by assessing the discrimination capability of the extracted features in terms of F-value. In classification phase, PNN and GRNN are employed to test the efficacy of the extracted attributes. The subsequent sections explain about the methodology of the work in detail.
3.1 Quadratic Time-Frequency Distributions
QTFDs are a collection of typical time-frequency distributions which analyzing a non-static signals in a joint time-frequency domain with consistent resolution. In many practical applications, QTFDs are exposed to be the suitable techniques for the processing and analyzing of multi component signals [35-37]. At the core of the quadratic class of TFDs is the WVD which is the most basic quadratic function of the time-domain signal, as other TFDs can be written as a two dimension filtering of the WVD.The WVD of a given real deterministic signal s (t) is given by
t
f
z
s
t
z
s
t
e
j
f
d
s
W
2
2
2
,
(1)where zs(t) is the analytic result of s (t), zs(t) = s (t) + j H
{s(t)} where H{} and τ represent the Hilbert transform and variable of the lag domain respectively.Generally, due to the transformation process from time to time-frequency domain, WVD contains cross-terms between the signal’s components. The cross-term artifacts can be attenuated or suppressed by convolving the WVD with a t-f kernel, y (t, f). This smoothed WVD defines then the general quadratic class of TFDs hereby denoted by ps (t, f) and expressed as
(, ) 2 2
) , ( ) , ( ,
F Gt z t z t
f t f t W f t
p s s
where G (t,τ)=F-1 f→ τ { γ (t, f)} is the time-lag kernel of the
distributions and F{ } is the Fourier transform (FT) [36-37, 42].
In this current study different smoothed version of WVD including SPEC, SWVD, CWD and MBD are selected and
their efficacy in infant cry classification is investigated. The detail information regarding the derivations and time-lag kernels of the distributions can be referred in [42].
Fig. 1. Block diagram of proposed study
3.2 Extracted Time-Frequency based Features and Classification
Subsequently, an assortment of different t-f based features which can be categorized into two different groups (Time-modulated features and Frequency- (Time-modulated features) is derived and extracted. The extracted t-f based features from respective groups are shown in Table 2. In both groups, a set of features which can be derived from time or frequency
domains respectively are considered by modulating them into t-f domain. Generally, in the case of non-stationary signals exploration, the t-domain even f-domain features do not reveal the non static properties of the signals clearly. In order to overcome this, t-f features which rich in information are taken into account.
In the classification process, the efficacy of the extracted features was tested using PNN and GRNN using two different validation methods (10-fold and conventional validation
Infant cry
Signal processing
Conventional features
T-F methods
MFCCs
LPCs
QTFDs: SPEC, WVD,
SWVD, CWD & MBD
Selection of QTFD
bestClassification: PNN and GRNN
Exp 1
Exp 2
Exp 3
Exp 4
methods). The smoothing parameter of the classifiers is fixed to 0.036 based on the experimental investigations.
Table II Extracted t-f based features.
Time- modulated features (Group 1) Frequency- modulated features (Group 2)
F1: Mean,
F2: Standard deviation, F3: Variance,
F4: Skewness, F5: Kurtosis,
F6: Median absolute deviation, F7: Coefficient of variation, F8: RMS amplitude, F9: Inter quartile range, F10: Shannon entropy F11: Norm entropy
F12: Spectral flux, F13: Spectral centroid, F14: Spectral roll-off, F15: Renyi entropy, F16: Half sub-band energy F17: Full sub-band energy
4. IMPLEMENTATIONS
This section was allocated to a comprehensive results and discussion resulted by implementing the methodology of the paper on different datasets of infant cry signals.
4.1 Selection of QTFD (best)
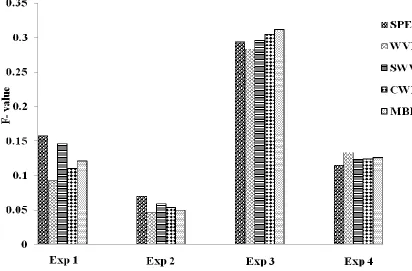
The best member of QTFD for the respective experiments was selected by investigating the discrimination capability of the extracted t-f features from the five different distributions of QTFD (SPEC, WVD, SWVD, CWD and MBD). The discrimination capabilities of each extracted feature were
analyzed by computing the F-value. The mean of F-values from respective QTFDs for different cry datasets were presented respectively in Fig. 2. Fig. 2, clearly shows the dispersion of discrimination capabilities of t-f based features from the suggested QTFDs and it was observed that in Exp 1 and Exp 2 the F-values from SPEC were greater compared to others, as well as the MBD in Exp 3. Subsequently, the t-f features of the best QTFD for the respective experiments were used further for classification.
Fig. 2. F- values of extracted features using QTFDs for different datasets
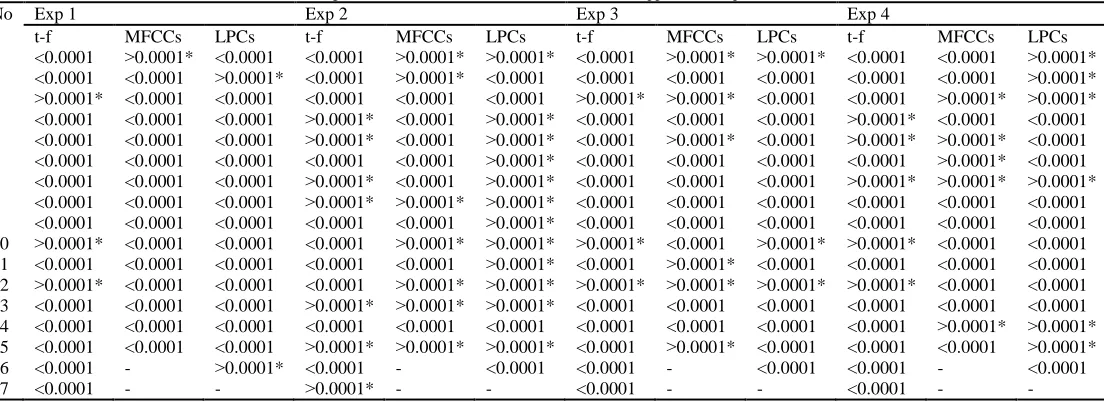
4.2 Statistical Analysis on Extracted Cry Features
Prior to empirical test, the discrimination abilities of extracted attributes in context of discrimination of different newborn cry signals were statistically analyzed. The
extracted features in terms of p values for the different experiments were tabulated in Table 3. From the Table 3, it was indicated that the t-f features showed greater variations between different classes of cry signals compared to MFCCs and LPCs in most of the approached experimental cases. 4.3 Performance Evaluation
The empirical results using the extracted feature vectors for the suggested experiments were presented and discussed. PNN and GRNN were used to examine the efficacy of the feature vectors via three different validation methods namely 10-fold cross validation, conventional validation (60% training and 40% testing) and data independent validation (data segregated independently for training and testing, where the segregated training set was not considered for the testing phase and vice versa).
The performance of classifiers towards the extracted cry features was assessed in terms of sensitivity, specificity and overall accuracy. These measures were calculated from the
true positive (TP), true negative (TN), false positive (FP) and false negative (FN) during classifications using the Eqs. (3) - (5):
FN
TP
TP
(Se)
y
Sensitivit
(3)FP
TN
TN
(Sp)
y
Specificit
(4)
FN
FP
TN
TP
TN
TP
)
Acc
(
accuracy
Total
(5)
Table III
The statistical significant details on the extracted features of the approached experiments
No Exp 1 Exp 2 Exp 3 Exp 4
t-f MFCCs LPCs t-f MFCCs LPCs t-f MFCCs LPCs t-f MFCCs LPCs
1 <0.0001 ˃0.0001* <0.0001 <0.0001 ˃0.0001* ˃0.0001* <0.0001 ˃0.0001* ˃0.0001* <0.0001 <0.0001 ˃0.0001* 2 <0.0001 <0.0001 ˃0.0001* <0.0001 ˃0.0001* <0.0001 <0.0001 <0.0001 <0.0001 <0.0001 <0.0001 ˃0.0001* 3 ˃0.0001* <0.0001 <0.0001 <0.0001 <0.0001 <0.0001 ˃0.0001* ˃0.0001* <0.0001 <0.0001 ˃0.0001* ˃0.0001* 4 <0.0001 <0.0001 <0.0001 ˃0.0001* <0.0001 ˃0.0001* <0.0001 <0.0001 <0.0001 ˃0.0001* <0.0001 <0.0001 5 <0.0001 <0.0001 <0.0001 ˃0.0001* <0.0001 ˃0.0001* <0.0001 ˃0.0001* <0.0001 ˃0.0001* ˃0.0001* <0.0001 6 <0.0001 <0.0001 <0.0001 <0.0001 <0.0001 ˃0.0001* <0.0001 <0.0001 <0.0001 <0.0001 ˃0.0001* <0.0001 7 <0.0001 <0.0001 <0.0001 ˃0.0001* <0.0001 ˃0.0001* <0.0001 <0.0001 <0.0001 ˃0.0001* ˃0.0001* ˃0.0001* 8 <0.0001 <0.0001 <0.0001 ˃0.0001* ˃0.0001* ˃0.0001* <0.0001 <0.0001 <0.0001 <0.0001 <0.0001 <0.0001 9 <0.0001 <0.0001 <0.0001 <0.0001 <0.0001 ˃0.0001* <0.0001 <0.0001 <0.0001 <0.0001 <0.0001 <0.0001 10 ˃0.0001* <0.0001 <0.0001 <0.0001 ˃0.0001* ˃0.0001* ˃0.0001* <0.0001 ˃0.0001* ˃0.0001* <0.0001 <0.0001 11 <0.0001 <0.0001 <0.0001 <0.0001 <0.0001 ˃0.0001* <0.0001 ˃0.0001* <0.0001 <0.0001 <0.0001 <0.0001 12 ˃0.0001* <0.0001 <0.0001 <0.0001 ˃0.0001* ˃0.0001* ˃0.0001* ˃0.0001* ˃0.0001* ˃0.0001* <0.0001 <0.0001 13 <0.0001 <0.0001 <0.0001 ˃0.0001* ˃0.0001* ˃0.0001* <0.0001 <0.0001 <0.0001 <0.0001 <0.0001 <0.0001 14 <0.0001 <0.0001 <0.0001 <0.0001 <0.0001 <0.0001 <0.0001 <0.0001 <0.0001 <0.0001 ˃0.0001* ˃0.0001* 15 <0.0001 <0.0001 <0.0001 ˃0.0001* ˃0.0001* ˃0.0001* <0.0001 ˃0.0001* <0.0001 <0.0001 <0.0001 ˃0.0001* 16 <0.0001 - ˃0.0001* <0.0001 - <0.0001 <0.0001 - <0.0001 <0.0001 - <0.0001
17 <0.0001 - - ˃0.0001* - - <0.0001 - - <0.0001 - -
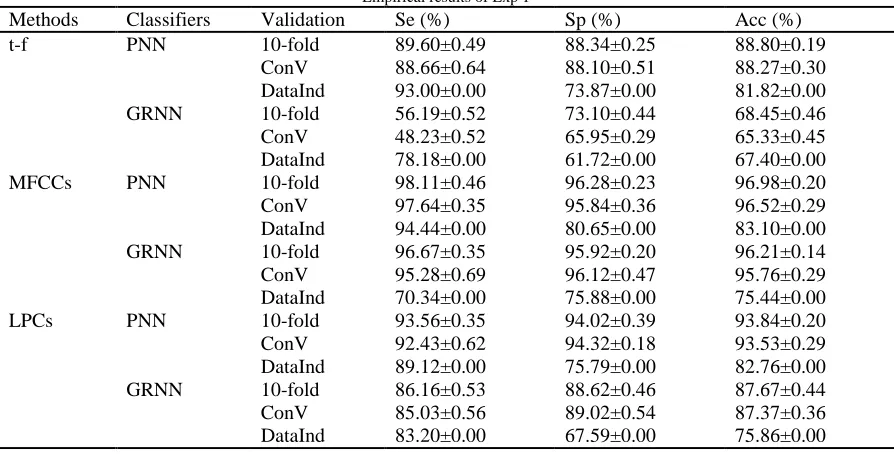
Tables 4-7 tabulate the empirical results using the suggested t-f t-features and conventional t-features t-for Exp 1 - Exp 4 respectively. From the Table 4 it was observed that in discrimination of asphyxia from normal babies (Exp 1) convincing maximum accuracy of 88.80 ± 0.19 % was obtained using the t-f features which is comparable with the results using the conventional features (MFCCs: 96.98±0.20 % and LPCs: 93.84±0.20 %). From the Table 5 it was observed that, in discrimination of deaf from normal babies (Exp 2) the maximum classification accuracy of 95.79 ± 0.14 % was obtained using the t-f features which is greater compared to the best result obtained using the conventional feature, MFCCs (93.17± 0.28 %).
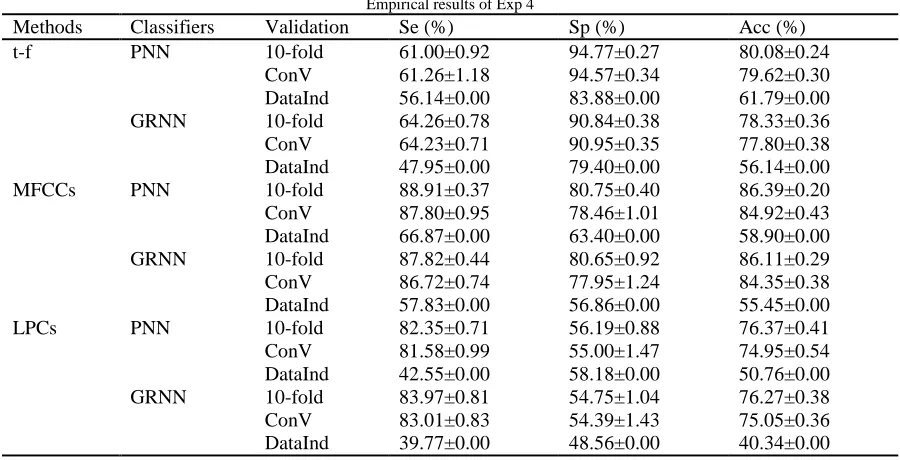
As shown in Table 6, the maximum classification result of 98.51 ± 0.06 % was attained using the t-f features in discrimination of hunger from pain babies (Exp 3) which is greater compared to the best result obtained using the conventional feature, MFCCs (94.45±0.49 %). Highest result of 80.08 ± 0.24 % was obtained using the t-f features in classification of the multi class problem as seen in Table 7 which is comparable with the best result of 86.39±0.20 % using MFCCs.
The effectiveness of the t-f approaches in classification of different patterns of cry datasets were tested empirically and discussed. In overall, it was observed that the t-f features outperformed in Exp 2 and Exp 3 whereas in Exp 1 and Exp 4 provided comparable results with the conventional features (MFCCs and LPCs) and this clearly shows the good potential of the suggested t-f methods in infant cry classification. Table 8 presents the information on direct comparison of the approached binary classes with literatures [4, 45-47]. Maximum accuracy of above 90 % was reported for the binary problems (Exp 1- Exp 3) using MFCCs and different classification models via 10-fold cross validation scheme as shown in Table 8. In this current work, promising and convincing classification results were presented using three different classification validation schemes especially the data independent validation which was not attempted so far in other studies. Experiment 4 is utterly new in infant cry classification hence direct comparison with literature is unavailable. The results of this current study indicate the potential of the suggested t-f techniques for efficient discrimination of newborn cry signals and encourage the application of t-f based methodology for infant cry classification analysis.
Table IV Empirical results of Exp 1
Methods Classifiers Validation Se (%) Sp (%) Acc (%)
t-f PNN 10-fold 89.60±0.49 88.34±0.25 88.80±0.19
ConV 88.66±0.64 88.10±0.51 88.27±0.30
DataInd 93.00±0.00 73.87±0.00 81.82±0.00
GRNN 10-fold 56.19±0.52 73.10±0.44 68.45±0.46
ConV 48.23±0.52 65.95±0.29 65.33±0.45
DataInd 78.18±0.00 61.72±0.00 67.40±0.00
MFCCs PNN 10-fold 98.11±0.46 96.28±0.23 96.98±0.20
ConV 97.64±0.35 95.84±0.36 96.52±0.29
DataInd 94.44±0.00 80.65±0.00 83.10±0.00
GRNN 10-fold 96.67±0.35 95.92±0.20 96.21±0.14
ConV 95.28±0.69 96.12±0.47 95.76±0.29
DataInd 70.34±0.00 75.88±0.00 75.44±0.00
LPCs PNN 10-fold 93.56±0.35 94.02±0.39 93.84±0.20
ConV 92.43±0.62 94.32±0.18 93.53±0.29
DataInd 89.12±0.00 75.79±0.00 82.76±0.00
GRNN 10-fold 86.16±0.53 88.62±0.46 87.67±0.44
ConV 85.03±0.56 89.02±0.54 87.37±0.36
Table V Empirical results of Exp 2
Methods Classifiers Validation Se (%) Sp (%) Acc (%)
t-f PNN 10-fold 93.66±0.14 91.23±0.22 95.79±0.14
ConV 93.50±0.34 91.19±0.62 95.65±0.24
DataInd 77.32±0.00 57.38±0.00 80.34±0.00
GRNN 10-fold 83.72±0.21 68.11±0.43 77.60±0.28
ConV 83.27±0.36 67.45±0.34 77.04±0.25
DataInd 66.67±0.00 52.22±0.00 53.89±0.00
MFCCs PNN 10-fold 94.33±0.18 91.13±0.61 93.17±0.28
ConV 93.73±0.49 90.43±0.53 92.52±0.43
DataInd 87.92±0.00 50.00±0.00 68.65±0.00
GRNN 10-fold 93.11±0.22 88.60±0.40 91.47±0.24
ConV 92.22±0.42 87.32±0.59 90.42±0.32
DataInd 75.78±0.00 42.33±0.00 53.62±0.00
LPCs PNN 10-fold 84.97±0.22 82.61±0.57 84.21±0.24
ConV 84.09±0.55 79.99±0.85 82.74±0.57
DataInd 76.20±0.00 51.11±0.00 69.26±0.00
GRNN 10-fold 71.29±0.36 48.71±0.56 62.40±0.45
ConV 71.73±0.39 49.87±0.46 63.24±0.37
DataInd 66.67±0.00 40.48±0.00 41.88±0.00
Table VI Empirical results of Exp 3
Methods Classifiers Validation Se (%) Sp (%) Acc (%)
t-f PNN 10-fold 99.11±0.09 97.42±0.00 98.51±0.06
ConV 98.90±0.24 97.53±0.29 98.40±0.20
DataInd 88.95±0.00 72.01±0.00 82.50±0.00
GRNN 10-fold 95.54±0.39 92.41±0.46 94.24±0.29
ConV 95.29±0.36 93.28±1.01 94.27±0.26
DataInd 78.18±0.00 61.72±0.00 64.32±0.00
MFCCs PNN 10-fold 96.92±0.49 90.26±0.68 94.45±0.49
ConV 95.63±0.39 88.52±0.89 92.93±0.43
DataInd 84.26±0.00 58.70±0.00 72.50±0.00
GRNN 10-fold 94.30±0.70 87.84±0.67 91.05±0.58
ConV 93.72±0.78 85.88±0.87 89.58±0.67
DataInd 71.70±0.00 64.06±0.00 66.00±0.00
LPCs PNN 10-fold 94.36±0.42 90.02±0.51 92.82±0.39
ConV 93.99±0.50 86.89±0.87 91.32±0.56
DataInd 86.75±0.00 51.28±0.00 63.00±0.00
GRNN 10-fold 89.73±0.35 77.41±0.82 85.11±0.41
ConV 89.44±0.75 76.76±0.83 84.54±0.58
Table VII Empirical results of Exp 4
Methods Classifiers Validation Se (%) Sp (%) Acc (%)
t-f PNN 10-fold 61.00±0.92 94.77±0.27 80.08±0.24
ConV 61.26±1.18 94.57±0.34 79.62±0.30
DataInd 56.14±0.00 83.88±0.00 61.79±0.00
GRNN 10-fold 64.26±0.78 90.84±0.38 78.33±0.36
ConV 64.23±0.71 90.95±0.35 77.80±0.38
DataInd 47.95±0.00 79.40±0.00 56.14±0.00
MFCCs PNN 10-fold 88.91±0.37 80.75±0.40 86.39±0.20
ConV 87.80±0.95 78.46±1.01 84.92±0.43
DataInd 66.87±0.00 63.40±0.00 58.90±0.00
GRNN 10-fold 87.82±0.44 80.65±0.92 86.11±0.29
ConV 86.72±0.74 77.95±1.24 84.35±0.38
DataInd 57.83±0.00 56.86±0.00 55.45±0.00
LPCs PNN 10-fold 82.35±0.71 56.19±0.88 76.37±0.41
ConV 81.58±0.99 55.00±1.47 74.95±0.54
DataInd 42.55±0.00 58.18±0.00 50.76±0.00
GRNN 10-fold 83.97±0.81 54.75±1.04 76.27±0.38
ConV 83.01±0.83 54.39±1.43 75.05±0.36
DataInd 39.77±0.00 48.56±0.00 40.34±0.00
Table VIII
Direct comparison of the proposed methodology with literatures
References Signal Processing
Classification Classification accuracy (%)
Exp 1 Exp 2 Exp 3
[4] MFCCs + PCA Fuzzy Relational
Neural Network
84 (randomly selected training and testing datasets)
98 (randomly selected training and testing datasets)
95.24 (randomly selected training and testing datasets)
[45] MFCCs + PCA Fuzzy Relational
Neural Network
88.67 (10-fold) 97.55 (10-fold) 96.03 (10-fold)
[46-47] MFCCs Genetic Selection of
Fuzzy Model
90.68 (10-fold) 99.42 (10-fold) 97.96 (10-fold)
Current study Proposed method
PNN and GRNN 88.80 (10-fold)
88.20 (ConV: 60 % training and 40 % testing) 81.82 (DataInd)
95.79 (10 fold) 95.65 (ConV: 60 % training and 40 % testing) 80.34 (DataInd)
98.51 (10-fold) 98.40 (ConV: 60 % training and 40 % testing) 82.50 (DataInd)
5.DISCUSSION AND CONCLUSIONS
This paper addresses the potential of using t-f analysis based methods to classify different patterns of newborn cry signals. Towards this aim, new investigation of t-f based signal processing approach using QTFDs (SPEC, WVD, SWVD, CWD and MBD) for classification of cry signals was suggested. The efficacy of the suggested t-f methods was investigated using different cry datasets including binary and multi class problems. In feature extraction, a cluster of t-f based features from the suggested t-f based signal processing along with conventional features (MFCCs and LPCs) were extracted. In order to reduce the computational complexity, only the best QTFD (QTFDs) was selected by analyzing the discrimination capability of the extracted t-f features from respective members of QTFD in terms of F-value. PNN and
GRNN were used to test the reliability of the extracted feature vectors in classification phase.
In the literatures (Table 8), best classification results above 90 % were demonstrated (Exp 1 - Exp 3) using MFCCs and a customized fuzzy model generated through the Genetic Selection of Fuzzy Model Algorithm. Nevertheless, it was reported that the proposed model can be computationally expensive due to the application of evolutionary algorithm [8]. Our proposed methodology computationally simple, showed convincing performance with the literatures and findings of this study were extensively support the application of t-f methods for effective newborn cry classification analysis. We envisage that the current finding provides compelling evidence for further research on newborn cry classification analysis and this could be precious in future clinical trial applications.
However, some practical issues regarding the proposed system can be remarked from this study. Firstly, it is an offline system however the efforts could be extended in real time applications. The system was trained and tested using only the available infant cry database, validation using a larger scale of different origins of databases could be more significant. Moreover, in this study, we performed infant cry classification as binary and multi class problem (four class). Classification of other different cry datasets including multi class problems up to four classes and analysis of severity levels of different pathological conditions may head towards development of reliable cry systems.In addition, in this study, selection of the QTFD best was performed and found that the best member of
QTFD for the different suggested cry datasets were not similar, optimization of a QTFD best for all types of cry signals
could be more standardized. The best parameters of the suggested methods in this study were found through empirical study however selection via optimization techniques could improve the precision.
ACKNOWLEDGEMENTS
The authors would like to thank Dr. Carlos Alberto Reyes-Garcia, Researcher, CCC-Inaoep, Mexico for providing the Mexican Baby Chillantoinfant cry database. Thanks are also extended to Prof. Boualem Boashash from Qatar University and his co-researchers for sharing the t-f toolbox. All authors declare that they have no financial or any commercial conflicts of interest.The work is supported by FRGS research grant [Grant No: 9003-00485] received from Ministry of Education Malaysia.
REFERENCES
[1] Orozco J, Garcia C: Detecting pathologies from infant cry applying scaled conjugate gradient neural networks. In: Proceedings of the European Symposium on Artificial Neural Networks 2003; 349-354.
[2] Garcia JO, Reyes Garcia CA: Mel frequency cepstrum coefficients extraction from infant cry for classification of normal and pathological cry with feed-forward neural networks. In: Proceedings of the International Joint Conference on Neural Networks 2003; 3140-3145.
[3] Varallyay Jr G, Benyo Z, Illenyi A, Farkas Z, Kovacs L: Acoustic analysis of the infant cry: classical and new methods. In: Proceedings of the 26th Annual International Conference of the IEEE EMBS 2004; 313-316.
[4] Barajas SE, Reyes CA: Your fuzzy relational neural network parameters optimization with a genetic algorithm. In: Proceedings of the 2005 IEEE International Conference on Fuzzy Systems 2005; 684-689.
[5] Reyes-Galaviz OF, Cano-OrtizS, Reyes-Garcia C: Evolutionary-neural system to classify infant cry units for pathologies identification in recently born babies. In: Proceedings of the 8th Mexican International Conference on Artificial Intelligence 2009; 330-335.
[6] Robb MP, Crowell DH, Dunn-Rankin P: Sudden infant death syndrome: cry characteristics. International Journal of Pediatric Otorhinolaryngology 2013; 77: 1263-1267.
[7] Lederman D, Cohen A, Zmora E, Wermke K, Hauschildt S, Stellzig-Eisenhauer A: On the use of hidden markov models in infants’ cry classification. In: Proceedings of the 22nd Convention in Electrical and Electronic Engineers 2002: 350-352.
[8] Lederman D, Cohen A, Zmora E, Wermke K, Hauschildt S, Stellzig-Eisenhauer A: Classification of cries of infants with cleft-palate using parallel hidden markov models. Med. Biol. Eng Comput 2008; 46: 965-975.
[9] Boukydis CFZ, Lester BM: Infant crying. Plenum press, 1995.
[10] Michelsson K, Kaskinn H, Aulanko R, Rinne A: Sound
spectrographic cry analysis of infants with hydrocephalus. Acta Paediatrica Scandinavica 1984; 73: 65-68.
[11] Sahak R, Mansor W, Lee YK, Yassin IM, Zabidi A: Performance of combined support vector machine and principal component analysis in recognizing infant cry with asphyxia. In: Proceedings of the 32nd Annual International Conference of the IEEE EMBS 2010; 6292-6295.
[12] Zabidi A, Mansor W, Khuan LY, Yassin IM, Sahak R: Binary particle swarm optimization for selection of features in the recognition of infants cries with asphyxia. In: Proceedings of the 7th International Colloquium on signal processing & its applications 2011; 272-276.
[13] Hariharan M, Yaacob S, Awang SA: Pathological infant cry analysis using wavelet packet transform and probabilistic neural network. Exp Syst Appl 2011; 12: 15377-15382.
[14] Saraswathy J, Hariharan M, Nadarajaw T, Khairunizam W, Yaacob S: Optimal selection of mother wavelet for accurate infant cry classification. Australas Phys Eng Sci Med 2014; 37: 439-456.
[15] Hariharan, Lim Sin Chee, Sazali Yaacob: Analysis of infant cry through weighted linear prediction cepstral coefficients and probabilistic neural network. Journal of Medical Systems 2012; 36: 1309-1315.
[16] Santiago-Sanchez K, Reyes-Garcia CA, Gomez-Gil P: Type-2 fuzzy sets applied to pattern matching for the classification of cries of infants under neurological risk. Lect Notes Comput Sci 2009; 5754: 201-210.
[17] Kheddache Y, Tadj C: Acoustic measures of the cry characteristics of healthy newborns and newborns with pathologies. Journal of Biomedical Science and Engineering 2013; 6: 796-804.
[18] Orlandi S, Manfredi C, Bocchi1 L, Scattoni ML: Automatic newborn cry analysis: a non-invasive tool to help autism early diagnosis. In: Proceedings of the 34th Annual International Conference of the IEEE EMBS San Diego 2012: 2953-2956. [19] Sheinkopf SJ, Iverson JM, Rinaldi ML, Lester BM: A typical cry
acoustics in 6-month-old infants at risk for autism spectrum disorder. INSAR Research Article Autism Research 2012; 1-9.
[20] Zabidi A, Mansor W, Khuan LY, Yassin IM, Sahak R:
Classification of infant cries with hypothyroidism using multilayer perceptron neural network. In: Proceedings of the 2009 IEEE International Conference on Signal and Image Processing Applications 2009; 246-251.
[21] Zabidi A, Khuan LY, Mansor W, Yassin IM, Sahak R: Detection of infant hypothyroidism with mel frequency cepstrum analysis and multi-layer perceptron classification. In: Proceedings of the 6th International Colloquium on Signal Processing & Its Applications 2010; 140-144.
[23] Okada Y, Fukuta K, Nagashima T: Iterative forward on cross-validation approach and its application to infant cry classification. In: Proceedings of the International Multi Conference of Engineers and Computer Scientists 2011.
[24] Alaie, Tadj C: Cry-based classification of healthy and sick infants using adapted boosting mixture learning method for gaussian mixture models. Modeling and Simulation in Engineering 2012: 5. [25] Kheddache Y, Tadj C: Newborn’s pathological identification
system. In: Proceedings of the 11th International Conference on Information Science, Signal Processing and their Applications 2012; 1024-1029.
[26] Kheddache, Tadj: Characterization of pathologic cries of newborns based on fundamental frequency estimation. Engineering 2013; 5: 272-276.
[27] Kheddache, Tadj: Resonance frequencies behavior in pathologic cries of newborns. Journal of Voice 2014; 29: 1-12.
[28] Cano S, Suaste I, Escobedo D, Reyes-Garcia CA, Ekkel T: A radial basis function network oriented for infant cry classification. In Progress in Pattern Recognition, Image Analysis and Applications 2004: 374-380.
[29] Patil HA: Infant identification from their cry. In: Proceedings of the 7th International Conference on Advances in Pattern Recognition 2009: 107-110.
[30] Messaound A, Tadj C. A cry-based babies identification system. Lect Notes Comput Sci 2010; 6134: 192-199.
[31] Petroni M, Malowany AS, Johnston CC, Stevens BJ: Identification of pain from infant cry vocalizations using artificial neural networks (ANNs). In: Proceedings of the SPIE's Symposium on OE/Aerospace Sensing and Dual Use Photonics 1995: 729-738.
[32] Barajas-Montiel SE, Reyes-Garcia CA: Identifying pain and hunger in infant cry with classifiers ensembles. In: Proceedings of the International Conference on Computational Intelligence for Modeling, Control and Automation, and International Conference on Intelligent Agents 2005: 770-775.
[33] Vempada RR, Kumar B, Rao KS: Characterization of infant cries using spectral and prosodic features. In: Proceedings of the National Conference in Communications 2012: 1-5.
[34] Saraswathy J, Hariharan M, Yaacob S, Khairunizam W: Automatic classification of infant cry: a review. In: Proceedings of the 2012 international conference on biomedical engineering 2012, 543-548. [35] Abdulla W, Wong L: Neonatal EEG signal characteristics using time frequency analysis, Physica A: Statistical Mechanics and its Applications 2011; 390: 1096-1110.
[36] Boashash B, Boubchir L: On the selection of time-frequency features for improving the detection and classification of newborn EEG seizure signals and other abnormalities. In Neural Information Processing 2012; 634-643.
[37] Boashash B, Khlif MS, Ben-Jabeur T, East CE, Colditz PB: Passive detection of accelerometer-recorded fetal movements using a time-frequency signal processing approach. Digital Signal Processing 2014; 25: 134-155.
[38] Hariharan M, Sindhu R, Yaacob S: Normal and hypoacoustic infant cry signal classification using time-frequency analysis and general regression neural network. Computer Methods and Programs in Biomedicine 2012; 108: 559-569.
[39] Saraswathy J, Hariharan M, Vijean V, Yaacob S, Khairunizam W: Performance comparison of daubechies wavelet family in infant cry classification. In: Proceedings of the 8th International Colloquium on Signal Processing and its Applications 2012: 451-455.
[40] Hariharan M, Saraswathy J, Sindhu R, Khairunizam W, Yaacob S: Infant cry classification to identify asphyxia using time-frequency analysis and radial basis neural networks, Expert Systems with Applications 2012; 39: 9515-9523.
[41] Saraswathy J, Hariharan M, Khairunizam W, Yaacob S, Thiyagar N: Infant cry classification: time frequency analysis. International Conference in Control System, Computing and Engineering 2013: 499-504.
[42] www.time- frequency.net
[43] Specht DF: Probabilistic neural networks, IEEE Transactions on Neural Networks 1990; 3: 109-118.
[44] Specht DF: A general regression neural network, IEEE Transactions on Neural Networks 1991; 2: 568-576.
[45] Rosales-Perez A, Reyes-Garcia CA, Gomez-Gil P: Genetic Fuzzy Relational Neural Network for Infant Cry Classification. Lect Notes Comput Sci 2011; 6718: 288-296.
[46] Rosales-Perez A, Reyes-Garcia CA, Gonzalez JA, Arch-Tirado E: Infant cry classification using genetic selection of a fuzzy model. Lect Notes Comput Sci 2012; 7441: 212-219.