* Corresponding author.ORCID ID: https://orcid.org/0000-0002-3436-5337
Does institutional ownership moderate the effect of intellectual capital
and company value?
Rahmita Dwinesia Paputungan a
, Bambang Subroto b, Abdul Ghofar c
a,b,cAccounting Department, Faculty of Economics and Business, University of Brawijaya, Malang, Indonesia
ARTICLE INFO Article history: Received 19 November19
Received in rev form 09 December 19 Accepted 12 December 19 Keywords: Intellectual Capital Institutional Ownership Company Value JEL Classification: G32; G33 A B S T R A C T
This study aims to empirically examine the influence of intellectual capital towards company value and also its influence while being moderated by institutional ownership. This study uses purposive sampling to determine samples from manufacturing companies listed in Indonesia Stock Exchange during the year of 2014–2018. The total sample obtained in this study is 301 from the 720 population of data throughout the research year. Data analysis techniques use multiple regression and moderated regression analysis (MRA) methods. The results of this study show that Intellectual Capital has a positive significant effect on company value while institutional ownership does not have a significant effect on moderating the influence of intellectual capital towards company value. The practical implication of this study is to provide information to managers or owners of public manufacturing companies and investors about the Bimportance of intangible assets investment like intellectual capital as the competitive strategies to achieve more optimal company value, as well as for regulator to make clear regulations about the disclosures of intangible assets.
© 2019 Bussecon International Academy. Hosting by SSBFNET. All rights reserved. Peer review under responsibility of Bussecon International Academy & SSBFNET.
Introduction
Increasingly competitive industry makes companies face challenges and opportunities (Bchini, 2015). Therefore, companies are required to use modern strategies and policies to be able to compete in order to be competitive and successful (Hejazi, Ghanbari, & Alipour, 2016). The company's competitiveness can be assessed through the company value. In other words, the company value demonstrates that the company is able to achieve prolonged success and this can attract investors to invest their funds in the company. The good condition of the company is marked by an increase in the value of the company and the measurement of company value can be done by using market valuations (Tobin's Q). Unfortunately, the company's current value shows a plummet that has an impact on business sustainability and investor decisions in the company. Based on author’s calculation about company value measured by Tobin’s Q from the manufacturing data, the company values has been fluctuated in the past 5 years, from 2014 to 2018. The company values from 2014 to 2018 respectively are 2.34, 1.61, 1.77, 1.82 and 1.62. In 2016 and 2018, company values were inclined but in 2015 and 2017, company values were decreased. Despite of the fluctuation, the trends shows an inclination of company value during that time in which it can jeopardize the sustainability of a company. That is why a company must find a solution for that case. The solution of the case above can be done by management through implementing a strategy. In this current era, business places more emphasis on the knowledge based (Guthrie, Ricceri, & Dumay, 2012). Hence, one of the strategies that can be undertaken is by using intangible assets such as intellectual capital. Intellectual capital consists of human resources and structural capital, in which it relates to ability and the knowledge of human resource (Ismail & Karem, 2011). In addition, intellectual capital can also contribute to raise the share prices (Feimianti & Anantadjaya, 2015), that can attract investors and influence investor’s decision as well as the
Research in Business & Social Science
IJRBS VOL 9 NO 1 ISSN: 2147-4478
Available online at www.ssbfnet.com
company value (Chung & Zhang, 2011)chi. Thus, intellectual capital creates value added as the competitive advantage for the company that can elevate company value.
There are also other studies which state that intellectual capital has a positive effect on company value, such as research conducted by Sharabati, Jawad, & Bontis (2010), Nuryaman (2015), Berzkalne & Zelgalve (2014) and Hejazi et al. (2016). Even so, research done by Mehralian, Rajabzadeh, & Rasekh (2012), Shaban & Kavida (2015), Iranmahd, Moeinaddin, Shahmoradi, & Heyrani (2014) and Subaida, Nurkholis, & Mardiati (2018) show that intellectual capital does not have a significant effect on firm value. It means that there is inconsistency in this topic of research. That inconsistency is important to be learned through a further research. This study use moderating variable as the solution to see the cause of that inconsistencies, which is also become a novelty of this study. Institutional ownership structure becomes the moderating variable since it meets the contingent requirement of moderating variable related to the ownership structure. Institutional ownership structure is also believed to be the right governance to rise the value of the company. The existence of governance in company can mitigate agency problems and provide assurance that management activities concentrate on maximizing company performance (Shleifer & Vishny, 1997). Outside investors (institutions) will mitigate agency problems through their strengths and supervision (Susilowati, Puspitasari, & Yuseno, 2017), so it will make management to work by improving company performance through strategic decisions namely intellectual capital. Furthermore, previous researches conducted by Ruiz-mallorquí & Santana-martín (2011), Thanatawee (2014), Abukosim, Mukhtaruddin, Ferina, & Nurcahaya (2014) and Chen, Blenman, & Chen (2014) also found a significant positive effect between the structure of institutional ownership and company performance. Therefore, the relations between institution ownership structure as the moderating variable and the influence of intellectual capital towards company value is that the institution as the owner will work based on company’s objectives, so they will use strategy that can escalate company value, one of it is by using intellectual capital.
Based on the downward trend phenomenon of company value assessed by Tobin's Q in manufacturing companies for the past 5 years, this study aims to analyze whether intellectual capital affects company value and whether institutional ownership structure strengthens the influence of intellectual capital on company value.
Literature Review
Intellectual Capital
Intellectual capital is intangible assets in an organization (Andriessen, 2004). Those resources can increase company value since it has its own competitive advantage. Its competitive advavantage can determine the performance of a company since it relates with ability of resource to generate, distribute and implement the knowledge in organization (Husnah, Subroto, Aisjah, & Djumahir, 2013). The resource-based theory by Barney (1991) states that intellectual capital is what creates competitive advantage in companies. These advantages create added value to the company (Dumay, 2016), so that the company is able to achieve sustainable success. The added value comes from four values, namely valuable, rare, cannot be imitated and non-substitute. Therefore, companies can build competitive advantage through the effective use of strategic resources such as intellectual capital assets (Zeghal & Maaloul, 2010). Research accomplished by Sharabati et al. (2010), Nuryaman (2015), Berzkalne & Zelgalve (2014) and Hejazi et al. (2016) found a significant positive effect of intellectual capital on firm value. Intellectual capital has an important role as a resource in achieving company success (Hejazi et al., 2016). Intellectual capital is one factor in increasing company value (Clarke, Seng, & Whiting, 2011). From the discussion and theory above, the hypotheses proposed in this research are:
Hypothesis 1 (H1): Intellectual capital has a positive effect on company value
Institutional Ownership Structure
Institutional ownership is number of stocks in a company held by institutional investors like banks, insurance companies and pension funds (Chung & Zhang, 2011). Traditionally, institutional investors just simply follow the “Wall street rule” by buying or selling their stocks (Bathala, Moon, & Rao, 2013). In status quo, institutional investors who hold large amount of company stocks bravely speak their voice when they have disgreement, instead following the “Wall Street Rule” (Coffee, 1991). Institutional investors who has large amount of ownership take roles in managing the company. Moreover, institutional ownership is the right corporate governance since institutional investors escalate the monitoring activity towards creditors and management (Chaganti & Damanpour, 1991; Tsai & Gu, 2007) and help to reduce agency problem (Tahir, Saleem, & Arshad, 2015).
Agency theory explains the relationship between the principal (shareholder) and agent (management) (Jensen & Meckling, 1976). Selfish behavior by the management will cause conflicts of interest between management and shareholders which will lead to high agency costs (Alfaraih, Alanezi, & Almujamed, 2012). Institutional investors become the control mechanisms because they have the ability and incentives to monitor and discipline the managers of company (Ping & Wing, 2011). Such supervision can reduce fraud that will be carried out by internal companies that also improve company performance (Kusumawati & Setiawan, 2019).
Stakeholder salient theory also explains that the condition of key shareholders such as institutional ownership, obtaining and using its power exceeds company executives (Neubaum & Zahra, 2006). This strength is in the form of an institution's ability to influence
management decisions (Gedajlovic & Shapiro, 2002). Stakeholders who have a greater voice can influence the company's strategic goals and decisions, including the implementation of intellectual capital as a strategy to improve company performance.
Several studies conducted by Ruiz-mallorquí & Santana-martín (2011), Abukosim et al. (2014), Chen et al. (2014) and Thanatawee (2014) found a positive effect on company value. High institutional ownership structure (majority) becomes the oversight governance of the effectiveness and efficiency of management performance (Abbasi, Kalantari, & Abbasi, 2012; Petta & Tarigan, 2015; Widyati, 2013) and able to influence the governance structure of company actions and corporate activities (Elyasiani & Jia, 2010). Institutional ownership has an impact on boosting the company value. Institutional ownership can also anticipate management decisions that are not in accordance with the interests of the company owner (Abukosim et al., 2014).
Hypothesis 2 (H2): Institutional ownership structure strengthens the influence of intellectual capital on company value.
Research and Methodology
This study is an associative study with a causal goal which is to examine the effect of one variable on another variable. This study uses a positive paradigm that is tested through a quantitative approach. The type of data used in this study is secondary data, i.e. financial reports or annual reports from the official website of the Indonesia Stock Exchange (www.idx.co.id) and the company's website.
The population in this study are all manufacturing companies listed on the Indonesia Stock Exchange from 2014 to 2018. The sampling method uses purposive sampling method. The criteria are (i) Companies that have not changed to other fields in the Indonesian Stock Exchange during the research year; (ii) The company has an IPO on the Indonesia Stock Exchange before January 1, 2014; (iii) the company did not experience delisting on the IDX during the research year; (iv) companies with audited annual reports / financial reports that fully available on the IDX or company’s website during the research year, (v) financial reports / annual reports must provide research data needed for Tobin's Q, IC, ownership structure calculations institutional, leverage and size of the company during the study year, (vi) the company did not experience capital deficiency during the study year and the company obtained positive after-tax profits in the 2014-2018 period to meet the requirements of intellectual capital calculation.
Operational Definition and Variable Measurement
The dependent variable is the company value proxied by Tobin's Q, which is the ratio of the company value in the stock market to the book value of the company's assets (Vazifehdoust, Khajenasir, & Karami, 2014). The measurement formula is as follows:
𝑇𝑜𝑏𝑖𝑛′𝑠 𝑄 = ((𝐶𝑃 𝑥 𝑂𝑆) + 𝑇𝐿 + 𝐼) − 𝐶𝐴
𝑇𝐴 Where:
CP = closing price (the closing price of shares at the end of the year) OS = outstanding share (number of shares available at the end of the year) TL = total liabilities (total liabilities)
I = inventory
CA = current assets (current assets) TA = total assets (total assets)
Intellectual capital as an independent variable was measured by using VAIC by Pulic (1998). VAIC is a combination of 3 (three) components, namely human capital efficiency (HCE), structural capital efficiency (SCE) and capital employed efficiency (CEE). VAIC measurement formula is:
𝑉𝐴𝐼𝐶 = 𝐻𝐶𝐸 + 𝑆𝐶𝐸 + 𝐶𝐸𝐸
The measurement starts with calculating the company's ability to create VA (value added). The measurement is by reducing income (output) and input (cost of goods sold) (Martini, Riama, Wardhani, & Febriani, 2016).
HCE is related to human capital (HC) in the company. HC is very important and becomes a key indicator in the company because it relates to the source of innovation, ability, experience, talent, attitude and behavior of workers (Schiuma, Lerro, & Sanitate, 2008), which are the main drivers of the company. The measurements are:
𝐻𝐶𝐸 = 𝑉𝐴
𝐻𝐶
SCE is related to structural capital (SC). Structural capital covers all the storehouses of non-human knowledge in organizations (Alipour, 2012), for instance include brands, strategies, patents and organizational networks (Clarke et al., 2011). The SC calculation formula is:
𝑆𝐶 = 𝑉𝐴 − 𝐻𝐶
𝑆𝐶𝐸 = 𝑆𝐶 𝑉𝐴
Pulic (1998) explains that IC must be combined with physical and financial capital used, or called capital employed (CE). The CE formula is:
𝐶𝐸 = 𝑇𝑜𝑡𝑎𝑙 𝐴𝑠𝑠𝑒𝑡 − 𝑇𝑜𝑡𝑎𝑙 𝐼𝑛𝑡𝑎𝑛𝑔𝑖𝑏𝑙𝑒 𝐴𝑠𝑠𝑒𝑡𝑠 Calculation of CEE values, namely:
𝐶𝐸𝐸 = 𝑉𝐴
𝐶𝐸
Furthermore, the institutional ownership structure, as a moderating variable in this study, is the total percentage of ownership of other companies (Fajaryani, 2015). High institutional ownership can hinder management's opportunistic actions due to high supervision by investors. Hence, it can reduce agency costs and make management more careful in making decisions (Susilowati et al., 2017). As a result, investor supervision can influence an improvement in company value. The measurement formula of institutional ownership is:
𝐼𝑂 = 𝑛𝑢𝑚𝑏𝑒𝑟 𝑜𝑓 𝑠ℎ𝑎𝑟𝑒𝑠 ℎ𝑒𝑙𝑑 𝑏𝑦 𝑡ℎ𝑒 𝑖𝑛𝑠𝑡𝑖𝑡𝑢𝑡𝑖𝑜𝑛
𝑡𝑜𝑡𝑎𝑙 𝑜𝑢𝑡𝑠𝑡𝑎𝑛𝑑𝑖𝑛𝑔 𝑠ℎ𝑎𝑟𝑒𝑠 𝑥 100%
The control variables in this study are leverage (LEV) and company size (CS). Debt or leverage creates a safety risk to the company. That is because high debt can cause financial distress for companies which results in a decrease in company value (Sujoko & Soebiantoro, 2007). The measurement of leverage can be done by calculating the debt to asset ratio (DAR), which is a ratio that assesses how much debt that finances the company's assets. The higher the value of leverage, the worse the condition of the company and vice versa.
𝐿𝑒𝑣𝑒𝑟𝑎𝑔𝑒 = 𝑇𝑜𝑡𝑎𝑙 𝐷𝑒𝑏𝑡
𝑇𝑜𝑡𝑎𝑙 𝐴𝑠𝑠𝑒𝑡𝑠
On the other side, the large size of the company can provide market power that leads to an upturn in company profits that have an impact on the value of the company (Selvam, Gayathri, Vasanth, Lingaraja, & Marxiaoli, 2016). The total assets are a reflection of all company resources (Dang, Li, & Yang, 2018), both tangible and intangible assets. Company size is measured by the natural log of total assets.
𝑆𝑖𝑧𝑒 = 𝐿𝑜𝑔 𝑇𝑜𝑡𝑎𝑙 𝐴𝑠𝑠𝑒𝑡𝑠
Data Analysis Technique
Data analysis techniques in the study use multiple regression analysis and moderated regression analysis (MRA). Data is processed by using IBM SPSS statistics 21 software. The regression model is as follows:
𝐶𝑉𝑖𝑡= ∝ + 𝛽1𝐼𝐶𝑖𝑡+ 𝛽2𝐿𝐸𝑉𝑖𝑡+ 𝛽3𝐶𝑆𝑖𝑡+ 𝜀𝑖𝑡 ... (Model 1)
𝐶𝑉𝑖𝑡= ∝ + 𝛽4𝐼𝐶𝑖𝑡+ 𝛽5𝐼𝑂𝑖𝑡+ 𝛽6𝐿𝐸𝑉𝑖𝑡+ 𝛽7𝐶𝑆𝑖𝑡 + 𝜀𝑖𝑡 ... (Model 2)
𝐶𝑉𝑖𝑡= ∝ + 𝛽8𝐼𝐶𝑖𝑡+ 𝛽9𝐼𝑂𝑖𝑡+ 𝛽10𝐼𝐶𝑖𝑡∗ 𝐼𝑂𝑖𝑡+ 𝛽11𝐿𝐸𝑉𝑖𝑡+ 𝛽12𝐶𝑆𝑖𝑡 + 𝜀𝑖𝑡 ... (Model 3)
Where:
𝐶𝑉𝑖𝑡 = Company Value (Tobin's Q) i in period t
∝ = Constant
𝛽 = Regression Coefficient
𝐼𝐶𝑖𝑡 = Company Intellectual Capital (VAIC) i in period t
𝐼𝑂𝑖𝑡 = Institutional Ownership Structure i in period t
IC*IO = Interaction of Intellectual Capital and Institutional Ownership Structure
𝐿𝐸𝑉 = Debt owned by a company, measured by debt to equity ratio 𝐶𝑆 = firm size measured by the natural log of total assets
There are 4 (four) tests in this study, namely: (1) descriptive statistics; (2) classical assumption test consisting of normality test, multicollinearity test, and heteroscedasticity test; (3) goodness of fit model test that is by measuring the coefficient of determination (R2) and statistical value F; (4) hypothesis testing.
Research and Methodology
Total of manufacturing companies listed in Indonesia Stock Exchange are 144 companies. After selecting the sample by using purposive sampling method, the number of samples obtained in this study are 67 companies with a total of 335 observations (67 companies times by five years of the research period, namely 2014-2018). The observation data is calculated by using SPSS 21 tool.
Table 1 demonstrates the statistical outputs of a sample of public companies. The average value of all variables is greater than the standard deviation value. It means that there is no data that has extreme value in this study.
Table 1: Descriptive Statistical Result
Variable Number (N) Percentage (%) Minimum Maximum Average Deviation
Standard CV 335 100% -0,12 31,20 1,9298 0,23546 IC 335 100% 1,05 10,52 2,7676 1,43884 LEV 335 100% 0,02 0,89 0,4158 0,18023 CS 335 100% 10,38 14,54 12,4617 0,74754 IO 335 100% 0,00 0,98 0,6587 0,21248 Information:
CV = Company Value (Tobin’s Q) IC = Intellectual Capital (VAIC) IO = Institutional Ownership LEV = Leverage (debt to equity ratio) CS = Company Size (Log Total Assets) Source:SPSS Output
Classical Assumption Test
The first classical assumptions test results indicated abnormal data symptoms, multicollinearity and heteroscedasticity. Therefore, the outlier data in the sample was removed so that the final sample in this study becomes 301 samples, which then the data are transformed.
Normality Test
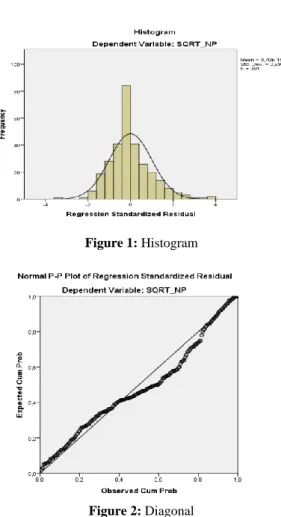
The results of the normality test carried out by the analysis method of the histogram diagram and the diagonal graph in the study are shown in Figure 2 and Figure 3, respectively.
The histogram diagram (Figure 2) forms rounderd normal curve. It means that the residual value is normal and normality assumtion is met. The Diagonal Graph shows the points following and approaching the diagonal line. It means that the data meet the assumption of normality.
Figure 1: Histogram
Figure 2: Diagonal
The Diagonal Graph (Figure 2) demonstrates that the points are in line and follow the diagonal line. It means that the data are normality distributed and it meets the assumption of normality.
Multicollinearity Test
The multicollinearity test results in Table 2 below shows that the Variance of Inflation Factors (VIF) is less than 10 and the tolerance value is greater than 0.10. It indicates that the regression model is free from multicollinearity symptoms.
Table 2: Multicollinearity Test
Variable Model 1 Model 2 Model 3
Results Tolerance VIF Tolerance VIF Tolerance VIF
IC 0,756 1,323 0,756 1,324 0,262 3,812 No Multicollinearity occurs
IO 0,993 1,007 0,213 4,688 No Multicollinearity occurs
IC*IO 0,136 7,358 No Multicollinearity occurs
LEV 0,874 1,144 0,871 1,149 0,870 1,149 No Multicollinearity occurs
CS 0,833 1,200 0,831 1,204 0,785 1,275 No Multicollinearity occurs
Source:SPSS Output
Heteroscedasticity Test
The results of the heteroscedasticity test in the form of Scatterplot Pattern in Figure 4 illustrates that the dots do not form a certain pattern, but spread above and below zero on the Y axis. It means that the data are free from the heteroscedasticity symptoms.
Figure 3: Scatterplot Pattern.
Goodness of Fit Model
Goodness of fit model consists of 2 (two) measurements, they are coefficient determination test (adjusted R2) and F test and its results
can be seen in Table 3 below.
Table 3: Goodness of Fit Model
Variable Model 1 Model 2 Model 3
F value Adjusted R2 36,455** 0,262 27,514** 0,261 21,942** 0,259 Information: ** ρ < 0,01, * ρ < 0,05
Note: Dependent Variable: Company Value (CV) Source:SPSS Output
Based on Table 3, the adjusted R2 values in model 1, 2 and 3, respectively are 26.2%, 26.1% and 25.9%. It means that the variables
used in the study successfully explain the dependent variable. According to model 3, it means that the variable of intellectual capital, institutional ownership structure, the interaction variable between intellectual capital and institutional ownership structure, leverage and company size successfully influence financial performance as much as 25,9%, while the remaining of 74.1% is explained by other variables that are not included in this study.
F test results on Table 3 demonstrates that each research model has a significance level less than 1%. It indicates that the variable intellectual capital, institutional ownership structure, the interaction variable between intellectual capital and institutional ownership structure, leverage and size of the company significantly influence company value (Tobin's Q).
Hypothesis Testing
The hypothesis testing in this study is using multiple regression analysis and moderated regression analysis (MRA). The result of the regression analysis that has passed the classical assumption test is demonstrated in Table 4.
Table 4: Results of Regression Analysis
Variable Coefficient and (t-value)
Model 1 Model 2 Model 3
IC 0,597** (6,797) 0,595** (6,774) 0,578** (3,868) IO 0,190 (0,879) 0,129 (0,278) IC*IO -0,021 (-0,145) LEV -0,486** (-2,470) -0,497** (-2,519) -0,498** (-2,518) CS 0,862** (2,965) 0,877** (3,010) 0,867** (2,887) Information: ** ρ < 0,01, * ρ < 0,05
Note: Dependent Variable: Company Value (CV) Source: SPSS Output
According to Table 4, the formula that is formed on each model is as follows: Model 1: 𝐶𝑉 = −2,610 + 0,597𝐼𝐶 − 0,486𝐿𝐸𝑉 + 0,862𝐶𝑆
Model 2: 𝐶𝑉 = −2,807 + 0,595𝐼𝐶𝑖𝑡+ 0,190𝐼𝑂𝑖𝑡− 0,497𝐿𝐸𝑉𝑖𝑡+ 0,877𝐶𝑆𝑖𝑡
Model 3: 𝐶𝑉 = −2,6788 + 0,578𝐼𝐶𝑖𝑡+ 0,129𝐼𝑂𝑖𝑡− 0,021𝐼𝐶𝑖𝑡∗ 𝐼𝑂𝑖𝑡− 0,498𝐿𝐸𝑉𝑖𝑡− 0,867𝐶𝑆𝑖𝑡
The results of hypothesis test in Table 4 show that the coefficient of intellectual capital is 0.597. it means that in and its significance level is on the level of 1%. It indicates that this study support the hypothesis 1 (H1), intellectual capital affects company value (Tobin's
Q). The results of the hypothesis test in Table 4 also illustrates that the institutional ownership (IO) has a coefficient of 0,190 when it acts as an independent variable. It also has a coefficient of -0,021 when it becomes a moderating variable by being interacted with intellectual capital. The sign of the coefficient changes from positive into a negative. It indicates that institutional ownership as a moderating variable creates negative effect on company value, not a positive effect. Then, either as independent variable or as a moderating variable, institutional ownership does not have a significant effect, neither in the level of 1% nor 5%, on company value. It means that the second hypothesis (H2) of this research is not supported, institutional ownership cannot strengthen the effect of
intellectual capital on company value.
Results and Discussions
According to the regression analysis test, there is a support on hypothesis 1 that intellectual affects company value. The results of this research supports the resource based theory which states that intellectual capital can increase company value. Intellectual capital, as a strategic resource for companies, provide value added to the company. This value added that is attached to intellectual capital is created from four components, namely, cannot be imitated, rare, valuable and non-substitutable. Those components also creates competitive advantage for companies. The results of this study also support previous research conducted by (Berzkalne & Zelgalve, 2014; Hejazi et al., 2016; Nimtrakoon, 2015; Nuryaman, 2015; Sharabati et al., 2010), regarding the influence of intellectual capital towards company value. Apparently, Intellectual capital has a positive effect to the value of the manufacturing company which is valued by Tobin's Q.
On the other side, this research does not support the agency theory that the structure of institutional ownership can be a control mechanism to solve agency problems because all management activities will be overseen by the institution (Damayanti & Suartana, 2014). This research also does not support stakeholder salient theory which states that institutions have the power to influence corporate objectives of management decisions and corporate strategic decisions (Gedajlovic & Shapiro, 2002). Furthermore, the study also contradicts with the research of Abukosim et al. (2014), Ruiz-mallorquí & Santana-martín (2011), Thanatawee (2014) which stated that institutional ownership structure has a significant positive effect on company value. As a moderating variable, it means that the institutional ownership variable cannot strengthen the value of the company. Even so, the findings of this study are similar with the research outputs conducted by Mollah & Farooque (2012) and Rini, Sutrisno, & Nurkholis (2017) that institutional
ownership has no effect on firm value. Institutional ownership can function as a supervisor for management performance (Rini et al., 2017), but not in decision making for companies including the implementation of intellectual capital as a company strategy. Elyasiani & Jia (2010) stated that institutional ownership consists of three roles in the company, namely as active supervisors, passive supervisors and cooperating with management to "dredge" minority shareholders. In the first scenario, management has incentives and the ability to oversee management and has the power to influence management actions. The second scenario is that institutional shareholders only work as "traders", holding or selling shares based on portfolio requirements, rather than intervening in management governance. This makes the institutional ownership has no influence on the value of the company. The third scenario is the negative effect of ownership of institutions that work with management by carrying out activities that have a negative impact on the value of the company. Institutional investors only work traditionally to buy, hold or sell their stocks (Bathala et al., 2013). Institutional investors are more interested in getting dividends or profits from the investments in certain periods without any regard to the future growth of the company value (Rini et al., 2017). Thus, the findings of this study indicate that institutional investors in Indonesia’s manufacturing companies only act as "traders", so that it does not directly influence the creation of company value.
Conclusions
Company value of manufacturing companies in Indonesia during the year of 2014-2019 can be elevated by using Intellectual capital. Unfortunately, institutional ownership structure as the corporate governance does not have any influence towards company value. Overall, the outputs show that company value is only affected by intellectual capital but not affected by institutional ownership. This study contributes theoretically on resource based theory. There are also several practical contributions of this study: i) for companies, they have to use intellectual capital as a strategy to enhance their company value and institutional ownership cannot be considered as corporate governance to boost up company value, ii) for investors, they can consider intellectual capital as an aspect of valuation to invest their money, iii) for regulators, they should make clear regulations about the intellectual capital disclosures since it has importance factor in enhancing company value.
References
Abbasi, M., Kalantari, E., & Abbasi, H. (2012). Impact of Corporate Governance Mechanisms on Firm Value Evidence from the Food Industry of Iran Corporate Governance. Journal of Basic and AApplied Scientific Research, 2(5), 4712–4721.
Abukosim, Mukhtaruddin, Ferina, I. S., & Nurcahaya, C. (2014). Ownership Structure and Firm Values: Empirical Study on Indonesia Manufacturing Listed Companies. International Refereed Research Journal, V(4), 1–14.
Alfaraih, M., Alanezi, F., & Almujamed, H. (2012). The Influence of Institutional and Government Ownership on Firm Performance : Evidence from Kuwait. International Business Research, 5(10), 192–200. https://doi.org/10.5539/ibr.v5n10p192
Alipour, M. (2012). The effect of intellectual capital on firm performance: An investigation of Iran insurance companies. Measuring
Business Excellence, 16(1), 53–66. https://doi.org/10.1108/13683041211204671
Andriessen, D. (2004). IC valuation and measurement: classifying the state of the art. Journal of Intellectual Capital, 5(2), 230–242. https://doi.org/10.1108/14691930410533669
Barney, J. (1991). Firm Resources and Sustained Competitive Advantage. Journal of Management, 17(1), 99–120. https://doi.org/10.1177/014920639101700108
Bathala, C. T., Moon, K. P., & Rao, R. P. (2013). Policy , Ownership , Managerial Impact of Institutional Holdings : An Perspective.
Financial Management, 23(3), 38–50. https://doi.org/http://dx.doi.org/10.2307/3665620
Bchini, B. (2015). Intellectual Capital and Value Creation in the Tunisian Manufacturing Companies. Procedia Economics and
Finance, 23(October 2014), 783–791. https://doi.org/10.1016/s2212-5671(15)00443-8
Berzkalne, I., & Zelgalve, E. (2014). Intellectual capital and company value. Procedia - Social and Behavioral Sciences, 110, 887– 896. https://doi.org/10.1016/j.sbspro.2013.12.934
Chaganti, R., & Damanpour, F. (1991). Institutional ownership, capital structure, and firm performance. Strategic Management
Journal, 12, 479–491. https://doi.org/https://doi.org/10.1002/smj.4250120702
Chen, J., Blenman, L., & Chen, D.-H. (2014). Does Institutional Ownership Create Values ? The New Zealand Case. Quarterly
Journal of Finance and Accounting, 47(4), 109–124.
Chung, K. H., & Zhang, H. (2011). Corporate governance and institutional ownership. Journal of Financial and Quantitative
Analysis, 46(1), 247–273. https://doi.org/10.1017/S0022109010000682
Clarke, M., Seng, D., & Whiting, R. H. (2011). Intellectual capital and firm performance in Australia. Journal of Intellectual Capital, 12(4), 505–530. https://doi.org/10.1108/14691931111181706
Coffee, J. C. (1991). Liquidity Versus Control : The Institutional Investor as Corporate Monitor. Columbia Law Review, 91(6), 1277– 1368. Retrieved from https://scholarship.law.columbia.edu/faculty_scholarship/28/
Damayanti, N. P. W. P., & Suartana, I. W. (2014). Pengaruh Kepemilikan Manajerial dan Kepemilikan Institusional pada Nilai Perusahaan. E-Jurnal Akuntansi Universitas Udayana, 9(3), 575–590.
Dang, C., Li, Z. (Frank), & Yang, C. (2018). Measuring firm size in empirical corporate finance. Journal of Banking and Finance, 86, 159–176. https://doi.org/10.1016/j.jbankfin.2017.09.006
Capital, 17(1), 168–184. https://doi.org/10.1108/JIC-08-2015-0072
Elyasiani, E., & Jia, J. (2010). Distribution of institutional ownership and corporate firm performance. Journal of Banking and
Finance, 34(3), 606–620. https://doi.org/10.1016/j.jbankfin.2009.08.018
Fajaryani, A. (2015). Analisis Faktor-Faktor yang Mempengaruhi Integritas Laporan Keuangan (Studi Empiris pada Perusahaan Pertambangan yang Terdaftar di Bursa Efek Indonesia Periode 2008-2013). Jurnal Nominal, IV(1), 67–82. https://doi.org/10.21831/nominal.v4i1.6888
Feimianti, E., & Anantadjaya, S. P. (2015). Value Creation of Intellectual Capital : Financial Performance Analyses in Indonesian Publicly- Listed Consumer Goods Industry. Review of Integrative Business & Economics Research, 3(1), 99–113.
Gedajlovic, E., & Shapiro, D. M. (2002). Ownership Structure and Firm Profitability in Japan. Academy of Management Journal, 45(2), 565–575.
Guthrie, J., Ricceri, F., & Dumay, J. (2012). Reflections and projections : A decade of Intellectual Capital Accounting. The British
Accounting Review, 44(2), 68–82. https://doi.org/10.1016/j.bar.2012.03.004
Hejazi, R., Ghanbari, M., & Alipour, M. (2016). Intellectual, Human and Structural Capital Effects on Firm Performance as Measured by Tobin’s Q. Knowledge and Process Management, 23(4), 259–273. https://doi.org/10.1002/kpm.1529
Husnah, H., Subroto, B., Aisjah, S., & Djumahir. (2013). Intangible Assets, Competitive Strategy And Financial Performance: Study On Rattan SMEs In Palu City Of Central Sulawesi (Indonesia). IOSR Journal of Business and Management, 7(4), 14–27. https://doi.org/10.9790/487x-0741427
Iranmahd, M., Moeinaddin, M., Shahmoradi, N., & Heyrani, F. (2014). The Effect of Intellectual Capital on Cost of Finance and Firm Value. International Journal of Academic Research in Accounting, Finance and Management Sciences, 4(2), 1–8. https://doi.org/10.6007/IJARAFMS/v4-i2/724
Ismail, K. N. I. K., & Karem, M. A. (2011). Intellectual Capital and the Financial Performance of Banks in Bahrain Intellectual Capital and the Financial Performance of Banks in. Journal of Business Management and Accounting, 1(1), 63–77.
Jensen, M. C., & Meckling, W. H. (1976). Theory of The Firm: Managerial Behavior, Agency Costs and Ownership Structure.
Journal of Financial Economics, 3, 305–360.
Kusumawati, E., & Setiawan, A. (2019). The Effect of Managerial Ownership , Institutional Ownership , Company Growth , Liquidity , and Profitability on Company Value. Jurnal Riset Akuntansi Dan Keuangan Indonesia, 4(2), 36–46.
Martini, R., Riama, L. V., Wardhani, R. S., & Febriani, M. (2016). Effect of Intellectual Capital To Return on Equity (Study on Consumer Goods Industry Listed in Indonesia Stock Exchange). International Journal of Business, Accounting and
Management, 1(2), 2527–3531. Retrieved from www.doarj.orgwww.doarj.org
Mehralian, G., Rajabzadeh, A., & Rasekh, H. R. (2012). Intellectual capital and corporate performance in Iranian pharmaceutical industry. Journal of Intellectual Capital, 13(1), 138–158. https://doi.org/10.1108/14691931211196259
Mollah, S., & Farooque, O. Al. (2012). Ownership structure, corporate governance and firm performance Evidence from an African Emerging Market. Studies in Economics and Finance, 29(4), 301–319. https://doi.org/10.1108/10867371211266937 Neubaum, D. O., & Zahra, S. A. (2006). Institutional Ownership and Corporate Social Performance: The Moderating Effects of
Investment Horizon, Activism, and Coordination. Journal of Management, 32(1), 108–131. https://doi.org/10.1177/0149206305277797
Nimtrakoon, S. (2015). The relationship between intellectual capital, firms’ market value and financial performance: Empirical evidence from the ASEAN. Journal of Intellectual Capital, 16(3), 587–618. https://doi.org/10.1108/JIC-09-2014-0104 Nuryaman. (2015). The Influence of Intellectual Capital on The Firm ’ s Value with The Financial Performance as Intervening
Variable. Procedia - Social and Behavioral Sciences, 211, 292–298. https://doi.org/10.1016/j.sbspro.2015.11.037
Petta, B. C., & Tarigan, J. (2015). Pengaruh Kepemilikan Institusional terhadap Kinerja Keuangan Melalui Struktur Modal sebagai Variabel Intervening pada Perusahaan Manufaktur yang Terdaftar dalam Bursa Efek Indonesia. Business Accounting Review, 5(2), 625–634.
Ping, Z., & Wing, A. C. W. (2011). Corporate Governance : A Summary Review on Different Theory Approaches. International
Research Journal of Finance and Economics, (68), 7–13.
Pulic, A. (1998). Measuring the Performance of Intellectual Potential in Knowledge Economy. Presented in 1998 at the 2nd
McMaster World Congress on Measuring and Managing Intellectual Capital by the Austrian Team for Intellectual Potential,
1–20.
Rini, I. S., Sutrisno, T., & Nurkholis. (2017). The Effect of Ownership Structure on Firm Value with Investment Decision as Intervening Variable (Empirical Study of the Listed Companies in Indonesia Stock Exchange Period 2008-2014). International
Journal of Social and Local Economic Governance, 3(2), 99–110.
Ruiz-mallorquí, M. V., & Santana-martín, D. J. (2011). Dominant institutional owners and firm value. Journal of Banking & Finance, 35, 118–129. https://doi.org/10.1016/j.jbankfin.2010.07.020
Schiuma, G., Lerro, A., & Sanitate, D. (2008). The intellectual capital dimensions of Ducati’s turnaround: Exploring knowledge assets grounding a change management program. International Journal of Innovation Management, 12(2), 161–193. https://doi.org/10.1142/S1363919608001935
Selvam, M., Gayathri, J., Vasanth, V., Lingaraja, K., & Marxiaoli, S. (2016). Determinants of Firm Performance: A Subjective Model. International Journal of Social Science Studies, 4(7), 90–100. https://doi.org/10.11114/ijsss.v4i7.1662
Information Technology Industry in India. Asia-Pacific Journal of Management Research and Innovation, 9(1), 55–62. https://doi.org/10.1177/2319510X13483512
Sharabati, A. A., Jawad, S. N., & Bontis, N. (2010). Intellectual capital and business performance in the pharmaceutical sector of Jordan. Management Decision, 48(1), 105–131. https://doi.org/10.1108/00251741011014481
Shleifer, A., & Vishny, R. W. (1997). A Survey of Corporate Governance. The Journal of Finance, 52(2), 737–783. https://doi.org/10.1111/j.1540-6261.1997.tb04820.x
Subaida, I., Nurkholis, N., & Mardiati, E. (2018). Effect of Intellectual Capital and Intellectual Capital Disclosure on Firm Value.
Jurnal Aplikasi Manajemen, 16(1), 125–135. https://doi.org/10.21776/ub.jam.2018.016.01.15
Sujoko, & Soebiantoro, U. (2007). Pengaruh Struktur Kepemilikan Saham , Leverage , Faktor Intern Dan Faktor Ekstern Terhadap Nilai Perusahaan (Studi empirik pada perusahaan manufaktur dan non manufaktur di Bursa Efek Jakarta). Jurusan Ekonomi
Manajemen, 9(1), 41–48.
Susilowati, Y., Puspitasari, E., & Yuseno, A. (2017). The Influence of Institutional Ownership, Independent Commissioner, Audit Committee, Firm Size and Leverage to Integrity of Financial Statement on Manufacturers Listed in Indonesia Stock Exchange.
The Sixth International Conference on Entrepreneurship and Business Management, 550–554. Hanoi.
Tahir, S. H., Saleem, M., & Arshad, H. (2015). Institutional Ownership and Corporate Value : Evidence From Karachi Stock Exchange ( KSE ) 30-Index Pakistan. Praktični Menadžment, 6(1), 41–49.
Thanatawee, Y. (2014). Institutional Ownership and Firm Value in Thailand. Asian Journal of Business and Accounting, 7(2), 1–22. Tsai, H., & Gu, Z. (2007). The relationship between institutional ownership and casino firm performance. Hospitality Management,
26, 517–530. https://doi.org/10.1016/j.ijhm.2006.02.003
Vazifehdoust, H., Khajenasir, M. R., & Karami, H. (2014). A study on the effect of intellectual capital on firm performance: Evidence from Tehran Stock Exchange. Management Science Letters, 4, 559-–566.
Widyati, M. F. (2013). Pengaruh Dewan Direksi, Komisaris Independen, Komite Audit, Kepemilikan Manajerial dan Kepemilikan Institusional terhadap Kinerja Keuangan. Jurnal Ilmu Manajemen, 1(1), 234–249.
Zeghal, D., & Maaloul, A. (2010). Analysing value added as an Analysing indicator of intellectual capital and its consequences on company. Journal of Intellectual Capital, 11(1), 39–60. https://doi.org/10.1108/14691931011013325