e-ISSN: 2278-067X, p-ISSN: 2278-800X, www.ijerd.com
Volume 6, Issue 6 (March 2013), PP. 10-15
Turbidity Removal from Water by Electrical Method
Mr. Hazhar M. Aziz
1, Prof. R.A.Joshi
21Institute of Environment Education and Research Bharati Vidyapeeth University, Katraj Dhankawadi,
Pune 43
2
Guide Prof.R.A joshi (V.I.T. Vishwakarma institute of technology
Abstract:- There is a need of more cost-effective methods to purify a wide range of polluted water on-site, and with minimal additives that are required for sustainable water management. Electrolytic treatment of wastewater presents an innovative technology in which a sacrificial metal anode and cathode produce electrically active coagulants and tiny bubbles of hydrogen and oxygen in water. Present study was done to know turbidity removal from water by electrical method and satisfying objective ―cost effectiveness’. Study reveals that applying low voltage for longer period is more beneficial in turbidity removal. Application of higher voltage also remove the turbidity but not effective as lower voltage for longer time span. Higher voltage also increase the treatment cost so lower voltage for longer time span will be effective and cost benefit will be advantage.
Key words:- electrolysis, voltage, turbidity.
I.
INTRODUCTION
Water is a very limited natural resource and in many cases there is not enough supply of water of appropriate quality for industrial and domestic use. Many pollutants in water streams have been identified as harmful and toxic to the environment and human health. Strategies for ecological protection generally include the development of new or improved industrial processes that have no or minor effects on nature, and of processes for the treatment of inevitable waste. The tendency of the cost of water to increase, and the higher cost of effluent treatment due to the new restrictions on its discharge to the environment have induced industries to adopt programmes aiming at the minimization of water consumption and favouring the development of new methodologies for the optimization of these resources [1].
As the rivers, lakes and other water bodies are being continuously polluted and the potable water supply is insufficient in many places, there is an urgent need to develop more effective, innovative and inexpensive techniques for the treatment of wastewater. Conventional treatments of wastewater containing organic and inorganic compounds by coagulation and flocculation have been used for decades to destabilize the colloidal substances. In these processes, aluminum sulfate, ferrous sulfate, and ferric chloride have been used as coagulating agents and other additives (e.g. polyelectrolyte) are dosed to produce larger aggregates which can be separated physically. These are multi-stage processes that need repetitive supply of chemicals and extensive land area. There is a need of more cost-effective methods to purify a wide range of polluted water on-site, and with minimal additives that are required for sustainable water management. Electrolytic treatment of wastewater presents an innovative technology in which a sacrificial metal anode and cathode produce electrically active coagulants and tiny bubbles of hydrogen and oxygen in water.
The ―Electrolysis‖ literally means to break substances apart by using electricity. Michael Faraday first formulated the principle of electrolysis in 1820. The process occurs in an electrolyte, a watery or a salt melting solution that gives a possibility to transfer the ions between two electrodes. When an electrical current is applied, the positive ions move to the cathode while the negative ions move to the anode. At the electrodes, the cations are reduced and the anions will be oxidized. Environmentally oriented electrochemistry is more and more asked for pollution abatement of wastewater and reclaiming the requirement of discharge or permissible limit of wastewater. Under these circumstances an electrochemical treatment is an emerging technology with many applications in which a variety of unwanted dissolved toxic chemicals and microorganisms can be effectively removed from wastewater.
II.
MATERIALS AND METHODS
1.1 Turbid water preparation
as NTU before and after electrolysis by using the Nephelometer.All analyses were made done according to the standard methods.
Three sets of turbid water were prepared for the experimental set-up 1) 300 NTU
2) 350 NTU 3) 400 NTU
1.2 Experimental Set-up and Measurements
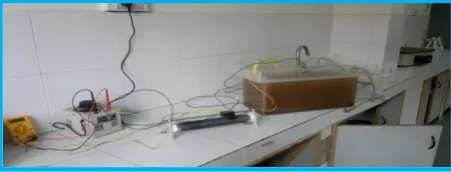
In these experiments, the electrochemical cell consisted of a 2 liter container and two series electrodes. Aluminum, iron and stainless steel plates (15.0 x 4.0 cm) were used as electrodes. They were treated with the solution of HCl (15%Wt.) for cleaning prior to use. The beaker was filled with 2 liter ml of sample turbid water, (pH=7.5), and the electrode plates were held suspended 2 cm apart in the water. The electrodes arrangement consisted of three cathodes interspersed with three anodes connected by brass rods to each other arranged as a parallel electrode plates. Experiments were done similarly via the same electrolyzes time, electrodes distance and voltage intensity for all types of electrodes. To evaluate the direct current effect on turbidity removal, the samples were exposed to different voltage combination and specific time interval. Primary turbidity measurement was done and then samples were exposed to specific voltage and there given switch off time of 10 min each then measurement of turbidity is carried out with help of turbidity meter.
In each run pH and EC were measured. Power was supplied to the electrodes with a DC Power Supply. A magnetic stirrer was used for stirring. Cell current and voltage were measured using Ammeter and Voltmeter. All experiments were conducted at ambient temperature (nominally 20°C). The experimental set-up as shown in fig.
1.3 Literature
A detailed study was carried out to collect baseline information related to various work done on the subject, methodology used and what were their observations. It includes review of books, journals, websites and magazines to understand the present status of work on Turbidity Removal from Water by Electrical Method. This step provided a general framework and basic knowledge for further research into the topic and also helps in the identification of techniques and equipments appropriate for investigation.
1.4 Analysis
Analysis of all above mentioned parameters done in BVIEER laboratory. 1.5 Data analysis and interpretation:
Collected data is statistically and graphically analyzed. This analysis was used for interpretation for drawing out conclusion.
1.6 Conclusions:
Analysis of data collected and information gathered helped to draw conclusion.
1.7 Suggestions:
Based on this study general conclusion drawn has reviewed with a view of drawing certain suggestions.
III.
RESULT AND DISCUSSION
were excluded from PMC Limits and the total area under the PMC’s jurisdiction remained around 243 km2
alongwith old area. There are several reports on the increase turbidity in treated water. In Most of the cities drinking water has impurities in form of turbidity. Electrolysis is cost effective treatment to remove turbidity.
Graph 1: Voltage Vs Turbidity (initial turbidity 300 NTU)
Interpretation:
Water sample with initial turbidity 300 NTU were treated by applying voltage of 20, 40, 60, 80 and 100 for 5 minutes with switch off time 10 minutes. There is gradual decrease in turbidity from 300 NTU to 12 NTU. For the total time span of 1 hours 15 minutes remaining turbidity was 12 NTU.
Graph 2: Voltage Vs Turbidity (initial turbidity 350 NTU)
Interpretation:
Water sample with initial turbidity 350 NTU were treated by applying voltage of 20, 40, 60, 80 and 100 for 5 minutes with switch off time 10 minutes. There is gradual decrease in turbidity from 350 NTU to 21 NTU. For the total time span of 1 hours 15 minutes remaining turbidity was 21 NTU.
Graph 3: Voltage Vs Turbidity (initial turbidity 400 NTU)
Interpretation:
Graph 4: Voltage Vs Turbidity (initial turbidity 300 NTU)
Interpretation:
Water sample with initial turbidity 350 NTU were treated by applying voltage of 5, 10, 15, 20… upto 50 for 5 minutes with switch off time 10 minutes. There is gradual decrease in turbidity from 350 NTU to 4.3 NTU. For the total time span of 2 hours 30 minutes remaining turbidity was 4.3 NTU.
Graph 4: Voltage Vs Turbidity (initial turbidity 450 NTU)
Interpretation:
Water sample with initial turbidity 450 NTU were treated by applying voltage of 5, 10, 15, 20… upto 50 for 5 minutes with switch off time 10 minutes. There is gradual decrease in turbidity from 450 NTU to 9.7 NTU. For the total time span of 2 hours 30 minutes remaining turbidity was 9.7 NTU.
Graph 4: Voltage Vs Turbidity (initial turbidity 300 NTU)
Interpretation:
Water sample with initial turbidity 300 NTU were treated by applying voltage of 10, 20, 30, 40… upto 100 for 5 minutes with switch off time 10 minutes. There is gradual decrease in turbidity from 300 NTU to 5.3 NTU. For the total time span of 2 hours 30 minutes remaining turbidity was 5.3 NTU.
Interpretation:
Water sample with initial turbidity 300 NTU were treated without applying voltage. There is gradual decrease in turbidity from 300 NTU to 22 NTU for the time interval of 15, 30, 45.. upto 75 and total time span of 1 hours 15 minutes remaining turbidity was 22 NTU.
IV.
CONCLUSIONS
From all above observation it reveals that applying low voltage for longer period is more beneficial in turbidity removal. Application of higher voltage also remove the turbidity but not effective as lower voltage for longer time span. Higher voltage will increase the treatment cost so lower voltage for longer time span will be effective and cost benefit will be advantage.
The operating cost of electrocoagulation mainly consists of the cost of power and cost of materials i.e. consumption cost of aluminium electrodes. For cost calculation the average applied electric voltage on the cell VAF (Voltmeter reading across the electrocoagulation cell) and current, I, measured from time to time minutes, which was 1.73 KWh for 7200 l.per hour discharge. Assuming an energy price of Rs 1.50/Kwh, the consumption of pure aluminium is 8mg/litre. and consumable aluminium electrode material cost is Rs 100/- per kg, the operating cost can be calculated as Operating cost in rupees per hr = 1.5 x E x 1hr + Cost of Aluminium consumption = 1.5 X 1.73 X 1+0.6 = 3.195 Therefore, the cost per 1000 litres of water = Rs 0.44 only.
The cost of chemical treatment of the same water as per chemical consumption of conventional plant — alum 100 mg/litre and lime 50 mg/litre is as follows:
Requirement of alum for 1000 litres is 100 grams. And that of lime is 50 gmams. If the cost of alum is Rs 6/= and lime is 10/= per kg is .6/= 10/= respectively, the total chemical cost for 100 mg/litre water = cost 100 grams of alum + cost 50 grams of lime = Re. 0.06 + 0.5 = Re. 1.1 It will be seen that for small water treatment plants the electrocoagulation should be cheaper.
REFERENCES
[1] U. S.M.A Guelli Souza, A.R. Melo, A.A. Ulson de Souza. Resources Conservation and Recycling, 2006, 49:1–13.
[2] X. Chen, G. Chen, P.L. Yue. Chemical Engineering Science, 2002, 57: 2449 – 2455. [3] C. Feng, N. Sugiura S. Shimada, T. Maekawa. J. Hazard. Mater. B., 2003, 103: 65-78. [4] D. Bejan, F. Sagitova, N.J. Bunce. Journal of Applied Electrochemistry, 2005,35:897–902. [5] S.H. Lin, C.T. Shyu, M.C. Sun. Water Res., 1998, 32: 1059 – 1066.
[6] V.P. Malkin; Chemical and Petroleum Engineering, 2003, 39:1–2.
[7] Y.S. Perng, E.I.C. Wang, S.T. Yu, A.Y. Chang, C.Y. Shih. Water. Qual. Res. J. Canada,2007, 42: 63-71.
[8] EC Pacific Pty Limited, Evaluation of a full-scale electro-coagulation process for abattoireffluent treatment. Meat and Livestock Australia Locked Bag 991 North Sydney NSW 2059.,ISBN 174 0361 474 :2003.
[9] K.Rajeshwar, J. Ibanez; In: Tarr, Matthew A. (Ed.), Chemical Degradation Methods for Wastes and Pollutants. Academic USA Press pp 720 1997.
[10] M.J. Mattesn, R.L. Dobson, R.W. Glenn, N.S. Kukunoor, W.H. Waits, E.J. Clayfield. Coll. Surf. Part A Physicochem. Eng. Aspects.,1995, 104 :101–109.
[11] X. Chen, G. Chen, P. L. Yue; Sep. Purif. Technol., 2000, 19: 65–69.
[14] M. Murugananthan, R.G. Bhaskar, S. Prabhakar. Sep. Purif. Technol., 2004, 40: 69–75. [15] P.K. Holt, G.W. Barton, C.A. Mitchell. Chemosphere, 2005, 59: 355-367.
[16] G.B. Raju, Khangaonkar; Trans. Indian Inst., Metals.,1984, 37: 59–66. [17] C. Llerena, J.C.K. Ho, D.L. Piron. Chem. Eng. Commun.,1996, 155: 217–228. [18] J. Park, Y. Jung, M. Han, S. Lee. Water Sci. Technol., 2002, 46: 225–230.
[19] R. G. Casqueira, M. L. Torem, H.M. Kohlerl. Minerals Engineering, 2006, 19: 1388–1392. [20] L. Ben Mansur, S. Chalbi. Journal of Applied Electrochemistry, 2006, 36: 577-581.
[21] F. N. B. Nahui, M. R. Nascimento, E. B. Cavalcanti, E. O. Vilar. Brazilian Journal ofChemical Engineering, 2008, 25: 435 – 442.
[22] L. Joffe, L. Knieper. Industrial Wastewater, 2000, 5: 1–5.
[23] M.G. Cora, Y.T. Hung. Int. J. Environmental Engineering.,2009, 1: 3–19.
[24] E.M. Kaliniichuk, II. Vasilenko V.Y. Shchepanyuk, N.A. Sukhoverkhova, I.A. Makarov.Int. Chem. Eng., 1976, 16: 434–435
[25] V.A. Kolesnikov, S.A. Kokarev, S.O. Varaksin, I.M. Kodintsev. Elektrokhimiya, 1989, 25:1265–1267. [26] M.F. Pouet, F. Persin. Water Sci. Technol., 1992, 25: 247–253.
[27] M.F. Pouet, A. Grasmick. Water Sci. Technol., 1995, 31: 275–283. [28] J. Ibanez, M.M. Singh, Z. Szafran. J. Chem. Educat., 1998, 75: 1040–1041.
[29] P.K. Holt, G.W. Barton, M. Wark, C.A. Mitchell. Coll. Surf. Part APhysicochem. Eng.Aspects.,2002, 211: 233–248.
[30] M. Emamjomeh Mohammad, SivakumarMuttucumaru. Journal of Environmental Management, 2009, 90:1663-1679.
[31] M. Kobya, E. Demirbasb, A. Dedelia, M.T. Sensoya. Journal J. Hazard.Mater.,2010, 173:326–334. [32] A. Alinsafi, M. Khemis, M.N. Pons, J.P. Leclerc, A. Yaacoubi, A. Benhammou, A.,
Nejmeddine.Chemical Engineering and Processing.,2005, 44: 461–470
[33] T. Picard, G. Cathalifaud-Feuillade, M. Mazet, C. Vandensteendam, J. Environ. Monit.,20002: 77–80. [34] A. Gurses, M. Yalc in C. Dogan. Waste.Manage.,2002, 22: 491–499.
[35] M.Y.A. Mollah, P. Morkovsky, J.A.G. Gomes, M. Kesmez, J. Parga, D.L. Cocke. J. Hazard. Mater. B., 2004, 114: 199 – 210.
[36] F.C. Walsh, G.W. Reade. Analyst, 1994, 119, 797–803.
[37] T. Naohide, M. Yukio, Y. Masataka, W. Shin-Ichi, T. Sahori, S. Zyun, H. Kunishige, T. Hiroyasu. Journal of Japan Society on Water Environment, 1998, 21: 47-50.
[38] N. Adhoum, , L. Monser, N. Bellakhal J.E. Belgaied. J. Hazard. Mater.B., 2004, 11: 207– 213.
[39] M. Kashefialasl, M. Khosravi, R. Marandi, K. Seyyedi. International Journal of Science and Technology, 2006, 2: 365-371.
[40] K.S. ParamaKalyani, N. Balasubramaniana, C. Srinivasakannan. Chemical Engineering Journal.,2009, 151: 97-104.
[41] C.T. Wang, W.L. Chou, L.
[42] 2004 World Health Organization. Water Treatment and Pathogen Control: Process Efficiency in Achieving Safe Drinking Water.Edited by Mark W LeChevallier and Kwok-Keung Au. ISBN: 1 84339 069 8. Published by IWA Publishing, London, UK.
[43] EPA Guidance Manual: Turbidity Provision April 1999
[44] Turbidity And Microbial Risk In Drinking Water, Prepared by: Martin J. Allen, Ronald W. Brecher, Ray Copes, Steve E. Hrudey (Chair), and Pierre Payment Ministerial Technical Advisory Committee. [45] EPA Drinking water advice note: Turbidity in Drinking Water, Version 1 Issued: 2 November 2000. [46] Removal of suspended solids and turbidity from marble processing wastewaters by electrocoagulation:
Comparison of electrode materials and electrode connection systems Murat Solak et al
[47] Treatment of Turbid Wastewater by Means of Clean Electrochemical Technology: Investigation of the
New Operational Parameters E. Keshmirizadeh*, F. Lalavi, M. Hemmati
[48] MPCB website: www.mpcb.nic.in