Abstract - In the present study, rubber seed coat based activated
carbon (RSCAC) was used as adsorbent for malachite green (MG) dye removal from aqueous solution. The effects of dye initial concentration, contact time, solution temperature and pH on MG adsorption onto RSCAC were investigated. Results showed that the adsorption of MG was favourable at pH 6 whereas the adsorption uptake was found to increase with increase in initial concentration, contact time and solution temperature. Experimental data were analyzed by model equations such as Langmuir, Freundlich and Temkin isotherms and it was found Langmuir isotherm model best fitted well the adsorption data.
Index Terms - Rubber seed coat; Activated carbon; Malachite green; Adsorption isotherm
I. INTRODUCTION
everal processes have been applied for the treatment of dyes from wastewater such as chemical, biological and physical process [1]. Even thought, chemical and biological treatment are effective for removing dyes, they are still required special equipment and considering quite energy intensive in the term of addition and large amount of by-products often generated [2]. Recent years, physical method through adsorption process based on activated carbon material has been considered to be superior techniques as compared to others. However, the commercial activated carbon is quite expensive and has limited their application [3]. Due to economic reasons, the discovery of alternative adsorbent to replace the costly activated carbon is highly encouraged. The use of cheap and abundant agricultural waste such as rubber seed coat as precursor for activated carbon production will decrease the waste disposal and also convert this waste into value-added product.
Thus the aims of this study were to develop rubber seed coat based activated carbon (RSCAC) using NaOH as chemical agents for removal of malachite green (MG) dye from aqueous solution. The effects of different parameters such as contact time, initial dye concentration, temperature and pH were analyzed. The equilibrium data of the adsorption process were then analyzed to study the adsorption isotherms of MG on the RSCAC.
Manuscript received May 10, 2011. This work was supported by the Research University (RU) grant provided by Universiti Sains Malaysia. Zainal Arifin Ahmad and Mohd Azmier Ahmad are the members of Waste Management Cluster of Universiti Sains Malaysia. Mohd Nazri Idris is postgraduate student working on carbon material. The correspondence author can be contacted via e-mail: [email protected] (M.N. Idris).
II. Materials and Methods
A. Material
The rubber seed coat (RSC) was obtained from Selama Rubber Estate, Perak, Malaysia. Malachite green, 4-[(4-dimethylaminophenyl)-phenyl-methyl]-N,N-dimethyl-aniline supplied by Sigma-Aldrich (M) was used as an adsorbate. Deionized water was used to prepare all solutions. MG has a
chemical formula of C23H26N2OHCl with molecular weight of
382.93 g/mol. The chemical structure of MG is as shown in Fig. 1.
Figure 1. Chemical structure of MG dye
B. Preparation of activated carbon
RSC was firstly washed with water and subsequently dried at 378 K for 24 h to remove the moisture content. The dried RSC was ground and sieved to the desired particle size of 1-2 mm. The sieved sample was loaded in a stainless steel vertical tubular reactor placed in a tube furnace. Carbonization of the dried RSC was carried out at 973 K with heating rate of 10 K/min under purified nitrogen (99.99%) flown through at flowrate of 150 ml/min for 2 h. The char produced was mixed with sodium hydroxide (NaOH) pellets with NaOH:char impregnation ratio (IR) of 2.4. The mixture was then dehydrated in an oven at 378 K for 24 h to remove moisture. Then the sample was activated under the same condition as carbonization to a final temperature of 1123 K. Once the final temperature was reached, the gas flow was switched over from
N2 to CO2 while activation was held for 2.2 h. The activated
product was then cooled to room temperature under nitrogen flow and then washed with hot deionized water and 0.1 M HCl until the pH of the washing solution reached 6.5-7.
C. Adsorption studies
For batch adsorption studies, 0.2 g of adsorbent were mixed with 100 ml aqueous dye solutions of 100 mg/l initial concentration in 250 ml Erlenmeyer flasks. The mixture was agitated at 120 rpm at 303 K until equilibrium was reached. The concentration of MG dye solution was determined using a double UV-Vis spectrophotometer (UV-1800 Shimadzu,
Adsorption equilibrium of malachite green dye onto
rubber seed coat based activated carbon
Mohd Nazri Idrisa,*, Zainal Arifin Ahmada, Mohd Azmier Ahmadb
aSchool of Materials and Mineral Resources Engineering, Engineering Campus, Universiti Sains Malaysia, 14300 Nibong Tebal, Penang, Malaysia
b
School of Chemical Engineering, Engineering Campus, Universiti Sains Malaysia, 14300 Nibong Tebal, Penang, Malaysia
Japan) at it maximum wavelength of 615 nm. The
concentration retained in the adsorbent phase (qe, mg/g) was
calculated by using Eq. (1):
Removalሺ%ሻ =ሺC୭C− Cୣሻ
୭ x 100 ሺ1ሻ
where Co and Ce are the liquid-phase MG concentrations at
initial state and at equilibrium (mg/l), respectively.
D. Effect of contact time and MG initial concentration
In order to study the effect of contact time and initial concentration on the MG uptake, 100 ml of MG solutions with initial concentration of 25-250 mg/l were prepared in a series of 250 ml Erlenmeyer flasks. 0.2 g of the RSCAC was added into each flask covered with glass stopper and the flasks were then placed in an isothermal water bath shaker at constant temperature of 303 K, with rotation speed of 120 rpm, until equilibrium point was reached. In this case, the solution pH was kept original without any pH adjustment.
E. Effect of solution temperature on MG adsorption
The effect of solution temperature on the MG adsorption process was examined by varying the adsorption temperature from 303, 323 and 343 K by adjusting the temperature controller of the water bath shaker, while other operating parameters such as volume of MG, activated carbon dosage and rotation speed were kept constant. In this case also, the solution pH for 25-250 mg/l of MG initial concentration was kept constant without any adjustment.
F. Effect of solution pH on MG adsorption
The effect of solution pH on the MG adsorption process was studied by varying the initial pH of the solution from 2 to 12. The pH was adjusted using 0.1 M HCl and/or 0.1 M potassium hydroxide (KOH), and was measured using pH meter (Model Delta 320, Mettler Toledo, China). The MG initial concentration was fixed at 200 mg/l with adsorbent dosage of 0.2 g/100 ml. In this case, the solution temperature is at 303 K. The MG percent removal was calculated by following Eq. (1).
III. RESULTS AND DISCUSSION
A. Effect of initial MG concentration and contact time
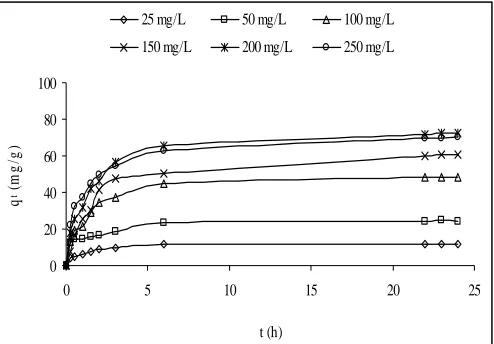
The effect of contact time on the adsorption capacity of MG ions using RSCAC at different initial concentrations is shown in Fig. 2. It can be seen that the adsorption capacity of MG increased with contact time rapidly and thereafter it proceeded at a lower rate and finally attained equilibrium. The result suggests that, adsorption takes place rapidly at the initial stage on the external surface of the adsorbent followed by a slower internal diffusion process, which may be the rate-determining step [4]. In addition, the fast adsorption at the initial stage also may be due to the fact that a large number of surface sites are available for adsorption but after a lapse of
time, the remaining surface sites are difficult to be occupied. This is because of the repulsion between the solute molecules of the solid and bulk phases, thus, make it take long time to reach equilibrium. The adsorption uptakes of MG at equilibrium increased from 12.04 to 70.33 mg/g as the initial dye concentration was increased from 25 to 250 mg/L. The initial dye concentration provides an important driving force to overcome the mass transfer resistance of the dye between the aqueous and solid phases. Therefore, at higher initial dye concentration, the number of ions competing for the available sites on the surface of activated carbon was high, hence, resulting in higher MG adsorption capacity.
Figure 2. Effect of contact time on MG adsorption on RSCAC at various initial concentrations.
Also, it was observed that an equilibrium time of 3 h was needed for MG dye solution with initial concentrations of 25 mg/l and 50 mg/l to reach equilibrium. However, for initial concentrations of 100-250 mg/l, longer equilibrium times of 22-24 h are required for the system to reach equilibrium. It is clear that the adsorption capacity of the dyes were dependent on the concentration of the dyes. Initially, adsorbate molecules have to first encounter the boundary layer effect. Then it has to diffuse from boundary layer film onto adsorbent surface and finally, it has to diffuse into the porous structure of the adsorbent. In fact, the ratio of the initial number of dye molecules to the available surface area is low at lower initial concentration compare to higher initial concentration.
Therefore, MG solutions with higher initial
concentrations would take relatively longer contact time to attain equilibrium due to the higher amount of MG molecules. Santhy and Selvapathy [5] found that the equilibrium time for the adsorption of Reactive Orange 12, Reactive Red 2 and Reactive Blue 4 on coir pith-activated carbon was 4 h for an initial concentration of 40 mg/L. Leechart et al. [6] reported that for Red Reactive 141 with initial concentration of 400 mg/L, the adsorption amount was gently increased in the first 6 h and gradually reached equilibrium within 24 h. This showed that the adsorption performance of the activated carbon prepared in this study is comparable with the findings of previous researchers where the adsorption capacity was increased with increasing the initial dye concentration ending to the saturation at higher dye concentrations.
0 20 40 60 80 100
0 5 10 15 20 25
t (h)
q
t (
m
g
/g
)
25 mg/L 50 mg/L 100 mg/L
B. Effect of solution temperature on MG adsorption
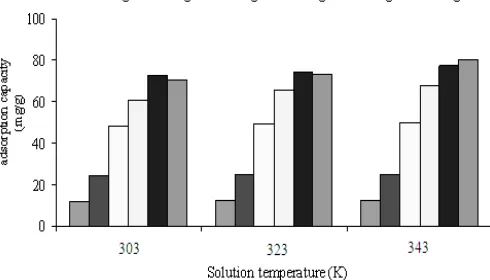
Fig. 3 represents the adsorption capacity of MG onto RSCAC at temperature of 303, 323 and 343 K at various initial dye concentrations (25-250 mg/L). The result shows that the equilibrium adsorption capacity of MG was increased while increasing the solution temperature from 303 to 343 K for all initial dye concentrations. This increase may indicates the increased tendency of MG due to an increase in kinetic energy with increasing temperature, and this situation leads to more adsorption on the surfaces of RSCAC.
Figure 3. Effect of solution temperature on MG uptake at different initial concentrations.
In details, it would also increase the mobility of the dye with increasing temperature, hence, an increase in the number of molecules may also acquire sufficient energy to undergo an interaction with active sites at the surface. As the temperature increases, the penetration of MG molecules inside the mesopores increased together with the creation of new active sites and the decrease in the thickness of boundary layer surrounding the adsorbent make the mass transfer resistance of adsorbate in the boundary layer decreases with temperature. Besides, it might also due to the increase in chemical interaction between the adsorbate and surface functionalities of adsorbent. The results indicate that the adsorption reaction of MG adsorbed by RSCAC is endothermic process. Similar trend was reported by Dizge et al. [7] for the adsorption of Remazol Brilliant Blue, Remazol Red 133 and Rifacion Yellow red by fly ash.
C. Effect of solution pH on MG adsorption
The pH of the system exerts profound influence on the adsorption capacity of adsorbate molecule presumably due to its influence on the surface properties of the adsorbent and ionization or dissociation of the adsorbate molecule. Fig. 4 shows the variations in the MG percent removal at pH values of 2-12, temperature of 303 K and an initial dye concentration of 200 mg/l. From the figure, it is evident that the percentage removal of MG increased from pH 2 to 6 before it decreased gradually until pH 12. The maximum percentage removal of MG is observed at pH 6. Similar trend of pH effect was observed for the adsorption of RBR onto ZnO fine powder [8], as well as for the adsorption of Direct Blue 2B and Direct
Green B on activated carbon prepared from Mahogany sawdust [9].
Figure 4. Effect of solution pH on MG removal.
The high percentage removal of the MG solution at acidic pH may be attributed to the electrostatic interactions between the positively charged adsorbent and the negatively charged MG dye anions. The positively charged adsorbent is created due to the hydrophobic nature of the developed activated
carbon which led to adsorb hydrogen ions (H+) onto the
surface of the carbon when immersed in water. The surface charge of adsorbent has become generally positively charged at lower pH and negatively charged at higher pH. In addition, the positive charge in acidic medium and the negative charge in basic medium develop on the surface of adsorbent. Therefore, while the removal of anionic dye by adsorption increases at lower pH, it decreases at higher pH. The adsorbent surface would attract the negatively charged functional groups located on the reactive dyes and hence increases the adsorption capacity.
D. Adsorption isotherms
The relationship between the amount of a substance adsorbed at constant temperature and its concentration in the
equilibrium solution is called adsorption isotherm.
Equilibrium isotherm equations are used to describe the experimental sorption data and the parameters obtained from the different models. The adsorption equilibrium data were analyzed using Langmuir, Freundlich and Temkin isotherms expression. Linear regression is commonly used to determine the best-fitting isotherm and the applicability of isotherm equations is compared by judging the correlation coefficients.
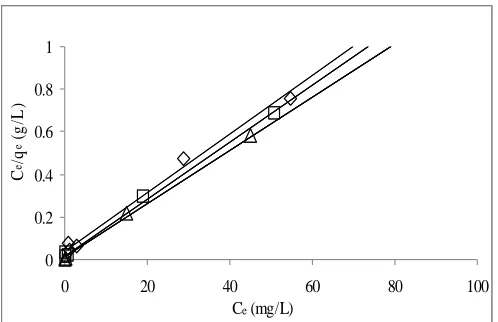
The Langmuir adsorption isotherm has been traditionally used to quantify the performance of different adsorbents. Langmuir model is based on the assumption that adsorption energy is constant and independent of surface coverage where the adsorption occurs on localized sites with no interaction between adsorbate molecules and that maximum adsorption occurs when the surface is covered by a monolayer of adsorbate. The linear form of Langmuir isotherm equation is given as:
=
ଵ ொಽ
+
ଵ
ொ
ܥ
(2)
where Ce (mg/L) is the equilibrium concentration of the MG,
qe (mg/g) is the amount of MG adsorbed per unit mass of
related to adsorption capacity and rate of adsorption,
respectively. A straight line with slope of 1/Qo and intercept of
1/QoKL is obtained when Ce/qe is plotted against Ce (Fig. 5).
Figure 5. Langmuir isotherm plot for the adsorption of MG
dye on RSCAC; 303 K (◊),323 K (□) and 343 K (∆).
The essential characteristics of Langmuir equation can be
expressed in terms of dimensionless separation factor, RL
defined by Weber and Chakkravorti [10]:
ܴ
=
ሺଵାଵಽሻ (3)
where Co is the highest initial solute concentration whereas RL
value implies whether the adsorption is unfavourable (RL>1),
linear (RL=1), favourable (0<RL<1), or irreversible (RL=0).
Fig. 6 represents the plot of the calculated RL values versus the initial concentration of MG at 303, 323 and 343 K. It was
observed that all the RL values obtained were between 0 and 1,
showing that the adsorption of MG on the RSCAC was favorable at the experimental conditions that have been studied.
Figure 6. Effect of initial MG concentration on dimensionless
separation factor RL; 303 K (◊), 323 K (□) and 343 K (∆).
The lower the RL value, the more irreversible the adsorption
process. In the engineering practice, it means that if RSCAC is used in series batch adsorption operation, only a few operation steps are needed to obtain high removal levels, or if RSCAC is used in column adsorption operation, sharp straight
breakthrough curves will appear, meaning that the adsorbent is being used sufficiently. As the MG initial concentration
increases from 25 to 250 mg/l, the RL values were as well
found to decrease, indicating that the adsorption was more favorable at higher MG concentration.
Freundlich model is an empirical equation based on sorption on a heterogeneous surface or surface supporting sites of varied affinities. The well known logarithmic form of Freundlich is given by the following equation:
log ݍ
= ݈݃ܭ
+
ଵ݈݃ܥ
(4)
where KF and n are Freundlich constants related to adsorption
capacity and adsorption intensity, respectively. In general n>1 illustrates that adsorbate is favorably adsorbed on the adsorbent whereas n<1 demonstrates the adsorption process is chemical in nature [11]. The applicability of the Freundlich sorption isotherm was also analyzed, using the same set of
experimental data, by plotting log qe versus log Ce which gave
a straight line with slope of 1/n and intercept of log KF (Fig.
7). In this study, the values found for n was around 3.75 and 4.98, which proves that the adsorption is favorable and process is physical in nature.
Fig. 7. Freundlich isotherm plot for the adsorption of MG dye
on RSCAC; 303 K (◊), 323 K (□) and 343 K (∆).
Temkin isotherm assumes that the heat of adsorption of all the molecules in the layer would decrease linearly with coverage due to adsorbent-adsorbate interaction and the adsorption is characterized by a uniform distribution of binding energies, up to some maximum binding energy. Temkin model is expressed as:
ݍ
= ቀ
ோ்ቁ ݈݊ሺܣܥ
ሻ
(5)where RT/bT = B (J/mol), which is the Temkin constant related to heat of sorption whereas A (L/g) is the equilibrium binding constant corresponding to the maximum binding energy. R (8.314 J/mol K) is the universal gas constant and T (K) is the absolute solution temperature. A plot of qe versus ln Ce gives a linear graph with B as the slope and B (ln AT) as the intercept (Fig. 8).
0 0.2 0.4 0.6 0.8 1
0 20 40 60 80 100
Ce (mg/L)
C
e/q e (
g
/L
)
0 0.02 0.04 0.06 0.08 0.1 0.12
0 50 100 150 200 250 300
Co (mg/L)
RL
0 0.5 1 1.5 2 2.5
-1.5 -1 -0.5 0 0.5 1 1.5 2 2.5
log Ce
lo
g
q
Fig. 8. Temkin isotherm plot for the adsorption of MG dye on
RSCAC; 303 K (◊), 323 K (□) and 343 K (∆).
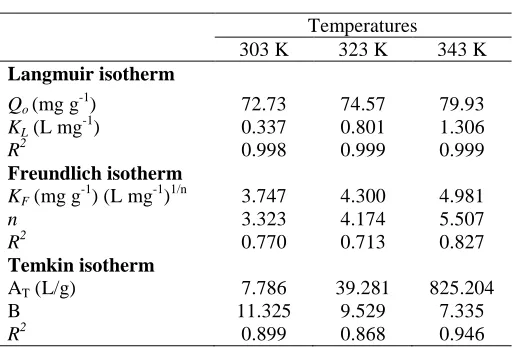
Table 1 summarizes all the constants and R2 values
obtained from the three isotherm models applied for adsorption of MG at 303, 323 and 343 K on the RSCAC.
Langmuir model gave the highest R2 values which were
greater than 0.99. Conformation of the experimental data into the Langmuir isotherm equation proved that the surface of RSCAC for adsorption of MG is made up of homogeneous adsorption patches than heterogeneous adsorption patches [11]. The results agreed with the works carried out by previous researchers for other reactive dyes such as reactive blue dyes, which reported that the Langmuir model gave a better fit than Freundlich model on the adsorption using different adsorbents, such as commercial activated carbon from bentonite [12] and sepiolite [13]. This suggested that some homogeneity on the surfaces or pores of the activated adsorbents played the role in MG adsorption. The maximum monolayer concentration of MG adsorption by Langmuir model were compared with previous studies and tabulated in Table 2.
TABLE 1.
ISOTHERM PARAMETERS FOR REMOVAL OF MGBY
RSCAC
Temperatures
303 K 323 K 343 K
Langmuir isotherm
Qo (mg g-1) 72.73 74.57 79.93
KL (L mg-1) 0.337 0.801 1.306
R2 0.998 0.999 0.999
Freundlich isotherm
KF (mg g-1) (L mg-1)1/n 3.747 4.300 4.981
n 3.323 4.174 5.507
R2 0.770 0.713 0.827
Temkin isotherm
AT (L/g) 7.786 39.281 825.204
B 11.325 9.529 7.335
R2 0.899 0.868 0.946
TABLE 2
COMPARISON OF ADSORPTION CAPACITIES, Qo OF
MG BY VARIOUS ADSORBENTS
Adsorbents Qo (mg g-1) References
Rice husk 76.92 [14]
Arundo donax root 8.69 [15]
RSCAC 72.73 This study
PETNa8 169.49 [16]
CZn5 370.37 [16]
Lab. grade activated carbon 42.18 [17]
Silica gel 39.7 [18]
Activated slag 74.2 [19]
Hen feathers 2.82 [20]
IV. CONCLUSIONS
RSCAC was found to be suitable for the removal of MG from aqueous solution. Adsorption of MG was found to increase with increase in contact time, MG initial concentration and solution temperature. The adsorption of MG on RSCAC was favored at pH 6 which is acidic medium. The adsorption uptake was found to increase with increase in initial concentration, contact time and solution temperature. The Langmuir isotherm model was well described by the equilibrium data with maximum monolayer adsorption capacity of 72.73 mg/g. However, further studies on characterization, kinetic and thermodynamic are necessaries to predict better understanding on the performance of the adsorption processes.
REFERENCES
[1] Yahaya N.K.E.M., Latiff M.F.P.M., Abustan I., Bello O.S., Ahmad M.A. Fixed-bed column study for Cu (II) removal from aqueous solutions using rice husk based activated carbon, International Journal of Engineering & Technol., 2011;11:248-252.
[2] Ahmad M.A., Alrozi R. Optimization of preparation conditions for mangosteen peel-based activated carbons for the removal of remazol brilliant blue R using
response surface methodology, Chem. Eng. J.,
2010;165:883-890.
[3] Bello O.S., Ahmad M.A., Tan T.S. Utilization of cocoa pod husk for the removal of remazol black b reactive dye from aqueous solutions: kinetic, equilibrium and thermodynamic studies, Trends in Applied Sciences Research, 2011;6:794-812.
[4] Gialamouidis D., Mitrakas M., Liakopoulou-Kyriakides M. Equilibrium, thermodynamic and kinetic studies sp., Staphylococcus xylosus and Blakeslea trispora cells. J Hazard. Mater., 2010;182:672-680.
[5] Santhy K., Selvapathy P. Removal of reactive dyes from wastewater by adsorption on coir pith activated carbon, Bioresource Technol., 2006;97:1329-1336.
[6] Leechart P., Nakbanpote W., Thiravetyan P. Application of ‘waste’ wood-shaving bottom ash for adsorption of azo reactive dye, J. Environ. Manage., 2009;90:912-920.
0 20 40 60 80 100
-5 -4 -3 -2 -1 0 1 2 3 4 5 6
ln Ce
q
e (g
/m
g
[7] Dizge N., Aydiner C., Demirbas E., Kobya M., Kara S. Adsorption of reactive dyes from aqueous solutions by fly ash: Kinetic and equilibrium studies, J. Hazard. Mater., 2008;150:737-746.
[8] Ada K., Ergene A., Tan S., Yalc E. Adsorption of Remazol Brilliant Blue R using ZnO fine powder: Equilibrium, kinetic and thermodynamic modeling studies, J. Hazard. Mater., 2009;165:637-644.
[9] Malik P.K. Dye removal from wastewater using activated carbon developed from sawdust: adsorption equilibrium and kinetics. J. Hazard. Mater., 2004;113:81-88.
[10] Weber T.W., Chakkravorti R.K. Pore and solid disffusion models for fixed-bed adsorbers, AlChE. J., 1974;20:228-238.
[11] Tunc O., Tanac H., Aksu Z. Potential use of cotton plant wastes for the removal of Remazol Black B reactive dye. J, Hazard, Mater., 2009;163:187-198.
[12] Ozcan A., Omeroglu C., Erdogan Y., Ozcan A.S. Modification of bentonite with a cationic surfactant: An adsorption study of textile dye Reactive Blue 19. J. Hazard. Mater., 2007;140:173-179.
[13] Demirbas E., Nas M.Z. Batch kinetic and equilibrium studies of adsorption of Reactive Blue 21 by fly ash and sepiolite, Desalination, 2009;243:8-21.
[14] Rahman I.A., Saad B., Shaidan S., SyaRizal E.S. Adsorbtion Characteristics of malachite green on activated carbon derived from rice husks produced by chemical-thermal process, Bioresour. Technol, 2005; 96:1578-1583
[15] Zhang J., Li Y., Zhang C., Jing Y. Adsorption of malachite green from aqueous solution onto carbon prepared from Arundo donax root, J. Hazard. Mater., 2008; 150:774–782
[16] Akmil-Basar C., Onal Y., Kilicer T., Eren D. Adsorption of high concentration malachite green by two activated carbon having different porous structures, J. Hazard. Mater, 2005; B127:73-80
[17] Mall I.D., Srivastava V.C., Agarwal N.K., Mishra I.M. Adsorptive removal of malachite gree dye from aqueous solution by bagasse fly ash and activated carbon-kinetic study and equilibrium isotherm analyses, Colloids and
Surfaces A: Physicochemical and Engineering
Aspects, 2005; 264:17-28
[18] Samiey B., Toosi A.R. Adsorption of malachite green on silica gel: Effect of NaCl, pH and 2-propanol, J. Hazard. Mater., 2010; 184:739-745
[19] Gupta V.K., Srivastava S.K., Mohan D. Equilibrium uptake, sorption dynamics, process optimization and column operations for the removal and recovery of malachite green from wastewater using activated carbon and activated slag, Ind. Eng. Chem. Res., 1997; 36: 2207–2218.