Published online March 17, 2015 (http://www.sciencepublishinggroup.com/j/aff) doi: 10.11648/j.aff.s.2014030601.17
ISSN:2328-563X (Print); ISSN:2328-5648 (Online)
Calculation of FCR and RBC with Varied Effect of Iron in
Broiler
Barkat Ali Kalwar
1, Hakim Ali Sahito
2, *, Mehmood Ahmed Kalwar
1, Zaibun Nisa Memon
2,
Madan Lal
11
Department of Nutrition and Animal Product Technology, Faculty of AHV, Science, SAU, Tandojam- Sindh
2
Department of Zoology, Faculty of Natural Sciences, SALU- Khairpur- Sindh
Email address:
[email protected] (H. A. Sahito)
To cite this article:
Barkat Ali Kalwar, Hakim Ali Sahito, Mehmood Ahmed Kalwar, Zaibun Nisa Memon, Madan Lal. Calculation of FCR and RBC with Varied Effect of Iron in Broiler. Agriculture, Forestry and Fisheries.Special Issue: Agriculture Ecosystems and Environment.
Vol. 3, No. 6-1, 2014, pp. 46-51. doi: 10.11648/j.aff.s.2014030601.17
Abstract:
One hundred and fifty hubbard broiler were studied to examine their response to various levels of iron in relation to FCR and blood parameters. The experiment was conducted at poultry experimental station, Faculty of Animal Husbandry and Veterinary Sciences, Sindh Agriculture University Tandojam during, 2013. Commercial feed was supplemented with iron concentration of 0 (Control), 40, 80, 120, 160mg/kg in groups A, B, C, D and E, respectively. Result revealed lowest feed (3780g) and water (8160ml) consumed by group E. Better (P<0.05) live weight (1939g), FCR (1.94), dressing percentage (64.93%), RBC (3.33x10⁶/µl), HB (9.30g/dL), PCV (31.1%) and Rs. 47.35 per bird net profit was also recorded in group E where, 160mg/ kg iron was supplemented in broiler ration. Lowest mortality (6.66%) was also observed in group E, while non-significant differences in edible parts were observed among the groups. Increasing level of iron showed better performance in the groups. It is concluded that 160mg/kg iron level can be supplemented in broiler ration for better FCR, dressing % and per bird net profit along with better performance in blood parameters.Keywords: Ration, Red Blood Cells, Mortality, Profitand Poultry
1. Introduction
A 100 g edible portion of broiler meat contains 74.6 g moisture, 12.1 g proteins, 11.1 g lipid, 1.0 g minerals and 158-175mg cholesterol. To overcome this gap, poultry industry can play its role by providing the best source of palatable, nutritious and high quality animal protein in a comparatively short duration, at an appropriate and affordable cost, because broiler meat is a high source of nutrients and is easily and completely digested. It is also a good source of protein and vitamins. The growth promoting value of the protein in chicken compares favorably with that of fish protein mainly meat diets, in response to gain weight (Bhatti, 2001).
The economic analysis shows that the feed is a major expense in poultry production amounting to about 70 to 75% of the total cost. Hence, the most important factor is the ratio between the feed/meat. Different feed give different results in terms of growth production. Thus, chemical composition of a feed is of great economic importance, i.e. preparation of feed
by formulation of balanced amounts of feed sources to adequate required quantities of vitamins, minerals and trace elements. Of trace elements, iron is one of the most important elements for smooth function of body muscles. Within the body iron exist in two oxidation states: ferrous (Fe2+) or ferric (Fe3+). Because iron has an affinity to electronegative atoms such as oxygen, nitrogen and sulfur, these atoms are found at the heart of the iron-binding centers of macromolecules. Further the body temperature and blood cholesterol level of broiler are also some time effect the fat supplementation on the growth (Sahito et al., 2012). Thus, the partial mango pulp mixing in ration on can change its behaviour and production of broiler (Soomroet al., 2013). The poultry production also depends upon its well management to acquire the production through advance techniques being applied in Sindh- Pakistan (Abbasiet al., 2013).
compromise the immune system. It has been well documented that serum iron falls early in response to bacterial and viral infections and rebounds quickly with recovery(Larry, 1995). If iron is in great excess, then the key proteins required to initiate recognition and antibody production may be masked. Contrary, anemic animals are much more susceptible than those with adequate iron (Larry, 1995). Iron is the fourth most abundant element in the earth crust and is only a trace element in biologic systems, which makes up only 0.004% of the body mass(Uthman, 1998). Yet it is an essential component or co-factor of numerous metabolic reactions. By weight, the great proportion of the body’s iron is dedicated to its essential role as a structural component of hemoglobin. On the other hand, iron is a toxic substance. Too much iron accumulating in vital structures, especially the heart, pancreas and liver produces a potentially fatal condition, hemochromatosis (Uthman, 1998). Considering the importance of iron, the present study was carried out to determine the calculation of FCR and RBC with varied effect of iron in broiler.
2. Materials and Methods
Iron is a trace element that has linear association with immune system of broiler and its deficiency or excess can compromise the immune system. In order to ascertain the effect of different concentration of iron on the growth and blood parameters of broiler, the present study was conducted during, 2013 at Poultry Experiment Station, Faculty of Animal Husbandry and Veterinary Sciences, Sindh Agriculture University, Tandojam.
2.1. Housing
The house was initially cleaned and washed with pressure water. White wash was done by using limestone later-on sanitizer (Snucop) (1gm powder in 1 liter of water) by spraying on the walls, floors and equipment etc. the shed door was closed for 30 minutes for disinfections prior to starting the research. To make the house comfortable, wooden dust was used as a litter. Before spreading the wooden dust on the floor, it was first dried under sun light. Calcium carbonate 500 gm over 100 square feet of litter was used to prevent bacterial and other parasitic growths and also prevented for moisture absorbent.
2.2. Brooding
The day-old chicks were brooded under the electric blub which were about (40 to 60 watts) used to maintain the light. Temperature ranged from 90 to 95ºF during the first week and it was reduced by 5ºF each week and maintained at 70ºF. Humidity was maintained around 55 to 60 % by providing external water spray and light provision was ensured 24 hours. Floor space area of 1 square feet per broiler was provided.
2.3. Vaccination
The chicks were protected against common viral diseases through the inoculation i.e. new castle (ND), infectious bronchitis (IB), and infectious bursal disease (IBD) and hydro-pericardium syndrome throughout the study period (Table-1).
Table 1. Vaccination schedule for experimental broilers
S. No. Vaccination Days
6th 11th 14th 21st 26th
1 Vaccine N.D+IB Gumboro Hydro pericardium sydrome N.D La Sota Gumboro
2 Route of administration Intraocular Intraocular Subcutaneous Drinking water Drinking Water
3 Dose/b.wt One drop One drop 0.5 cc 2 ml 2ml
2.4. Grouping of Broilers
One hundred fifty (150) day old hubbard broiler were purchased, initially weighted and randomly divided into five groups A, B, C, D and E having 30 chicks in each group. All groups were provided ration that contains different iron concentration.Group A, kept as control (0.0%) , group B, C, D and E were given iron concentration of 40, 80, 120, and 160 mg/ kg feed, respectively.
2.5. Feeding
The chicks were fed ad libitum, the commercial starter ration was provided during first 0-4 weeks and finisher ration during 5-6th weeks of age. Three types of feeder were used such as plate type, rod/tube and adult feeder made up of plastic and aluminum. The feed refusal from each group was collected and weighted daily twice a day.
2.6. Watering
Underground fresh water was provided 24 hrs. Initially two chick drinkers (2 liter) were provided, later on adult drinker was provided to each group. The system was manual and water was provided twice daily at morning and evening. Refusal water was measured and replaced with fresh water twice a day. When, 42 days completed, the experimental broilers of each group were marketed on the individual weight basis and the final live weight was recorded. For other parameters, 10 broilers in each group were randomly selected and slaughtered to record dressed weight and percentage and weight of liver, heart and gizzard.
2.7. Blood Analysis
samples were collected from the wing vein of broiler before slaughtering. The samples were kept in a sterilized bottle contain sodium citrate 3%. The collected samples were analyzed for RBC count (by Hemocytometer), Haemoglobin (by Sahlis method). Further, under given parameters were kept under study period:
1. Live weight of broilers, 2. Feed intake (g), 3. Water intake (ml), 4.Mortality (%), 5.Dressing weight (g/b), 6.Weight of edible parts (g), 7. RBC count (x 106 ul), 8. Haemoglobin (g/dL), 9.PCV (%), 10.Economics (Rs).
2.8. Data Analysis
The data on various related parameters were collected and arranged in the tables, analyzed statistically to discriminate the superiority of treatment means. The collected data were fed in the computer in Mstat-C, Microsoft program. Duncans Multiple Range (DMR) test was employed to compare the individual means as suggested by (Gomez and Gomez, 1984).
3. Results
In order to examine the effect of different iron concentration on FCR and RBC count in broilers the study was carried out at Sindh Agriculture University during, 2013. The data thus obtained along with the outcome interpretation are presented in the following tables.
3.1. Feed Intake
Average feed intake of broiler in group A, B, C, D and E was 3880.0, 3850.0, 3830.0, 3810.0 and 3780.0 g/b, respectively (p<0.001). This indicated that additional iron supplementation resulted in reduced feed intake and it was lowest (3780.0g/b) in group E, where the broilers were fed on feed with highest iron concentration (160mg/kg feed) (Table-2).
Table 2. Average feed intake of broiler (g/b)
Weeks Groups
A B C D E
W1 143.3 142.1 139.1 136.5 134.5
W2 353.5 351.1 338.5 339.5 341.5
W3 485.3 459.8 448.6 442.0 432.0
W4 665.6 959.5 666.5 660.0 650.8
W5 989.8 986.3 973.7 975.0 971.2
W6 1269.5 1251.2 1263.6 1257.0 1250.0
Total intake 3880.0a 3850.0ab 3830.0ab 3810.0ab 3780.0b
Note: Group probability = 0.001 and LSD 0.05 = 35.827
3.2. Water Intake
Broiler consumed less water in the first week and later with the increase in their age, the water consumption was increased simultaneously (Table-3). Average water intake of the broiler in group A, B, C, D and E was 8905.2, 8710.0, 8315.0, 8183.0 and 8160.0 ml/b, respectively (p<0.001). Water intake was higher in group A (Control) then the rest of groups. It was observed that additional iron supplementation caused a reduction in water intake by the broilers and inversely with
increased iron concentration in feed the broiler water consumption was decreased considerably. Hence, the minimum water intake (8160.0 ml) was recorded in broilers fed on ration containing highest iron concentration in group E.
Table 3. Average water intake of broiler (ml/b)
Weeks Groups
A B C D E
W1 111.2 111.5 108.0 106.8 105.5
W2 586.3 586.5 535.5 499.0 529.5
W3 1090.9 1085.3 1020.3 999.5 980.0
W4 1538.0 1437.0 1360.2 1294.5 1284.0
W5 2495.0 2400.0 2341.2 2390.0 2280.6
W6 3083.8 3089.7 2949.8 2893.0 2980.4
Total intake 8905.2a 8710.0b 8315.0c 8183.0d 8160.0d
Note: Group probability = 0.001 and LSD 0.05 = 60.75
3.3. Live Body Weight Gain
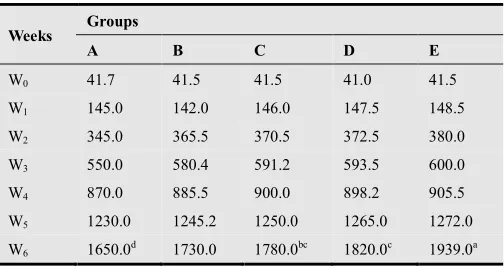
Average live body weight gain of broilers in group A, B, C, D and E was 1650.0, 1730.0, 1780.0, 1820.0 and 1939.0 g/b, respectively (p<0.001). Live body weight was significantly high (p<0.001) in broilers group E, then rest of groups. The results further showed that live body weight of broilers was significantly improved with iron supplementation (Table-4). The statistical analysis illustrated that the live body weight was affected under different iron concentrations.
Table 4. Average live body weight of broiler (g/b)
Weeks Groups
A B C D E
W0 41.7 41.5 41.5 41.0 41.5
W1 145.0 142.0 146.0 147.5 148.5
W2 345.0 365.5 370.5 372.5 380.0
W3 550.0 580.4 591.2 593.5 600.0
W4 870.0 885.5 900.0 898.2 905.5
W5 1230.0 1245.2 1250.0 1265.0 1272.0
W6 1650.0d 1730.0 1780.0bc 1820.0c 1939.0a
Note: Group probability = 0.001 and LSD 0.05 = 47.17
3.4. Liver Weight
3.5. Dressing Percentage
Average dressing weight of broilers in group A, B, C, D and E was 910.0, 987.0, 1055.0, 1112.0 and 1259.0 g/b. This indicated that average dressing percentage was 55.15, 57.05, 59.26, 61.09 and 64.93%, respectively. Dressing weight was remarkably higher 1259.0 g (64.93.0), in broiler of group E, while the lowest dressed weight of 910.0 g/b(55.15%) was recorded in group A (control). The result indicates that the most efficient dressing weight and dressing percentage were obtained from the group E (p<0.001). The quantity of dressed weight in broiler improved with increased iron concentration. However, dressing percentage was slightly increased when
iron concentration was increased over 120 0r 160 mg/kg feed.
3.6. Feed Conversion Ratio (FCR)
Average feed conversion ratio of broiler observed in group A, B, C, D and E was 2.35, 2.22, 2.15, 2.09 and 1.94, respectively (Table- 5). The results indicated that the most efficient feed conversion ratio (1.94) was recorded in broilers of group E (p<0.001), respectively. While, highly significant (p<0.01) when compared with group B and control A. Results indicate that it was significantly improved with supplementation of iron to various proportions. However, this improvement in FCR was marginal when iron concentration increased beyond 160 mg/kg feed.
Table 5. Average liver, heart and gizzard weight of broiler (g/b) and dressing weight
Parameters Groups Probability
A B C D E
Liver weight 41.5 41.6 42.0 41.8 41.8 0.091
Heart weight 10.5 10.1 10,7 10.8 11.5 0.061
Gizzard weight 48.6 49.3 48.5 48.5 47.8 0.093
Dressing weight (g/b) 910.0b 987.0c 1055.0a 1112.0b 1259.0b
Dressing (%) 55.15b 57.05b 59.26a 61.09b 64.93b
FCR 2.35c 2.22b 2.15a 2.09a 1.94a
Note: Group probability = 0.001; LSD 0.05 = 36.65 and FCR: LSD 0.05 = 0.096
3.7. Mortality Rate
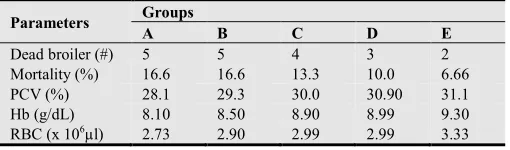
Average mortality in groups A, B, C, D and E was 5, 5, 4, 3 and 2 b/g which is the rate of mortality 16.6, 16.6, 13.3, 10.0 and 6.66 percent respectively (Table-6). Mortality was relatively higher (16.6%) in group A and B, where lowest iron concentration (0-40mg/kg feed) was given, while the lowest mortality of 6.66 % was seen in group E, where highest iron concentration (160mg/kg feed). The average PCV count in groups A, B, C, D and E was 28.1, 29.3, 30.0, 30.9 and 31.1 % (p<0.001), respectively. PCV count was comparatively higher in group E (31.1%), where higher iron concentration (160 mg/ kg feed) was given, while the lowest PCV (28.1%) was determined in group A (Control). It is obvious from the results that there was a highly significant (p<0.001) association of PCV count with increasing iron concentration. However, the PCV count in all the groups remained with the normal recommended ranges.The hemoglobin level in blood on average in groups A, B, C, D and E was 8.10, 8.50, 8.90, 8.99 and 9.30 g/dL, respectively. Hemoglobin level in blood was significantly higher (9.30 g/dL) in group E, where higher iron concentration (160 mg/ kg feed) was given, while the lowest hemoglobin level in blood (8.10 g/dL) was determined in group A (Control). The determinations of hemoglobin indicate that with supplementation and increasing iron concentration of broiler ration, the blood hemoglobin level was considerably improved. The differences in hemoglobin level in blood under different iron concentrations were statistically significant (p<0.003).The RBC (Red Blood Cell) level in blood on average in groups A, B, C, D and E was 2.73, 2.90, 2.99, 2.99, and 3.33 (x 106µl), respectively (Table-6). RBC level in blood was significantly higher i.e., 3.33 (x 106µl) in
group E, where higher iron concentration (160 mg/kg feed) was given, while the lowest RBC level in blood count 2.73 (x 106µl) was determined in group A (Control). The determination of RBC indicated that with supplementation and increasing iron concentration of broiler ration, the blood RBC level was significantly improved. The differences in RBC level in blood under different iron concentrations were statistically significant (p<0.001).
Table 6. Average mortality of broiler (%) and packed cell volume in blood of broiler
Parameters Groups
A B C D E
Dead broiler (#) 5 5 4 3 2
Mortality (%) 16.6 16.6 13.3 10.0 6.66
PCV (%) 28.1 29.3 30.0 30.90 31.1
Hb (g/dL) 8.10 8.50 8.90 8.99 9.30
RBC (x 106µl) 2.73 2.90 2.99 2.99 3.33
Note: group probability = 0.032, PCV (%), LSD = 0.063, Hb, LSD = 0.0063 and RBC, LSD = 0.1825
3.8. Economics
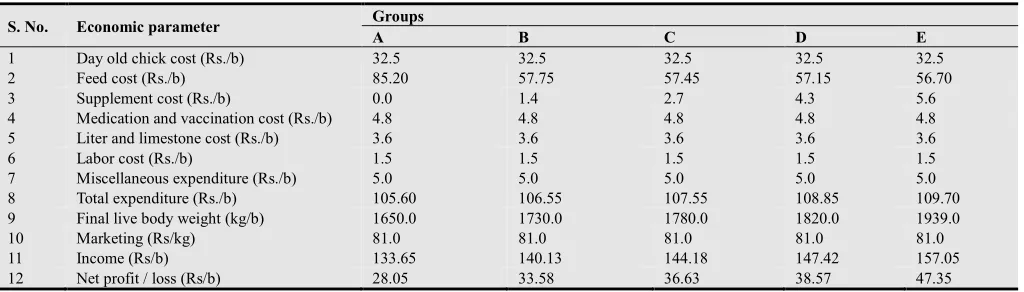
Table 7. Economic analysis of the broiler ration supplemented with different iron concentrations
S. No. Economic parameter Groups
A B C D E
1 Day old chick cost (Rs./b) 32.5 32.5 32.5 32.5 32.5
2 Feed cost (Rs./b) 85.20 57.75 57.45 57.15 56.70
3 Supplement cost (Rs./b) 0.0 1.4 2.7 4.3 5.6
4 Medication and vaccination cost (Rs./b) 4.8 4.8 4.8 4.8 4.8
5 Liter and limestone cost (Rs./b) 3.6 3.6 3.6 3.6 3.6
6 Labor cost (Rs./b) 1.5 1.5 1.5 1.5 1.5
7 Miscellaneous expenditure (Rs./b) 5.0 5.0 5.0 5.0 5.0
8 Total expenditure (Rs./b) 105.60 106.55 107.55 108.85 109.70
9 Final live body weight (kg/b) 1650.0 1730.0 1780.0 1820.0 1939.0
10 Marketing (Rs/kg) 81.0 81.0 81.0 81.0 81.0
11 Income (Rs/b) 133.65 140.13 144.18 147.42 157.05
12 Net profit / loss (Rs/b) 28.05 33.58 36.63 38.57 47.35
4. Discussion
In the present investigation, the feed and water intakes were decreased with increasing iron concentration in the range of 160mg/kg feed, while live body weight was increased considerably which resulted an improved feed conversion ratio. Moreover, the decreased weight 1259 g/band dressing percentage of 64.93 percent was superior when broiler was fed on ration containing 160 mg/kg iron concentration, followed by 120 mg/kg feed. Ruiz et al. (2000) examined broiler feed supplemented with iron concentration 50, 100 and 150 mg/ kg feed and found that iron concentration at rate of 100 mg/ kg feed proved optimally positive results for all the studied parameters. The effect of increasing iron concentration on liver, heart and gizzard weight was not significant, but this increased level was within the normal ranges. Apparently, the low mortality of broiler had some association with supplementation or increasing iron concentration in feed.
Packed cell volume (PCV), hemoglobin level and red blood cell (RBC) level in blood of the broiler increased considerably with increasing Fe concentration in feed. However, this increase remained within the normal recommended levels and hence there was no negative effect on these blood parameters due to iron concentration upto 160 mg/kg feed. In a similar study, Huff et al., (1997) reported that broiler diets containing lower Fe levels significantly decreased packed blood cell volume and hemoglobin concentration without altering the number of circulating erythrocytes. Similarly, Vahlet al. (1997) found that broiler feed was supplemented with Fe concentrations and concluded that apparently Fe requirement was 100 mg/kg diet (80 mg from dietary components and 20 mg Fe from supplement and in blood, the hemoglobin concentration increased slightly with extra dietary Fe. Julio et al. (1998) concluded that chicks fed high levels of Fe consistently showed increased packed cell volumes. In a similar study, Pecelunaset al., (1999) reported that the effect of dietary Fe was significant (p<0.05) on growth of broiler, while PVC values remained unchanged; while in China, Jiang and Zhang, (2003) examined Fe concentrations, 0, 30, and 60 mg/kg feed
and reported that low Fe level in diets decreased feed conversion ratio and increasing Fe level increased weight gain. The findings of the present study are further supported by Peket al., (2005) who determined the effects of different amounts of iron on body weight gain, feed consumption, feed efficiency and some blood parameters and reported that supplementation of 100 mg/ kg feed Fe significantly increased body weight gain, feed consumption and feed efficiency; while Skrivan et al., (2005) recommended 120 mg of Fe / kg for high broiler growth. The comparison of the findings of present study with the results reported by various researchers from different parts of the world, it can be concluded that iron concentration of 160 mg /kg feed could be most beneficial and economical range for quantitative meat and profitable broiler production may be due to iron produce connective tissue within the body, maintain immune system, carries oxygen within the body and iron metal complex that binds molecular oxygen in the lungs and carries it to all of other cells within the body (e.g. muscles) that needs oxygen to perform their activities.
can be supplemented for better broiler performance. Studies on meat quality are recommended. Feed manufactures are suggested that the broiler ration may be formulated with iron supplementation for better net return of farmers.
References
[1] Abbasi IHR, HA. Sahito, F. Abbasi, MA. Kalwar, AA. Soomro, DR. Menghwar, M. Memon, MI. Sanjrani. 2013. Management and production of live stock and poultry through advance techniques in Sindh, Pakistan. International J. Innovative Agri. & Biology Res., 1(1): 31-42.
[2] Abro, MR, HA. Sahito, A. Memon, RN. Soomro, H. Soomro and NA. Ujjan. 2012. Effect of various protein source feed ingredients on the growth performance of broiler. International J. Medicinal Plant Res., 1(4): 038-044.
[3] Bhatti, MY. 2001. Emerging prospectus of poultry production in Pakistan at the dawn of 21st century monthly Agro- Vet. News (Oct-2001), Mehmoodcentre, bc-11, block9, Clifton, Karachi.20.
[4] Gomez, KA and AA. Gomez. 1984. Statistics for Agriculture research (2nd edition), John Wiley and sons, New York.
[5] Huff, WE., CF. Chang, MF. Warren and PB. Hamilton. 1997. Ochratoxin a- induced iron deficiency anemia. Appl. Environ. Microbiol. J. of An. Sci., 39(5):7-8.
[6] Julio, L. P., JL. Gerger, ME. Cook and LJ. Stahl.1998. Iron metabolism in chicks fed various levels of zinc and copper. Dept: of nutritional sciences and poultry sciences, university of Wisconsin, Madison, WI, USA. The J. Nutr. Bioch., 3(3): 140-145.
[7] Larry, L. B .1995. Trace minerals: keys to immunity. Animal science. University of Illinois. Pp: 55.
[8] Micheal, WK. 2006. Medical biochemistry. IU iron introduction, school of medicine. 15: 9-24.
[9] Pecelunas, KS., DP. Wages and JD. Helm. 1999. Botulism in chickens associated with elevated iron levels. Avian Dis. 43(4):783-787.
[10] Pek, H., M. Avci, M. Yertk and N. Aydlek. 2005. Effects of copper and iron addition to diets on growth performance and some blood parameters in quail. Veteriner. Bilimleri. Dergisi., 21(1/2):45-50.
[11] Ruiz, J A., AM. Perez-Vendrell and EE. Garcia. 2000. Effect of dietary iron and copper on performance and oxidative stability in broiler leg meat. 290 ASL, deptt of aimal sciences, 1207 West Gregory Drive, Urbana, IL 61801. Br. Poul. Sci., 4:163-167.
[12] Sahito HA, RN. Soomro, A. Memon, MR. Abro, NA. Ujjan and A. Rahman. 2012. Effect of fat supplementation on the growth, body temperature and blood cholesterol level of broiler. Glo. Adv. Res. J. Chem. and Mat. Sci., 1(2): 023-034.
[13] Skrivian, M., V. Skrivanova and M. Marounek. 2005. Effect of dietary zinc, iron and copper in layer feed on distribution of these elements in eggs, liver, excreta, soil and herbage. Research institute of animal production, Prague, CZ, Czech republic. Poult. Sci., 84(10) 1570-1575.
[14] Soomro H, MI. Rind, SN. Sanjrani, AS. Magsi, GS. Barham, SA. Pirzada and HA. Sahito. 2013. Effect of partial mango pulp mixing in ration on behaviour and production of broiler. International J. Plant and Animal Sci., 1(1): 030-036.
[15] Uthman, Ed. MD. 1998. Iron and its metabolism. Nutritional anemias, diplomate, American board of pathology. 24.