INTERNATIONAL JOURNAL OF PHARMACEUTICAL, CHEMICAL AND BIOLOGICAL SCIENCES
Available online at
www.ijpcbs.com
DEVELOPMENT AND VALIDATION OF RP-HPLC METHOD FOR
QUANTITATIVE ANALYSIS OF FAROPENEM IN PURE AND
PHARMACEUTICAL FORMULATIONS
G. Raveendra Babu
1, A. Lakshmana Rao
2* and J. Venkateswara Rao
31
D.C.R.M. Pharmacy College, Inkollu- 523 167, Andhra Pradesh, India.
2
V.V. Institute of Pharmaceutical Sciences, Gudlavalleru- 521 356, Andhra Pradesh, India.
3Sultan-Ul-Uloom College of Pharmacy, Hyderabad- 500 034, Andhra Pradesh, India.
INTRODUCTION
Faropenem (Figure 1) is chemically (5R,6S,8R,2'R)-2-(2'-tetrahydrofuryl)-6-(1-hydroxyethyl)-2-penem-3-carboxylic acid1.
Faropenem is a novel beta-lactam antibiotic sharing similarities with both the penicillin and cephalosporins2. Faropenem is indicated in acute
bacterial sinusitis, community acquired pneumonia, acute exacerbations of chronic bronchitis, uncomplicated skin and skin structure infections and urinary tract infections3. It exhibits
a broad spectrum of activity that includes Gram-negative, Gram-positive and some anaerobic bacteria4. The primary mode of action of
Faropenem is consistant with that of other beta-lactam antibiotics namely binding to penicillin-binding proteins. Literature survey revealed that few analytical methods such as spectrophotometric5-8, HPLC9-15 and LC-MS16-17
methods have been reported. Hence a new sensitive and efficient HPLC method was developed and validated as per ICH guidelines for the assay of the drug Faropenem in tablet formulations.
EXPERIMENTAL Instrumentation
To develop a high pressure liquid chromatographic method for quantitative estimation of Faropenem using Waters HPLC system on Inertsil C18 column (150 mm x 4.6 mm, 5μ) was used. The instrument is equipped with a LC 20AT pump for solvent delivery and variable wavelength programmable LC 7000 UV detector. A 10 μL Rheodyne injector port was used for injecting the samples. Data was analyzed by using Empower2 software.
Chemicals and solvents
Faropenem was provided as gift sample by Spectrum Labs, Hyderabad, India. All the chemicals potassium dihydrogen phosphate, orthophosphoric acid, triethylamine were of AR grade and methanol of HPLC grade were purchased from Merck Specialities Pvt. Ltd., Mumbai, India. Commercial tablets of Faropenem were purchased from local market.
Research Article
ABSTRACT
A validated simple, sensitive, specific and precise RP-HPLC method was developed for the determination of Faropenem in pure and pharmaceutical formulations. Method was carried on
Inertsil C18 column (150 mm x 4.6 mm, 5 μ particle size) using phosphate buffer:methanol (55:45
v/v) as mobile phase. Detection was carried out by UV at 316 nm. The proposed method obeyed
linearity in the range of 80-600 μg/mL and met all specifications as per ICH guidelines. Statistical
analysis revealed that this method can be used in routine quality control studies of Faropenem in pure and its pharmaceutical formulations.
Preparation of the mobile phase
Phosphate buffer was prepated by accurately weighed 2.72 gm of potassium dihydrogen phosphate in 1000 mL volumetric flask, added about 900 mL of Milli-Q water and sonicated to dissolve and make up to the final volume with milli-Q water. 1 mL of triethylamine was added and then pH is adjusted to 3.8±0.5 with orthophosphoric acid solution. 550 mL of phosphate buffer was mixed with 450 mL of methanol was used as mobile phase. The solution was degassed in an ultrasonic water bath for 5 minutes and filtered through 0.45 µm filter under vacuum. The solvent water was used as diluent.
Preparation of standard drug solution
100 mg of Faropenem was accurately weighed, transferred to 100 mL volumetric falsk and is dissolved in 70 mL of the mobile phase. Sonicated the solution for few minutes to dissolve the drug completely. Then it is filtered through 0.25 μm filter and the volume is made up to 100 mL with mobile phase to get a concentration of 1 mg/mL (free base) stock solution. This solution is further diluted with same solvent to obtain required working standard concentrations.
Preparation of sample solution
20 commercial tablets of Faropenem were finely powdered and the powder equivalent to 0.1 mg of Faropenem was accurately weighed and transferred to 100 mL volumetric flask and dissolved in 70 mL of mobile phase. The above solution was subjected to sonication for 15 min. After getting clear solution it is filtered through 0.25 μm filter and the solution is made up to 100 mL with mobile phase resulting in preparation of 1 mg/mL solution. This is further diluted so as to obtain required concentration of Faropenem pharmaceutical dosage form.
Methodology
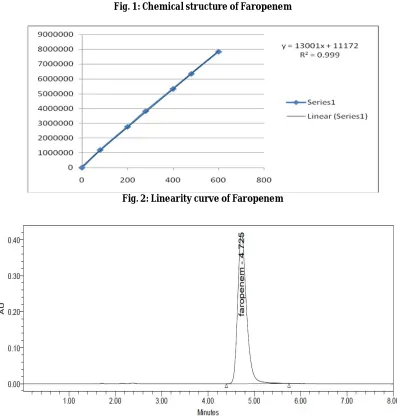
The HPLC system was stabilized for thirty minutes by passing mobile phase, detector was set at 316 nm, flow rate of 1.0 mL/min to get a stable base line. One blank followed by six replicates of a single standard solution was injected to check the system suitability. Six replicates of each standard solutions 80, 200, 280, 400, 480, 600 μg/mL were injected. Calibration graph was plotted by concentration of Faropenem on X-axis and peak area on Y-axis and linearity curve was shown in Figure 2. The amount of drug present in sample
Chromatographic conditions for estimation of Faropenem were described in Table 1.
Pharmaceutical formulations
Prepared dilution of pharmaceutical formulation is injected and the procedure described under bulk samples was followed. The amount of drug present in sample was computed in calibration graph. The assay results in commercial formulations of Faropenem were described in Table 2.
RESULTS AND DISCUSSION
The objective of the present work is to develop simple, precise and reliable HPLC method for the analysis of Faropenem in bulk and pharmaceutical dosage form. This is achieved by using the most commonly employed column Inertsil C18 detection at 316 nm. The representative chromatogram indicating Faropenem is shown in Figure 3.
Parameter fixation
In developing this method, a systemic study of effects of various parameters was under taken by varying one parameter at a time and controlling all other parameters. The following studies were conducted for this purpose.
Stationary phase characteristics
Based on nature and solubility characteristics of Faropenem, reverse phase mode of HPLC was selected for chromatography. Among different RP-HPLC stationary phases tried Inertsil C18 column was found to be optimum.
Mobile phase characteristics
In order to get sharp peak with base line separation from interfering peaks carried out a number of experiments by varying the composition of solvents and mobile phase flow rate. To have an ideal separation of the drug under isocratic conditions, mixtures of solvents like potassium dihydrogen phosphate, orthophosphoric acid, methanol with different buffers in different combinations were tested as mobile phase. A mixture of phosphate buffer: methanol in the ratio 55:45 v/v was proved to be the most suitable of all the combinations, since the chromatographic peak obtained was better defined and resolved and almost free from tailing.
and the regression equation was found to be y=13001x+11172 and correlation coefficient was found to be 0.999 and the results are given in Table 3.
Precision
Precision is the degree of repeatability of an analytical method under normal operational conditions. Precision of the method was performed as intra-day precision and inter-day precision.
Intra-day precision
To study the intra-day precision, six replicate standard solutions (200 ppm) of Faropenem were injected. The percent relative standard deviation (%RSD) was calculated and it was found to be 0.40 which are well within the acceptable criteria of not more than 2.0.
Inter-day precision
To study the inter-day precision, six replicate standard solutions (200 ppm) of Faropenem were injected. The percent relative standard deviation (%RSD) was calculated and it was found to be 0.50 which are well within the acceptable criteria of not more than 2.0.
Specificity
The effect of wide range of excipients and other additives usually present in the formulation of Faropenem in the determinations under optimum conditions were investigated. Chromatographic parameters maintained are specific for Faropenem.
Ruggedness
The ruggedness of the method was determined by carrying out the experiment on different instruments like Shimadzu HPLC, Agilent HPLC and Water’s Breeze HPLC by different operators using different columns of similar type like Hypersil C18, XDB C18, Hibar C18, Kromasil C18 and Inertsil C18 and didn’t show any significant change.
Limit of detection and limit of quantification A calibration curve was prepared using concentrations in the range of 80-600 μg/mL (expected detection limit range). The standard deviation of Y-intercepts of regression line was determined. The LOD and LOQ of Faropenem was 0.105 and 0.320 µg/mL, respectively.
Accuracy
The accuracy of the method was determined by standard addition method. A known amount of standard drug was added to the fixed amount of pre-analyzed standard solution. The standard addition method was performed at 50%, 100% and 150% level of 200 ppm. The solutions were analyzed in triplicate at each level as per the proposed method. The percent recovery and %RSD was calculated and results are presented in Table 4. Satisfactory recoveries ranging from 99.01% to 101.64% were obtained by the proposed method. This indicates that the proposed method was accurate.
Robustness
Robustness of the method was determined by making slight changes in the chromatographic conditions. It was observed that there were no marked changes in the chromatograms, which demonstrated that the RP-HPLC method developed is robust.
System suitability
A system suitability test was performed to evaluate the chromatographic parameters (number of theoretical plates, tailing of the peak) before the validation runs. The results of system suitability parameters were given in Table 5. The analytical method validation was carried out as per ICH method validation guidelines18.
CONCLUSION
Fig. 1: Chemical structure of Faropenem
Fig. 2: Linearity curve of Faropenem
Table 1: Optimized chromatographic conditions of Faropenem
S. No. Parameter Condition
1 Mobile phase Phosphate buffer:methanol (55:45, v/v)
2 pH 3.8
3 Diluent Water
4 Column Inertsil C18 column (150 mm x4.6 mm, 5μ)
5 Column temperature 30°C
6 Wave length 316 nm
7 Injection volume 10 µL
8 Flow rate 1.0 mL/min
9 Run time 8 min
10 Retention time 4.725 min
Table 2: Assay results
S. No. Formulation Label claim Amount found %Assay
1 DUONEM 200 mg 199.14 mg 99.57%
Table 3: Linearity results of Faropenem
S. No. Concentration in μg/mL Area
1 80 1183482
2 200 2762761
3 280 3828908
4 400 5344141
5 480 6345780
6 600 7839115
Table 4: Recovery results of Faropenem
Table 5: Summary of validation parameters of Faropenem
S. No. System suitability Results
1 Linearity range (μg/mL) 80-600
2 Correlation coefficient 0.999
3 Theoretical plates (N) 3147
4 Tailing factor 1.30
5 LOD (μg/mL) 0.105
6 LOQ (μg/mL) 0.320
Level Conc. (μg/mL)
Conc. added (μg/mL)
Conc.
recovered % Recovery
50%
400 200 201.14 100.57
400 200 199.14 99.57
400 200 200.28 100.14
100%
400 400 402.48 100.62
400 400 396.06 99.01
400 400 402.37 100.59
150%
400 600 609.86 101.64
400 600 603.05 100.50
REFERENCES
1. Milazzo I, Blandino G, Caccamo F, Musumeci R, Nicoletti G and Speciale A. Faropenem, a new oral penem: antibacterial activity against selected anaerobic and fastidious periodontal isolates. J Antimicrob Chemother. 2003;51(3): 721-725.
2. Critchley IA, Brown SD, Traczewski MM, Tillotson GS and Janjic N. National and regional assement of antimicrobial resistance among community-acquired respiratory tract pathogens identified in a 2005-2006 U.S. Faropenem surveillance study. Anti Microb Agents Chemother. 2007;51(12): 4382-4389.
3. Mushtaq S, Hope R, Warner M and Livermore DM. Activity of Faropenem against Cephalosporin-resistant Enterobacteriaceae. J Antimicrob Chemother. 2007;59(5): 1025-1030. 4. Gettig JP, Crank CW and Philbrick AH.
Faropenem medoxomil. Ann Pharmacother., 2008;42(1):80-90. 5. Shi S and Shen J. Determination of the
dissolution of Faropenem sodium tablets by UV-spectrophotometry. China Pharm. 2006;21.
6. Jamili Reddy K, Shanmukha Kumar JV and Vardhan VM. Spectrophotometric methods for the determination of new oral penem (Faropenem) in pure and in formulations. Chem Sci Trans. 2013; 2(3):936-940.
7. Judyta CP. Derivative spectrophotometry for the determination of Faropenem in the presence of degradation products: an application for kinetic studies. Appl Spectrosc. 2013;67(7): 703-708.
8. Darji DN, Desai DG, Zanwar A, Sen AK and Seth AK. Development and validation of UV spectroscopy method for the estimation of Faropenem sodium in bulk and dosage form. Pharma Sci. Monitor, 2013; 4(3):10-17.
9. Ramakrishna VSN, Vishwottam NK, Wishu S and Koteshwara M. Quantification of Faropenem in human plasma by high-performance liquid chromatography. Arzneimittel-Forschung. 2005;55(12): 762-766.
10. Hu Y, Zhang W, Wang Y and Hou Y. HPLC determination of Faropenem sodium in
11. Sun Y, Zhao L, Qiu F and He X. Determination of Faropenem for injection in human plasma and urine by high performance liquid chromatography. Chinese J New Drugs and Clin Remedies, 2007; 10.
12. Shobana KM, Jayesh GP and Ravindra VP. Development and validation of a stability indicating LC method for the determination of Faropenem in pharmaceutical formulations. Chromatographia, 2009; 69(9-10):1013-1018.
13. Rui X, Jun W, Hua W, Guorong F and Dabing Z. High-throughput determination of Faropenem in human plasma and urine by on-line solid-phase extraction coupled to high-performance liquid chromatography with UV detection and its application to the pharmacokinetic study. J Pharm Biomed Anal. 2010;52(1): 114-121.
14. Rizwana I, Vanitha Prakash K and Krishna Mohan G. Analytical method development and validation for the estimation of Faropenem in bulk and pharmaceutical formulation using the RP-HPLC method. Int Res J Pharm., 2012;3(12):81-83. 15. Cielecka-Piontek J, Krause A and
Paczkowska M. An application of high performance liquid chromatographic assay for the kinetic analysis of degradation of Faropenem. Die Phamazie. 2012; 67(11): 912-916.
16. Gao S, Chen W, Tao X, Miao H, Yang S and Wu R. Determination of Faropenem in human plasma and urine by liquid chromatography-tandem mass spectrometry. Biomed Chromatogr. 2008;22(1): 5-12.
17. Zhang Q, Jia Z, Wang R, Fan P and Chen M. Determination of plasma concentration of Faropenem by LC-MS/MS. China Pharm. 2009;17.