Link Optimisation for Optical WDM
Transmission Systems
A thesis submitted for the degree of
Doctor of Philosophy
in Electronic and Electrical Engineering
M arch 1998
Derek Malcolm Rothnie
U C L
ProQuest Number: U642814
All rights reserved
INFORMATION TO ALL USERS
The quality of this reproduction is dependent upon the quality of the copy submitted.
In the unlikely event that the author did not send a complete manuscript and there are missing pages, these will be noted. Also, if material had to be removed,
a note will indicate the deletion.
uest.
ProQuest U642814
Published by ProQuest LLC(2016). Copyright of the Dissertation is held by the Author.
All rights reserved.
This work is protected against unauthorized copying under Title 17, United States Code. Microform Edition © ProQuest LLC.
ProQuest LLC
789 East Eisenhower Parkway P.O. Box 1346
Acknowledgements
A fter three (and a bit!) years of work I wish to take this opportunity to express my
gratitude to my supervisor, Professor John M idwinter, for his guidance, insights,
encouragem ent and good hum our during my studies at U CL, to Dr. Polina Bayvel for her
knowledge and advice and the enthusiasm she brought to the Optical N etw orks G roup, to
OPT Ltd. for their financial support of this research and, in particular. Dr. Anthony
Thorley of O PT w ho was helpful and always generous with his time.
Thanks m ust also go to Dr. Fabrizio Di Pasquale for num erous helpful
discussions and my two other Italian friends, Stefano Baroni and Paolo G am bini, along
with the rest o f the Optical N etw orks group: Dr. Feodor Timofeev, Vitaly M ikhailov,
Hans Jorg Thiele and W olfgang Zieler.
I w ould also like to say thanks to those friends who helped lightened the
atm osphere of R oom 621: Céline, Victoria, Paula, Brian, Jorge, D ave and Chris.
And, last but by no means least, there are a num ber people w hom I feel deserve a
special thanks, w ho helped make these past three years so enjoyable, so if I say, thank
you to “my friends from Langton Close” and those “north o f the border”, they’ll know
Abstract
This thesis investigates the optimal transm ission parameters required for
wavelength division multiplexing (WDM) of high bit-rate channels over non-linear,
dispersion m anaged fibre. W ith the availability of high pow ered laser sources, the advent
of optical amplifiers and the long distances of some fibre netw orks the nonlinearity of the
fibre m edium can no longer be neglected. The non-linear optical K err effect is introduced
in the context of fibre transm ission and the three effects resulting from this non-linearity
are presented, viz. Self-Phase Modulation (SPM ), C ross-Phase M odulation (XPM ) and
Four-W ave M ixing (FW M ). The non-linear scattering processes o f Stimulated Brillouin
Scattering (SBS) and Stimulated Raman Scattering (SRS) are also outlined. The
detrimental impact of fibre dispersion is given and various schemes proposed to manage
fibre dispersion are discussed with emphasis placed upon the use of Dispersion
Compensating Fibre (DCF) for upgrading existing, embedded standard fibre. To
accurately model signal propagation over such complex links the numerical Split-step
Fourier method was employed to solve the N on-Linear Schrodinger Equation. The
limitations inherent in this method are investigated, specifically the step-size effect which
determines the accuracy o f the calculations. The initial investigations by simulation
concern the propagation of a single channel over the various dispersion m anaged systems.
The maximum distances achievable in terms of channel bit-rate and channel pow er due to
the combined action of dispersion and non-linearity (from SPM ) are com pared. The
limitations from FW M and X PM on multi-channel propagation are then examined and
optimisation o f the WDM parameters: channel spacing, channel pow er and channel bit-
rate, are determined. The conclusion draws together the results obtained and presents
optimal operating parameters for W DM systems. Possible avenues for further research are
~ C
o n ten ts1. In t r o d u c t i o n...1
1.1 Ov e r v i e w...2
1.2 St r u c t u r eo ft h et h e s i s... 3
1.3 Or ig in a l Co n t r ib u t io n s...4
1.3.1 P u blication s...5
2. Th e o r y... 6
2.1 In t r o d u c t i o n... 7
2.2 Th e No n l in e a r Sc h r o d in g e r Eq u a t io n...7
2.3 L i n e a r P r o c e s s e s ... 8
2.3.1 A ttenuation...8
2.3.2 L oss-L im ited D ista n c e...9
2.3.3 E ffective L en g th...10
2.3.4 D isp e rsio n...11
2.3.5 Gaussian P ulses in D ispersive M e d ia...11
2.3 .6 C hirped P u ls e s...13
2.3 .7 D ispersion -L im ited D ista n c e...14
2.4 No n l in e a r Pr o c e s s e s...16
2.4.1 Self-Phase M odu lation...17
2.4.2 C ross-Phase M odulation...23
2.4.3 Four-W ave M ixing...25
2.4.4 M odulation In sta b ility...32
2.4.5 Stim ulated Scattering P ro ce sse s...35
2.5 R e f e r e n c e s ...39
3. An a l y t i c Me t h o d o l o g y... 4 1 3.1 In t r o d u c t i o n...42
3.2 Th e Sp l it-St e p Fo u r ie r Me t h o d...42
3.3 SPLIT-STEP Fo u r ie r Me t h o d Lim i t a t io n s...45
3.3.1 Fast-Fourier Transform Frequency Range...4 5 3.3.2 Step-size Effect...4 6 3.4 Th e Sy s t e m Mo d e l... 50
3.4.1 Transm itter and R eceiver M odels...50
3.4 .2 A m plifier M o d e l...57
3.5 Sy s t e m Pe r f o r m a n c e; As s e s s m e n tm e t h o d s...52
3.5.2 Q -F actor...54
3.6 Va l id a t in gt h e Nu m e r ic a l Mo d e l... 56
3.7 Mo d e l l in g Ca p a b il it ie s...61
3.8 Re f e r e n c e s... 62
4 . Li t e r a t u r e Re v i e w...6 4 4.1 In t r o d u c t i o n... 65
4.2 Sin g l e Ch a n n e l: Dis p e r s io na n d SPM Lim i t s... 65
4.3 Mu l t ip l ec h a n n e l s: Av o id in g Aq... 69
4.4 Am p l if ie r Sp a c in g - F W M Re s o n a n c e... 71
4.5 F W M Su p p r e s s io n Te c h n i q u e s... 73
4.6 Dis p e r s io n Ma n a g e m e n t... 77
4.6.1 A ll-F ibre D ispersion C om pen sation...78
4.6.2 Chirped Fibre G ratings...81
4.6.3 O ther D ispersion com pensation Techniques...82
4.7 Fib r e Co m p e n s a t o r s... 83
4.7.1 D ispersion Com pensation Interval...84
4.7.2 D egree o f D ispersion C om pensation...87
4.7 .3 Location o f Com pensator: Pre- versus P ost-C om pen sation...88
4.7 .4 D ispersion C om pensated S o ld o n s...89
4.8 X P M Ef f e c t s... 90
4.9 Mo d u l a t io n In s t a b il it y... 93
4.1 0 Po l a r is a t io n Mo d e Dis p e r s io n...95
4.11 St im u l a t e d Ra m a n Sc a t t e r in g... 96
4.12 Opt ic a l Am p l if ie r sf o r W D M t r a n s m is s io n...97
4.13 Co n c l u s io n...98
4.14 Re f e r e n c e s... 100
5 . Si n g l e Ch a n n e l Re s u l t s... 1 0 8 5.1 Dis p e r s io n Ma n a g e m e n t Sc h e m e s...109
5.2 In t r o d u c t i o n... 109
5.2.1 Fibre Link Param eters...109
5.3 Al t e r n a t in g-Sig n Dis p e r s io n Sh if t e d Fib r e...I l l 5.3.1 Perform ance o fD S F Configurations...I l l 5.3 .2 GVD an d SPM in the D SF M anaged S ch em e...116
5.3 .3 D iscu ssion...118
5.4 Dis p e r s io n Sh ift e d Fib r e Co m p e n s a t e db y St a n d a r d Fi b r e... 121
5.4.1 Perform ance o f the D SF with SM F a s C om pensator...121
5.5 St a n d a r d Fib r ea n d Dis p e r s io n Co m p e n s a t in g Fib r e... 125
5.5.1 Com parison o f Pre- and P ost-C om pensation Using D C F ...126
5.5 .2 P ulse E volution within SM F with D C F...128
5.5.3 Transmission D istances and Channel B it-R a te...134
5.5 .4 Inexact Com pensation within SM F an d D C F spans...135
5 .5 .5 SM F A n d D C F In The P resen ce O fA S E N o ise...138
5.6 Dis c u s s io na n d Co n c l u s io n...142
5.7 Re f e r e n c e s...145
6 . Mu l t i p l e Ch a n n e l Re s u l t s...1 4 6 6.1 In t r o d u c t i o n... 147
6.2 F W M IN D is p e rs io n M a n a g e d S c h e m e s ... 147
6.3 X P M IN D is p e r s io n M a n a g e d S c h e m e s ... 150
6.3.1 Pulse Walk-Through, Channel Spacing an d B it-ra te...150
6.3.2 Influence o f N eighbouring B it-rate...157
6.3.3 A ccum ulation o f D ispersion in W DM sy stem s...163
6.4 Gr a n u l a r it y... 164
6.5 L im its Im p o se d b y SRS... 180
6.6 Co n c l u s io n... 182
6.7 Re f e r e n c e s...183
7. Co n c l u s i o n...1 8 4 8. Fu t u r e w o r k...1 8 9 9. Ap p e n d i c e s...1 9 4 Ap p e n d ix A ... 195
Ap p e n d ix B ...201
~ L
is t o fF
ig u r e s~
Ch a p t e r 2
2.1 Spectral attenuation of a low-loss silica fibre, [2],
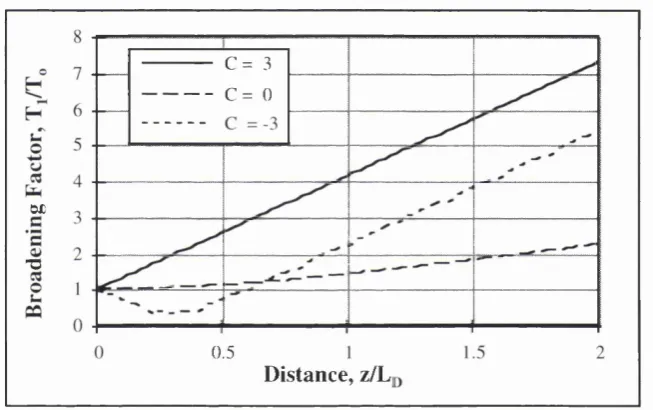
2.2 Broadening factor of Gaussian pulses initially chirped ( C = ± 3 ) or unchirped (C=0) with propagating distance (normalised by the dispersion length Lp) in normal dispersion (P2 >
0)-2.3 Dispersion-limited distances of fibre with dispersion of +17 and +1 ps/nm/km and zero dispersion with +0.07ps/nm^/km slope.
2.4 Gaussian (m=l) and super-Gaussian (m = 3 ) pulse shapes and dynamic frequency change (or chirp) induced by the SPM effect.
2.5 The maximum efficiency of FWM (setting sin^()=l in equation (2.45)) in four types of fibre (with dispersion ranging from 1 to 100 ps/nm/km) and with increasing channel spacing.
2.6. Schematic of the output spectrum of a 3 channel system after FWM generation with (a) uniform and (b) non-uniform channel spacing.
2.7 Number of FWM products at frequency positions relative to the central channel for 2 to 32 input equally spaced channels
2.8 Modulation Instability gain spectrum in fibres with anomalous dispersion of magnitude (a) 0.5ps/nm/km and (b) 17ps/nrn/km for three input powers.
2.9 Raman gain coefficient (solid line) as a function of wavelength separation with the triangular approximation (dotted line).
Ch a p t e r 3
3.1 Schematic of the split-step method with step-size dz for the linear and nonlinear operations over the length of the fibre.
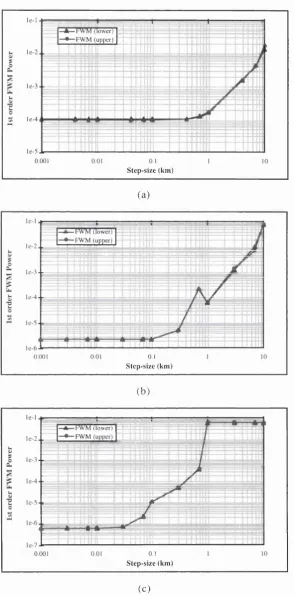
3.2 Upper and lower first order FWM power (arbitrary units) as a function of the numerical step-size, for two 5mW CW channels spaced lOOGHz apart, after fibre with dispersion and length of (a) 5ps/nm/km and 50km (b) 20ps/nm/km and 50km (c) lOOps/nm/km, 10km.
3.3 Schematic of an eye-diagram (i) before and (ii) after transmission with input (iip) and output (iop) eye opening indicated.
3.4 Probability distributions of the zero and one levels (assumed Gaussian distributions with mean and standard deviation |l and s) with decision level D and shaded area corresponding to the bit-error rate.
3.5 3 CW inputs and FWM components generated after 500km of DSF from three separate models (a) undepleted pump approximation [23] (b) split-step method implemented by the author (c) split-step method implemented by [24].
3.6 Evolution of total channel and FWM powers for an ideal, dispersionless and lossless fibre calculated from the numerical algorithm and the undepleted pump approximation.
3.7. Comparison of eye-opening penalty with distance for a lossless fibre at three different peak input powers (a) from [18] (b) from author’s numerical simulation.
3.8 Comparison of Q from the analytic expression (solid lines) and simulation (dashed lines) versus span number at three bit-rates (linear, dispersionless fibre with span loss of 15.6dB).
Ch a p t e r 4
4.1 IdB Eye-opening penalty transmission distances for increasing fibre dispersion and various peak input powers. After [2]
4.2 Channel spectrum (a) after 9000km of zero dispersion fibre (input spectrum) (b) after 9000km of -0.2ps/nm/km fibre (150 x 60km spans, 10.5dB loss per span, 3rd order Butterworth filter after each gain-equals-loss amplifier) after [3]
4.3 Number of mixing products generated by the FWM effect within the system bandwidth for (a) equally and (b) unequally spaced channels. The arrows point to the channel locations. From [21]
4.4 Schematic displaying possible dispersion intervals for (a) pre- and (b) post compensation: (i) per link (ii) per span (iii) before/after several spans.
4.5 Three dispersion maps used in [73] where the accumulated dispersion is either (a) all negative (b) both positive and negative or (c) all positive.
4.6 The optical intensity of an 8-bit sequence of ones and spectra for 20Gb/s NRZ channel after 560km of DSF with (a) normal and (b) anomalous dispersion, from [102].
Ch a p t e r 5
5.1 Schematic of the dispersion-managed, optical transmission system modelled.
5.2 EoP with distance and input peak powers for DSF compensated link with (a) 25km of - 0.5ps/nm/km followed by 25km of +0.5ps/nm/km (b) 25km of +0.5ps/nm/km followed by - 0.5ps/nm/km.
5.3 EoP with distance and input peak powers for DSF compensated link as in Figure 5.2 but with dispersion of ±4ps/nm/lmi.
5.4 Ey e-diagrams at 500km in DSF ±4ps/nm/km (a) +/- DSF and (b) -/+DSF arrangements.
5.5. Comparison of dispersion managed pairs of DSF with absolute values of dispersion of 0.5, 1, 2, 4 ps/nm/km in configurations (a) +/-DSF and (b) -/+DSF.
5.6 Negative EoP evolution with distance for the -/+DSF configuration with increasing dispersion, Ppeak = 6mW.
5.7 1 and 3 dB EoP transmission distances versus the ratio of dispersion to nonlinear lengths with Ppeak = 6mW for various magnitudes of dispersion in the -/+DSF configuration.
5.8 Maximum EoP versus ratio of dispersive to nonlinear lengths in the -/+DSF configuration with Ppeak= 6mW for various magnitudes of dispersion.
5.9 Comparison of 3dB EoP Transmission distance versus input Ppeak in the two DSF configurations with fitted curves (equations (5.1) and (5.2) in the text).
5.10 EoP with distance for a single lOGb/s channel over DSF compensated by SMF for DSF of various dispersions and Ppeak between 2 and 10 mW.
5.11 EoP with distance and various dispersions of the DSF in a SMF+DSF compensated span with Ppeak of 4mW.
5.13 3dB EoP Transmission distance versus input Ppeak in DSF+SMF compensation scheme.
5.14 SMF spans pre- and post-compensated by DCF (a) FoP against distance (with and without 3rd order dispersion) at Ppeak = 6mW (b) 3dB transmission distances as a function of peak input power.
5.15 FoP with distance over pre- and post-compensated spans of SMF employing either a linear and lossless (broken lines) or nonlinear and lossy (solid lines) DCF compensator.
5.16 The dispersion map and relative optical power within one 50km span of SMF with wither pre- or post-compensation by DCF.
5.17 Single superGaussian pulse (4mW peak power) transmitted over 3000km of SMF and DCF spans, (a) optical pulse shape (b) optical spectrum (c) pulse and spectral widths.
5.18 Effect on FoP of optical filter bandwidth at 3000km for a 4mW channel.
5.19 High powered (250mW) pulse train through one SMF span with pre- or post compensation by DCF at (i) input (ii) end of fibre 1 (DCF or SMF) (iii) end of fibre 2 (SMF or DCF) and (iv) eye-diagram at end of each span.
5.20 3dB transmission distances for a single channel over pre-compensated 50km-SMF spans with carrier frequency offset.
5.21 FoP transmission distances for a single channel over pre-compensated SMF with (a) unmatched length of SMF (Ppeak of 4 and 6 mW) for 8.5km of DCF and (b) unm atched length of DCF (Ppeak of 4mW) for 50km of SMF.
5.22 Q-factor against peak input power and increasing link length for 50km-span SMF with (a) post- and (b) pre- compensation by 8.5km DCF.
5.23 Comparison of 3dB transmission distances against peak input power for the dispersion managed -/+DSF scheme (4ps/nm/km) with span lengths of 50 and 75 km
Ch a p t e r 6
6.1. First order FWM power generated by a two channel system (5mW cw) versus channel spacing for three 50 km dispersion managed spans: (a) 50 km DSF (-/+1 ps/nm/km) (b) SMF+DCF (50km +17ps/nm/km, 8.5km -lOOps/mWkm) and (c) DCF+SMF.
6.2 First order FWM power generated by a two channel system (50GHz spacing) versus channel input power for three 50 km dispersion managed spans (parameters in Figure 6.1).
6.3 Spectral simulation comparing FWM powers generated within 5 dispersion compensated spans of fibre (±DSF (grey line) and DCF+SMF (black line)) for two intensity modulated input channels.
6.4 Channel spacing dictated by bit-rate to ensure complete pulse walk-through after one effective length of dispersive fibre for (a) DCF, -lOOps/nm/km (b) SMF, +17ps/nm/km (c) DSF, +4ps/nm/km (d) spacing of 5BR (e) spacing of lOBR.
6.5 Relative time-position, height and width of a lOGb/s pulse at 2km intervals through DCF (-lOOps/nm/km) to a similar pulse (initial shape only) on another optical channel lOOGHz apart.
6.6 (a) The IdB transmission distances for the first channel with increasing channel (b) the spacing FoP of the first 2.5Gb/s channel after 5000km.
6.7 (a) The IdB transmission distances for the first channel with increasing channel spacing (b) the FoP of the first 2.5Gb/s channel after 5000km.
6.8 The EoP of (a) a 5Gb/s and (b) lOGb/s channel alone and in the presence of a CW channel spaced at either 50 or 100 GHz over 50km SMF pre-compensated with 8.5km DCF.
6.9 The EoP of a lOGb/s channel transmitted over 50km SMF pre-compensated by DCF with a neighbouring channel at various bit-rates and increasing channel spacing: (a) 50GHz (b) lOOGHz (c) 200GHz. Each channel is modulated by a ‘0101...’ pattern.
6.10 The EoP of a lOGb/s channel transmitted over 50km SMF pre-compensated by DCF with two neighbouring channels at various bit-rates and increasing channel spacing: (a) 50GHz (b) lOOGHz (c) 200GHz. Each channel is modulated by a ‘0101...’ pattern.
6.11 As for Figure 6.10 but each channel is modulated by a pseudo-random pattern.
6.12 Spectrum of three lOGb/s PRBS channels, 4mW peak power, spaced by 50GHz through pre-compensated SMF spans at 750 and 3000 km, black and grey lines, respectively.
6.13 3dB EoP distances achieved by an 8 x lOGb/s systems with 50, 100 or 200 GHz spacing, transmitted over DCF-t-SMF spans with 4mW peak power per channel.
6.14 (a) EoPs of two 20Gb/s channels, separated by 200GHz, peak input power of 4mW,
transmitted over optically amplified spans of SMF pre-compensated by DCF (with
dispersion slope compensated) (b) and spectrum of system at input and after 1500km.
6.15 (a) EoPs of four lOGb/s channels, separated by lOOGHz, peak input power of 2mW,
transmitted over optically amplified spans of SMF pre-compensated by DCF (with
dispersion slope compensated) (b) and spectrum of system at input and after 7500km.
6.16 (a) EoPs of eight 5Gb/s channels, separated by 150GHz, peak input power of ImW,
transmitted over optically amplified spans of SMF pre-compensated by DCF (with
dispersion slope compensated) (b) and spectrum of system at input and after 8000km.
6.17 (a) EoPs of sixteen 2.5Gb/s channels, separated by 25GHz, peak input power of 0.5mW, transmitted over optically amplified spans of SMF pre-compensated by DCF (with dispersion slope compensated) (b) and spectrum of system at input and after 8000km.
6.18 EoP versus distance and system spectra for (a) a 2 x20Gb/s system and (b) a 4X lOGb/s system through dispersion compensated DSF spans.
6.19 The maximum number of channels limited by SRS imposing a 0.5dB SNR penalty for the DCF-i-SMF system with lOGb/s channels spaced at lOOGhz.
Ch a p t e r 8
~ L
is t o fT
a b l e sCh a p t e r 2
2.1 FWM efficiency within various fibres from fig. 2.5 for channel spacings of 50 or 100 GHz.
2.2. Channel frequency indices i, j and k giving FWM contributions at / = 4 for / = / + j - ^ (from a>i = (û, + cOj - co^) for seven uniformly spaced input frequencies.
Ch a p t e r 4
4.1 Largest bit-rate-distance product over the years 1993 to 1997 from transmission experiment results using dispersion managed DSF.
4.2 Largest bit-rate-distance product over the years 1992 to 1997 from transmission experiment results using SMF with DCF compensation.
Ch a p t e r 5
5.1 Parameters of the fibres employed in the simulations of the dispersion managed systems (see aslo Appendix C).
5.2 3dB Eye-opening Penalty transmission distances for various bit-rates per unit power and distance-bit-rate product for single channel transmission over DCF+SMF pre compensated spans.
Ch a p t e r 6
6.1 Parameters of four systems with equal capacity.
6.2 3dB BoP distances for the 4 systems of equal capacity (increasing granularity) for two types of fibre span; DCF+SMF and DSF (fibre parameters in the text).
C
h a p t e r
1
1.1 Overview
There has been a phenomenal growth in com munications over the last decade:
both in the number of physical networks and the am ount of traffic flow ing across them.
This has evolved in tandem with growth in the tecnologies o f the age, the computer and
softw are industries w hich provide ever faster com puters running ever more complicated
applications which create and need to access ever larger amounts of data. The data has
become multi-media: turning from predominantly voice into data of images and video.
The globalisation o f commerce has also driven the need for inform ation to be readily
accessible from around the world: the scale o f netw orks has increased. To economically
m atch such sustained and growing needs the design and manufacture o f optical networks
m ust be “future p r o o f ’, i.e. they should be designed to gracefully cope with this
relentlessly increasing dem and now and into the foreseeable future.
R esponding to the need for increased transmission capacity over global distances research
into optical fibre system s has exploited fibre’s expansive bandw idth through two main
mechanisms: wavelength division multiplexing (WDM) and fibre amplification. The
amplifier has provided a means by which transm ission of signals can traverse large
distances, independent o f the transmission rates sent (there is no limitation im posed as for
electronic, regenerational repeaters which were inflexible with respect to transm ission
rates). WDM offers a way through the bottleneck o f electronic processing speeds by
increasing the number of optical channels transmitted rather than increasing the
transm ission rate of a single channel. Additional benefits to netw ork perform ance arise for
netw ork management: all-optical networks with wavelength routing capability providing
increased resilience against failure.
The potential benefits o f these solutions are not w ithout cost: such amplified, multiple
channel system s are prone to the effects from the nonlinear nature of fibre which only
becom e apparent w hen high transmission rates, high pow ers or long distances are
encountered. The complexity of designing future-proof transm ission is increased when
the existing linear processes are taken into account. To minimise the impact of these
limiting factors and maximise the capacity o f fibre for optical netw orks the physical
m echanism s and their relationships must be properly understood. Theoretical
understanding o f such optical systems allows them to be accurately modelled w hich, in
turn, provides the route by which optical transm ission links can be simulated, optimised
and refined then tested as practical systems. This fram ew ork can ensure optical networks
1.2 Structure of the thesis
In Chapter 2 the theory describing the propagation of light in nonlinear fibre media
and the governing nonlinear Schrodinger equation (NLSE) is introduced with the
em phasis placed on the effects a fibre can have on pulse propagation. In particular, the
nonlinear character o f the fibre is examined revealing the three manifestations o f the
intensity dependent refractive index: self-phase modulation (SPM ), cross-phase
modulation (XPM ) and four-wave mixing (FWM) along with the linear effects of
dispersion and loss. Also described are the stimulated scattering processes and their
im pact on transmission.
In Chapter 3 the numerical approach taken to model optical channel transm ission is
discussed. Since there are no analytical solutions to the general N LSE introduced earlier,
a numerical algorithm was employed to solve the differential equation. The numerical
algorithm , commonly know n as the split-step Fourier method, is introduced with the
limitations inherent in this method examined and guidelines for the correct implementation
of the numerical method presented. The system model used throughout the thesis is then
discussed, encom passing the pulse modulation form at, the fibre parameters which m ust
be specified, the optical amplifier model em ployed, the optical and electrical filtering
models and finally the two methods used to characterise transm ission performance: the
eye-opening penalty (EoP) and the Q-factor.
In chapter 4 the various solutions, both proposed and dem onstrated, to overcome the
limitations im posed on pulse propagation by nonlinear fibre are reviewed. Dispersion
management is shown to be a viable method o f extending the dispersion limited
transm ission distances whilst mitigating the constraints im posed by some of the three
nonlinear K err effects. The variety of successful dispersion managed system s
presented and the advantages and disadvantages o f such fibre configurations discussed.
F or future upgrading of capacity of conventional fibre the use of dispersion compensating
fibre (DCF) is shown to be highly effective. Studies on the perform ance o f this dispersion
management scheme for both single and multiple channel transm ission is grow ing with
some conflicting results published. Further investigation of this fibre compensation
scheme is necessary and explored within this thesis.
In Chapter 5 the performance of a single channel is studied and compared for various
dispersion m anagement schemes which use either conventional fibre or dispersion-shifted
fibre as the transm ission medium. The optimal configuration for the com pensating and
transm ission fibres is investigated for various transm ission param eters, in particular
also investigated and the optimal transm ission parameters for such system s are then
determined.
In Chapter 6 the performance of dispersion managed conventional fibre for WDM
transm ission is investigated. W ith the underlying performance o f a single channel know n
from the results o f the previous chapter, the effects on performance after introducing
further channels is examined. The relative strengths o f FW M and X PM nonlinear
processes are assessed and in particular, the mechanisms mitigating X PM are explored.
The issue of granularity (bit-rate versus channel number with fixed capacity) o f a system
is investigated and, in conjunction with a simple model o f the Stimulated Raman
Scattering (SRS) process, conclusions about the optimal system parameters for a WDM
transm ission system are drawn.
Chapter 7 provides a summary of the conclusions of the research and Chapter 8 discusses
the possible areas for further research, both by simulation and experimentation.
1.3 Original Contributions
The w ork in the thesis has studied the use of dispersion managed fibre to increase
transm ission capacity o f optically amplified WDM communication system s. In particular
the dispersion com pensation of conventional, standard fibre has been modelled.
A standard numerical algorithm known as the Split-Step Fourier M ethod was em ployed to
solve the nonlinear wave equation for the transmission o f signals through optical fibre.
The accuracy of the numerical method when modelling multiple channel transm ission was
investigated and the constraints imposed upon the maximum step-size of the iteration
within the algorithm was determined. Also, guidelines on the maximum system
bandwidth which can be accurately modelled by the numerical approach are presented.
The performance o f several dispersion management schemes are exam ined and compared.
The configuration o f the transmission fibre and compensating fibre within optically
am plified spans shown to have a significant impact on the perform ance o f optical channels
in terms of eye-penalty. The m ost significant difference is obtained by the positioning of
The performance of a single channel over such conventional fibre is studied in detail with
reference to channel input power, bit-rate, transm ission distance and channel location
relative to the exactly compensated wavelength. An optimal range of input pow er is
found, governed by the desire to maximise the signal-to-noise ratio but limit any nonlinear
distortion imposed on the transmitted channel.
In W D M transmission over dispersion managed conventional fibre it is show n that four-
wave mixing is negligible in comparison to the effects of cross-phase modulation because
of high local dispersion and that the penalty arising from cross-phase modulation penalty
can be minimised if the appropriate parameters are chosen such that pulse w alk-off
conditions are met. The dependence of the impact o f cross-phase modulation on channel
spacing and bit-rate is presented.
Finally, the concept of granularity o f WDM transm ission is introduced and the
performance o f a system with fixed capacity but differing granularity is exam ined. The
granularity giving the best performance is determined by taking into account the
standardisation of channel spacing, available system bandwidth and minimisation o f the
penalty arising from Stimulated Raman Scattering. The performance o f these system s in
dispersion-shifted fibre is m ade for comparison.
1. 3 . 1 Publications
Two articles from this work have been accepted for presentation and publication:
• D. R othnie, W. Zeiler, P. Bayvel and I.E . M idwinter M odelling o f transmission
nonlinearities and fibre parameter optimisation in dense W D M system s with Optical Am plifiers IBE Colloquium on High Speed and Long Distance Optical transm ission
1996 Aston U niversity, Birmingham Ref. N um ber 1996/091 p i 7
• D. Rothnie and I.E. Midwinter Im proved standard fib re performance by positioning
C
h a p t e r
2
2.1 Introduction
This chapter discusses the theory of the mechanisms governing the propagation of
optical pulses through an optical fibre described by the nonlinear Schrodinger equation.
The nonlinear processes are introduced along with system parameters which can
potentially mitigate their effects.
2.2 The Nonlinear Schrodinger Equation
The derivation of the NonLinear Schrodinger Equation (N LSE) from M axw ell’s
equation relating electric field to the induced (nonlinear) polarisation is outlined in
A ppendix A. The resulting description of electric field amplitude A(z, 7) takes the form:
dA
a
d^A
1 _d^A
where z is the distance propagated along the fibre, with time transform ed into a relative
time, T - t - zA , which is a frame o f reference moving with the optical pulse(s) at group velocity Vg. The coefficients on the right-hand side are a, the pow er loss in the fibre in
km ’, p2 and the second- and third-order dispersion parameters in s'^/km and s Vkm,
respectively, and % the nonlinear coefficient in km ’mW ’.
If the reference tim e is normalised by the initial 1/e-pulse width, T^, such that t=T/T^, and the field amplitude by the input pow er through the relation U(z,t) = A(z,T)/^/P^ the N LSE is m odified to
dU _ a
.sgn(p^)d^U
,sgn(P^)d^U
,.\U\^
—— —---
u — I
^ T H---— r "rI
---dz
22Ljj
dT
6L^,
dx
where sgn() is the signum function and the denominators o f the right-hand side are
different scale lengths given by
p2 ^3 1
= (
2
.2
)referred to as the dispersion length, second-order dispersion length and the nonlinear
length, respectively. These characteristic lengths indicate whether the nonlinear or the
dispersive effects will be important within a system. The larger these lengths are
com pared to the fibre length or each other the less dominant their effect will be on pulse
propagation (i.e. their corresponding terms in equation (2.1) will become negligible). For
exam ple, if and « L then dispersion will be the dominant effect within a
length L o f fibre. W hen the lengths are comparable no one effect dominates and the interplay of the effects determines the evolution of pulses along the fibre. Unfortunately
equation (2.0) cannot be solved analytically for such system s and numerical m ethods are
required [1]. Chapter 3 will discuss the numerical method em ployed to model nonlinear,
dispersive transm ission systems.
2.3 Linear Processes
The first three terms on the right-hand side of equation (2.0) are the linear
mechanism s imposed upon the propagating signal: loss and second- and thirdorder GVD.
In the following section the linear dynamics of pulse evolution are exam ined by setting the
nonlinear co-efficient, % equal to zero.
2 . 3 . 1 Attenuation
W ith only loss present in the fibre the NLSE, equation (2.0), reduces to
w hich has the simple solution that the pow er in the fibre decays exponentially with
distance
f (z) = (2.4)
where Pq is the input pow er and z the distance along the fibre. In this expression the fibre
loss has the units km ’ but is more commonly expressed in dB/km converted to these units
a , /g = l O a / l n C l O ) (2.5)
Fibre loss in the 1.0 - 1.8 |im is a result of the intrinsic losses arising from Rayleigh
Scattering (proportional to l/X^) up to 1.6pm and from far infra-red material absorption
resonances beyond this wavelength [1]. The loss peak at 1.27pm and the larger peak at
1.37pm show n in Figure 2.1 results from fundamental vibrational absorption peaks due
to the OH hydroxyl group impurity (originating from water vapour contam ination of the
fibre) and separates the 2nd and 3rd “telecom w indow s” at 1.3 and 1.55 pm . Including
extrinsic losses such as bending loss and splice losses when tw o fibre segm ents are co
joined the typical losses are 0.21 dB/km near 1.55pm.
Loss profile
1.3pm window
0.4 ■s
0.2
Intrinsic loss
w avelength (pm )
Figure 2.1 Spectral attenuation of a low-loss silica fibre, [2].
2 .3 .2 L o s s -L im ite d D ista n c e
To be able to detect and differentiate between Z E R O and O N E pulses, a minimum
pulse energy is required at the detector. In a lossy system there will be a m aximum
distance beyond which the energy within a pulse will have been reduced, through
attenuation, to the m inimum energy. The m inim um pow er required is expressed as
(2.6)
where is the bit-rate and E,, the m inimum energy (the factor of one half accounts for the
maximum distance possible, or the loss-limited distance, is obtained by substituting
P{z) = Pjnin ^ 0 - ^in î"to equution (2.4) which gives
1 0. = - - l o g . „
V J
(2.7)
The advent of the optical amplifier has removed the loss constraint from fibre systems - at
the expense of introducing more noise to the system from amplified spontaneous emission
[3] and increasing the build-up o f the other deleterious effects o f dispersion and
nonlinearity.
2 . 3 . 3 Effective Length
A common parameter which expresses the distance over which any nonlinear
process is significant is known as the effective length, i.e. as the pow er falls
exponentially with distance so the nonlinear term has increasingly less significance. It is
defined as
4 ^ = ^ ^ (2.8)
a
w here L is the fibre length in km and a is expressed in the units km ’, e.g. with a fibre
loss of 0.04835 km ’ (0.21 dB/km from equation (2.5)) and fibre length o f 50km, =
18.84 km. As L becom es large, ~ 1/a, and L if a = 0.
2 . 3 . 4 D ispersion
In an ideal, linear and lossless fibre with negligible higher order dispersion
( 4 = 0) the N LSE simplifies to an ordinary partial differential equation
W hen transformed into the frequency domain by Fourier Transformation it becomes an
ordinary differential equation
(2.10)
with the solution
A{co) = A{0,co)exp[^p^coh) (2.11)
i.e. due to dispersion the spectral com ponents o f the pulse undergo a phase change
proportional to their frequency and the distance propagated. Applying an inverse Fourier
Transform , from frequency back to the time dom ain, the solution for an evolving pulse is
A(z,T) = ^ |A (0 ,m )e x p [Y ^ 2 ^ " ^ “ ' ^ ] (2.1 2)
2 . 3 .5 G a u ssia n P ulses in D isp ersiv e M ed ia
A particular family of pulse shapes is described by the super-G aussian expression for pulse amplitude
A (0 ,r) = Aqcxp (1-k/C) T
\ 2 m
yT o,
(2.13)
where A,, is the initial am plitude, C is the so-called chirp param eter which im poses a phase distribution across the pulse. The m param eter specifies the order of the super- G aussian (with higher orders having increasingly steeper pulse edges and m ore closely
approxim ating a square pulse). Tg is the % intensity point of the pulse, which is related to
the full-width at half maxim um (FW HM ) of the pulse by
T = 2 (21n(2))''" 7;, (2.14)
For a sim ple, unchirped Gaussian pulse, m = l and C=0 in equation (2.13) then
which after Fourier transformation and application of equation (2.13) gives the amplitude
of the Gaussian at distance z along the fibre as
A { z J ) = exp
2(T,^ - ip ,z )
(2.16)
w hich is Gaussian in shape, but com pared with equation (2.14) has changed in width by
T = Z
1 / 2
(2.17)
determined by the distance travelled down the fibre and the dispersion length, Lj^ (defined
in equation (2.2)) and is independent o f the sign o f the dispersion, At z = the
pulse width will have enlarged by a factor V2 com pared to the input w idth. As dispersion
increases so the dispersion length shortens and the pulse will broaden m ore quickly for a
given fibre length.
Com paring equation (2.15) to (2.16) shows the phase has been m odulated by the effect of
dispersion. W riting the complex amplitude in the form |A (z,?)ex p (/0 (z,r))| reveals a time
dependent phase term
- 1
J
(2.18)
The instantaneous frequency across the pulse, equal to the rate of change of phase across
the pulse, can be expressed as
8(0 = =
3(1) _ 2 s g n (j9 j(z /T ^ ) T
(2.19)
The frequency changes linearly with time across the pulse, either increasing or
decreasing, dependent upon the sign of the dispersion parameter, and the pulse has
become linearly chirped. Due to the frequency dependence o f the propagation constant,
P(cj), the spectral components of a pulse will experience different propagation times as they travel through a fibre. The difference in dispersion experienced by the spectral
com ponents, term ed Group Velocity Dispersion (GVD) is related to the more commonly
used chrom atic dispersion, D^, through
D = iT tC
~ Y (
2
.20
)is measured in ps/nm/km at wavelength A (note the sign reversal between and P2). If
D ^< 0 then dispersion is said to be in the normal region, w hereas D ^> 0 it is said to be anomalous dispersion. The longer (red) frequencies travel faster than shorter (blue)
frequencies in normal dispersion whilst blue travels faster than red in the anomalous
region. The resulting pulse is broadened as each of its spectral com ponents (changing
across the pulse) arrive at different times at the end of the dispersive fibre.
If the chromatic dispersion is zero then higher order dispersion must be included in the
N LSE to describe pulse evolution. The second order GVD term, is related to the
chrom atic dispersion slope, dD/dX, by
dD„ Atcc ^ ( 2 7 tc \
dX Pi +
A"
J
f t (2.21)with the dispersion slope m easured in ps/nm^/km. The effect o f the dispersion slope is to
produce asymmetrical pulse shapes with oscillatory leading or trailing edges depending on
the dispersion sign [1]. The second-order dispersion length introduced in equation
(2.2), gives the distance at which the effect of higher order dispersion becomes
significant. In the majority of fibre the dispersion slope is around 4-0.07 ps/nm^/km which
gives = 780,000 km, i.e. and is unlikely to play a significant part in pulse
distortion unless IDJ< 0.005 ps/nm/km.
2 . 3 . 6 Chirped Pulses
The chirp parameter C introduced with the general super-G aussian pulse equation
(2.13) can have a significant effect on the evolution o f pulse w idth. Applying equation
(2.12) with equation (2.13), it can be shown that a chirped G aussian pulse also remains
Gaussian after propagation but the ratio of input to output width is given by the relation
14- +
/ 2
If Cp2 < 0 then the pulse width initially narrow s to less than the width of an unchirped pulse (com pare equation (2.17)) until the linear chirp from dispersion grow s large enough
to dom inate and reverse the effect of the initial chirp. W hen C/3, > 0 the effect o f initial
chirp is to cause additional broadening of the pulses, more than when unchirped. The
effect of chirp is sum m arised in Figure 2.2 where /3; > 0 (the normal dispersion region)
for Gaussian pulses with initial positive, negative and zero chirp. For directly modulated
lasers at 1.55p.m the chirp is usually about -5 to -6 and therefore any initial pulse
narrow ing will occur only in norm al-dispersion fibre and excessive broadening will result
in anom alous dispersion fibre. It is possible to reduce the initial chirp im posed on the
pulses by externally m odulating the laser output [4].
C = 3
— - C = 0
OX)
■o
0.5
D istance, z/L,
Figure 2.2 Broadening factor of Gaussian pulses initially chirped (C=±3)
or unchirped (C=0) with propagating distance (normalised by the dispersion length G J in normal dispersion {p2 > 0).
2 . 3 .7 D is p e rs io n -L im ite d D istan ce
The two major contributions to dispersion in single mode fibre are from material
and waveguide dispersion. Material dispersion is caused by the characteristic resonance
frequencies of the medium which absorb the electromagnetic radiation through the
oscillation of bound electrons. In fused bulk silica the material dispersion is minimal and
the dispersion parameter falls to zero at 1.27pm , know n as the zero-dispersion
w avelength, A„, and is negative (D^. > 0, anomalous dispersion) beyond that
w avelength. W aveguide dispersion, as its name suggests, results from the effect the
confinem ent the waveguide has upon the optical mode propagating down the fibre. Its
value, mainly governed by core radius size and the refractive index difference between
fibre core and cladding, when added to that of the material dispersion can move the zero
dispersion wavelength to longer wavelengths: to the 1.3)Lim or 1.55)iim low loss
windows. The latter fibres are known as dispersion shifted fibre (DSF). Fibres originally
designed to have a at 1.3|im have dispersion in the range 1 5 - 2 0 ps/nm /km at 1.55jam
(due to the dispersion slope of +0.07ps/nm^/km) and are know n as conventional or
standard single mode fibre (SMF).
In system applications the effect o f dispersive broadening is to cause inter-sym bol
interference (1ST) between neighbouring pulses as they spread out during propagation
along the fibre. For chirped or unchirped pulses the broadening will eventually lead to
errors as ZEROs are mistakenly detected as ONEs, and vice versa. To quantify the
maximum amount of broadening that is tolerable in a transm ission system a possible
criteria is that at least 95% of the pulse energy must stay within its bit time slot. The bit-
rate and fibre length, L, must then satisfy the relation (assum ing the source is
monochromatic or transform-limited) [5]
or if ^^2 = 0 then the bit-rate and length must satisfy
This indicates the dispersion-limited distances available for fibre system s. The
perform ance of three types of fibre, SM F (D^ = 4-17ps/nm /km )j(pS^(D ^ = +1 ps/nm/km)
and D SF at Xg {D^ = 0, dD/dX = 0.07ps/nm^/km) is shown in Figure 2.3. Over a 1000km
length o f fibre the bit-rate is limited to 1.7Gb/s in SMF, whereas approaches 5Gb/s in
DCF (1 ps/nm/km) and is greatest in D SF {X^ which will accommodate a bit rate up to 67G b/s. Although equations (2.23) and (2.24) only apply to monochromatic and
unchirped G aussian pulses and give a best estimate of transm ission distances in
dispersive fibre, it is clear that dispersion must be chosen to be as low as possible to
minimise the effect of linear pulse broadening.
The legacy of the first fibre optic networks, tens o f millions o f kilometres o f w hich are
1000
100
10
1
0
10 100 1000
D istance (km )
10000
Figure 2.3 Dispersion-limited distances of fibre with dispersion of +17 and +1 ps/nm/km and zero dispersion with +0.07ps/nmVkm slope.
minimum dispersion at l.Sjim resulting in large dispersion in the 1.55|im region where
the benefits o f lowest fibre loss and optical amplification using Erbium -doped fibre
am plifiers lie [3].
2.4 NonLinear Processes
The linear approxim ation of pulse propagation no longer describes pulse evolution
accurately when high pow ers are present within a fibre; it cannot be assum ed that the
nonlinear term in the Schrodinger Equation, equation (2.0), in conjunction with high
optical intensity is small enough such that it can be neglected. Today, greater pow er is
available from laser sources and fibre am plifiers. Fibre amplifiers rem ove the loss
limitations o f fibre but do not regenerate the pulse shapes (which was previously
perform ed in opto-electronic repeaters) thereby allowing nonlinear effects to accumulate
on optical pulses as they propagate over the whole length of the fibre link. H igher bit-
rates result in greater pow er within pulses and the use of multiple channel transm ission
within a single fibre further increases the optical intensity within the glass m edium.
In silica fibre two nonlinear m echanism s affect channel propagation: the pow er dependence of the refractive index and stimulated scattering processes. The scattering
processes have important consequences for the maximum allowable pow er for a single
channel via Stimulated Brillouin Scattering (SBS) and affect the total pow er, total
bandw idth and total system length through Stimulated Raman Scattering (SRS). The
manifestation o f the nonlinear refractive index, or optical K err Effect, appears in three
forms: self-phase modulation (SPM ), cross-phase modulation (XPM ) and four-wave
mixing (FW M ). The first concerns the phase o f a single optical channel and how it is
affected by its own intensity. The second and third appear in WDM system s w herein the
phase of one channel is altered by the intensities o f the other channels (XPM ) and where
new frequencies are generated from the interaction o f two, or more, channels (FW M ).
Spectral broadening associated with phase modulation can cause m ore rapid pulse
broadening than that solely due to the chromatic dispersion present in the fibre. The
generation of new frequerjcies-implies pow er is transferred from existing frequencies
causing not only a d e c e a se origipal signal level, but a corresponding increase in
unw anted pow er at the sam eT ofother, frequencies, i.e. noise.
2 .4 .1 Self-Phase Modulation
From equation.(2.2) with the second and third order dispersion parameters set to
zero, the NLSE with normalised amplitude becomes
^ = — exp(-CK)|«7pf/ (2.25)
*
w here a is the fibre loss and the nonlinear length (inversely proportional to the input pow er), and has the solution
U (z, T ) =
U(0, r)exp[i^^,(z, n ]
(2.26)
w here U(0,T) is the amplitude at input, z = 0, and the nonlinear phase term is given by
(l>,,{z,T) = \ U i O , T f { L ^ J L , ,)
(2.27)
w ith L ^ th e effective length given in equation (2.8).
The solution to pulse evolution shows that the intensity profile o f the pulse, \U(z,T)\^
remains unaltered by the nonlinearity but the phase o f the pulse is dependent upon the
initial pow er through param eter and increases with distance, z, scaled by loss via the
^max - ^ e jf I ^N L (2.28)
i.e. w hen the nonlinear length equals the effective length the maximum phase change is
unity.
The instantaneous frequency across the pulse is given by the rate of change of phase
(2.29)
The pulse has been chirped: the instantaneous frequency changes across the pulse
dependent on both the distance travelled and on the rate of change o f intensity. Larger
frequency deviations, or frequency broadening, will occur where the intensity is changing
m ost rapidly, e.g. at the leading and trailing edges of pulses. If w e substitute the
expression for super-Gaussian pulses (2.13) into equation (2.29) the chirp-induced upon
the pulse is given by
8(û[T) = 2m 4# ~T~ 2 m -\
exp
2 m -\
4 ^ N L J o . \^o JT
(2.30)
For higher order Gaussian pulses (higher values o f m) the m ore square the pulses become
and the greater they are chirped. Figure 2.4 displays the phase and chirp profile o f a
G aussian (m=7) and super-Gaussian pulse {m=3) at The nonlinear phase
follow s the shape of the input pulse intensity but the chirp has a more complicated
behaviour. The leading edge of the pulses experience a reduction in frequency (red-shift)
and the trailing edges experience a frequency increase (blue-shift), therefore broadening
the spectrum o f the pulse. W ith higher order pulses, chirping is evident only at the pulse
edges and not across the pulse centre (where the intensity is constant). SPM thus causes
frequency broadening of the pulse spectrum, a rough estimate o f w hich can be found by
obtaining the maximum frequency deviation caused by the nonlinear chirp from equation
(2.30) giving
(2.31)
(2.32)
i.e. the amount of spectral broadening is proportional to the maximum nonlinear phase
shift (this does not hold for super-Gaussian pulses as their spectra are not G aussian and
Ao) 1/To but it allows an approximate calculation for the amount of spectral broadening pulses will experience).
The nonlinear effect acts to distort the phase across optical pulses. These phase variations
in time manifest themselves as instantaneous frequency deviations across the duration of
the pulse, i.e. the pulse has becom e chirped. The extent of the chirping is dependent upon
the distance propagated and the intensity profile o f the pulse; faster rises or falls in
intensity give more pronounced chirping and correspondingly larger spectral broadening.
In an ideal, intensity modulated direct detection (IM/DD) transm ission system , with a
receiver bandwidth wide enough to pass the complete spectrum of the propagated signal,
all the information contained within the spectrum w ould then be available with which to
reconstruct the pulses. Intensity detection is insensitive to the purely phase modulating
effect from the nonlinearity. But in practical systems the receiver will have a certain
bandw idth which is not necessarily large enough to pass all the frequencies o f spectrum
of the nonlinearly chirped channel. The receiver filter bandwidth will be designed large
enough to pass the majority of the signal but keep the amount o f noise to a minimum and
in a multi-channel system, small enough to reject neighbouring channels. The finite
bandw idth of the receiver filter will cut off frequencies outwith its passband and, unless it
has a flat frequency response, distort those which lie within. This loss and corruption of
inform ation will lead to distortions of the intensity profiles o f the pulses and affect system
perform ance. The preservation of phase information is vital for coherent transm ission
formats such as phase-shift keying: any variation from the ideal constant intensity level
will directly affect the bit-pattem, placing more strict tolerance limits upon CW fluctuations
super-Gaussian pulse shapes
■o
m = l
Time
+ve ■
-in=3
in=
-ve -- frequency chirp
J- across pulses
F i g u r e 2 .4 G a u s s ia n (/n = l ) an d s u p e r - G a u s s i a n ( m= 3 ) p u ls e s h a p e s a n d d y n a m i c f r e q u e n c y c h a n g e (o r c h i rp ) in d u c e d by the S P M effec t.
2 . 4 . 1 . 1 SPM In The Presence o f D ispersion
If the dispersion parameter is re-introduced and the dispersion length is
com parable to the nonlinear length, the evolution of pulses in this nonlinear and
dispersive medium is qualitatively different than a purely dispersive or purely nonlinear
fibre. The com bination of the tw o effects is now exam ined.
Dispersion causes different optical frequencies to travel at different velocities through the
fibre. As shown in the previous section the nonlinearity im poses chirp and broadens the
spectrum of pulses. The increase or decrease in frequency will be met with an increase or
decrease in velocity of those spectral com ponents depending w hether the dispersion is
anom alous or normal.
In the case of G aussian pulses it was dem onstrated that due to the action o f SPM the
leading edge is red-shifted in frequency which travel faster in normal dispersion than the
blue-shifted frequencies at the trailing edge which travel more slow ly. A pulse therefore
experiences greater broadening in nonlinear normal dispersion com pared to its
propagation within a region of linear dispersion.
In anom alous dispersion the lower frequencies travel at slow er velocities than the higher
frequencies. For a G aussian pulse, the red-shifted leading edge is slow ed as the blue-
shifted trailing edge travels faster. Instead of the pulse broadening, as in a dispersive
m edium , the pulse is narrowed. The SPM -induced chirp described by equation (2.30), is
positive in value and has the opposite sign to the linear dispersion-induced chirp of
equation (2.31) when P2 < 0, i.e. anomalous dispersion. If the magnitudes o f the two
chirping processes can be made equal then they may cancel each other allowing the pulse
to travel through the fibre undistorted. This balancing act is obtained exactly in ideal
lossless fibre for a particular pulse shape described by a hyperbolic secant and referred to
as a soliton pulse. It was first suggested for use in telecommunications over tw o decades
ago [7].
2 .4 .1 .2 S o lito n s
The soliton pulse shape is a solution to the N LSE, equation (2.3), for /j^< 0 and a
= 0, found using the inverse scattering method [8]. The stability o f these solutions,
arising from the balancing o f SPM and GVD chirp, over very large distances has made
them particularly attractive for long-haul telecommunications networks. The stable pulse
shape is in the form of a hyperbolic secant, with the peak pow er (mW) o f the soliton
pulse (in lossless fibre) given in relation to the fibre dispersion, (ps/nm/km) and pulse
w idth T(ps, f w h m) [1],
= 1.627 J (2.33)
For higher dispersion or shorter pulses the peak pow er o f the soliton m ust increase. If the
pow er is high enough pulse shapes other than the sech^() curve can evolve into the stable
soliton shapes. The loss encountered in real fibre tends to reduce the influence o f SPM
and cause the otherwise stable soliton to broaden dispersively. W ith the use of periodic
amplification to boost the pow er, the pulses, which are no longer strictly solitons, can
propagate in a stable manner. They are referred to as average-solitons [9]. This requires
an increase in the peak power by the factor (span length over effective length) to
ensure the average pow er is high enough over the lossy fibre and to ensure stability. The
peak pow er for the soliton pulse given in equation (2.33) actually describes the
fundamental soliton. Higher M^-order solitons can be found by increasing the pow er by
the factor These pulses exhibit periodic variation of shape and spectral distribution
with distance over a period known as the soliton period (for the fundamental soliton there
and inversely proportional to the dispersion. For average-solitons the am plifiers should be
placed at distances less than this period to avoid the loss of pow er to dispersive w aves.
This conflicts with the desire for large amplifier spacings to minimise total system cost.
With the dependence on the square of the bit-rate (inversely proportional to the pulse-
width) low er bit-rates are favoured.
Another fundamental feature of solitons is that they can interact with one another. In
particular, two soliton pulses with the same phase can attract one another and those with
opposing phase repel each other. This im poses a minimum time separation between
consecutive solitons, found to be at least five times their width [10], e.g. for a lOGb/s
soliton transm ission rate the pulses must be separated by lOOps and have a w idth no more
than 20ps, with higher transmission rates demanding narrow er pulses. The necessity of
pulse spacing demands that retum -to-zero (RZ) transm ission is used rather than the non-
return-to-zero (NRZ) format employed in conventional systems.
A fundamental limit to soliton transmission appears as a result o f small perturbations in
pow er across the pulses due to the addition of ASE from the optical amplifiers. The slight
variations in power nonlinearly modulates the refractive index which in turn leads to small
timing variations in the arrival of the frequency com ponents o f the pulses as a result of the
fibre dispersion. W ith increasing lengths of fibre or smaller pulse w idths/higher bit-rates
the timing errors can becom e severe, leading to errors at detection: the effect is know n as
G ordon-H aus jitter [11]. To alleviate this problem use has been made of narrow band
filters to partially remove ASE noise [12] and so reduce the jitter. The effect o f jitter is
reduced but eventually limits transm ission as the filters themselves introduce a loss
com ponent to the system which requires increased gain from the amplifiers and increases
ASE noise. An elegant improvement on this design was to gradually move the central
frequency of each successive filter [13]. The nonlinear soliton re-adjusts it central
frequency to that of each filter leaving the linear ASE noise at the original frequencies,
w hich are conveniently filtered out. The sliding-filter approach has also been used in
WDM soliton systems to reduce the timing jitter incurred when the pulses o f different
channels “collide” (pass through one another due to dispersion [14]. The use o f the
nonlinear effect of SPM to improve system performance is a superior advantage of the
soliton approach since it removes the need to overcome SPM and GVD interaction.
Although standard fibre has anomalous dispersion at 1.55|im , its high dispersion
(~2 0ps/nm/km) w ould require large signal powers to achieve stable soliton propagation,
e.g. at least lOdB more peak pow er than that required by D SF o f 2ps/nm /km . The w ork
in this thesis concentrates on conventional N R Z system s for short and medium-haul
transm ission distances particularly over dispersion managed SM F. The potential of


![Figure 4.2 Channel spectrum (a) after 9000km of zero dispersion fibre (input spectrum) (b) after 9000km of -0.2ps/nm/km fibre (150 x 60km spans, 10.5dB loss per span, 3rd order Butterworth filter after each gain- equals-loss amplifier) after [3],](https://thumb-us.123doks.com/thumbv2/123dok_us/8622360.1412068/81.595.109.476.76.499/figure-channel-spectrum-dispersion-spectrum-butterworth-filter-amplifier.webp)
![Figure 4.6 The optical intensity of an 8-bit sequence o f ONES and spectra for 20Gb/s NRZ channel after 560km of DSF with (a) normal and (b) anomalous dispersion, from [102] .](https://thumb-us.123doks.com/thumbv2/123dok_us/8622360.1412068/107.595.50.503.85.387/figure-optical-intensity-sequence-spectra-channel-anomalous-dispersion.webp)


