L inear and n on -lin ear m ech a n ism s
in th e p e r c e p tio n o f ste r e o sc o p ic
slan t and tr a n sp a r e n c y
Paul B. Hibbard
University College London
August 3, 1997
ProQuest Number: 10010388
All rights reserved
INFORMATION TO ALL USERS
The quality of this reproduction is dependent upon the quality of the copy submitted.
In the unlikely event that the author did not send a complete manuscript and there are missing pages, these will be noted. Also, if material had to be removed,
a note will indicate the deletion.
uest.
ProQuest 10010388
Published by ProQuest LLC(2016). Copyright of the Dissertation is held by the Author.
All rights reserved.
This work is protected against unauthorized copying under Title 17, United States Code. Microform Edition © ProQuest LLC.
ProQuest LLC
789 East Eisenhower Parkway P.O. Box 1346
Abstract
This thesis explored the role of contrast disparities in stereopsis, and the nature o f the
encoding o f surface slant from stereoscopic cues. Contrast disparities may be defined
as interocular differences in the position of image regions corresponding in terms of
image contrast, rather than luminance. It was found that, for simple plaid stimuli,
stereoscopic slant thresholds could be predicted from disparities in the plaid's
components. Further, the perceived slant o f grating and plaid stimuli was found to be
underestimated, with the degree o f underestimation for plaids depending on the
orientation of their component gratings. These results may be explained in terms o f the
orientation and spatial frequency disparities in the Fourier components o f the stimuli,
and are consistent with the notion that orientation disparities provide the primary cue to
stereoscopic slant (Rogers and Graham, 1983).
For plaids with orthogonal components, differing in contrast and spatial frequency,
stereoscopic transparency was observed. Transparency was also observed in stimuli
for which depth was defined by contrast modulation disparities. Transparency was only
perceived for crossed disparities o f the contrast modulation, such that the modulation
appeared to lie in front o f its carrier. This asymmetry was not evident if additional
luminance disparities were introduced to the image. These results support the view that
stereopsis has access to independent, linear and nonlinear channels (Hess and Wilcox,
1994). However, it was found that adaptation to the carrier o f a contrast modulated
stimulus increased the minimum contrast at which contrast disparities could be detected,
suggesting that significant nonlinearities in stereopsis are preceded by a stage of linear
filtering.
These results were explained using a model in which luminance and contrast disparities
are processed by independent linear and nonlinear mechanisms,s haring a common
A c k n o w le d g e m e n ts
I would like to th an k my supervisor, K eith Langley, for his help, advice and support throughout th e thesis. Oliver Braddick and David Fleet also provided m any helpful com m ents and ideas.
I am grateful to m any others at UCL for their encouragem ent and support. I would p articu larly like to th an k Colin Clifford, Tom Hartley, Stevie Sackin, P e te r Howell, Alan Johnston, M ark G ardner, Nico Preston, John D raper, K ate B radford, and the Psychology A llstars . I would also like to thank David Green and George H oughton, for interesting m e in Psychology as an undergraduate.
Finally, I would like to th an k Isabel, Jo, Paul(s), Carol, Ben, Mikie, A rshad, G arreth, Helen and th e Loughborough posse for their friendship throughout.
C o n ten ts
1 I n tr o d u c tio n 20
1 General I n tr o d u c ti o n ...20
2 The geom etry of binocular image p r o j e c t i o n ... 23
3 Stereoscopic S l a n t ... 28
4 N onlinearity in ste re o p sis...38
O v erv iew ... 45
2 G r a tin g and plaid sla n t th r e sh o ld s 47 1 In tr o d u c tio n ... 47
2 M e th o d s ... 53
2 .1 Stim ulus generation and d is p la y ... 53
2.2 S u b j e c t s ... 54
CO N TEN TS
3 E x p e rim e n ts ... 57
3.1 C ontrast and spatial frequency effects on stereoscopic slant th r e s h o l d s ... 57
3.2 Slant thresholds for sinusoidal g r a t i n g s ... 61
3.3 Slant thresholds for plaid s t i m u l i ...6 8 4 C o n c lu s io n s ... 72
3 P e r c e iv e d sla n t in g r a tin g and p la id stim u li 74 1 In tr o d u c tio n ... 74
2 M e th o d s ... 78
2.1 S u b j e c t s ... 78
2.2 P r o c e d u r e ...78
3 E x p e rim e n ts ... 80
3.1 Sinusoidal g r a t i n g s ... 80
3.2 P l a i d s ... 84
4 C o n c lu s io n s ... ^ ... 89
CO NTEN TS
2 M e th o d s ... 98
2.1 P r o c e d u r e ...98
3 Experim ents ... 99
3.1 A dditive T r a n s p a re n c y ...99
3.2 M ultiplicative T r a n s p a re n c y ...105
3.3 Transparency in Squarewave Plaid P attern s ... 110
4 C o n c lu s io n s ... 115
5 A s y m m e tr y in th e p e r c e p tio n o f tr a n sp a r e n c y from c o n tr a st d is p a r itie s 118 1 In tr o d u c tio n ... 118
2 M e th o d s ... 121
2.1 S tim u li...121
2.2 P r o c e d u r e ... 125
3 R e s u lts ... 125
4 C o n c lu s io n s ... 126
CO N T EN T S
2 M e th o d s ... 136
2.1 Stim uli ... 136
2.2 P r o c e d u r e ... 137
2.3 S u b j e c t s ... 139
3 R esults ... 139
4 C o n c lu s io n s ... 142
7 A m o d e l o f sla n t p e r c e p tio n b a sed on d ifferen ces in in s ta n ta n e o u s fr e q u e n c y 145 1 in tr o d u c tio n ... 145
2 T he affine m odel of the disparity f ie ld ... 148
3 Responses of bandpass filte r s ... 152
3.1 Phase and A m plitude r e s p o n s e s ... 153
3.2 Instantaneous f r e q u e n c y ... 155
4 S im u la ti o n s ... 157
5 Conclusions ... 165
CO NTEN TS
1 .1 Linear f i l t e r i n g ... 168
1.2 Post-filtering nonlinearity ...169
1.3 D isparity p r o c e s s i n g ..., ... 170
1.4 Surface r e p r e s e n t a tio n ... 172
2 Further Q u e stio n s ... 176
9 R e fe r e n c e s 179 A D is p a r itie s in S la n te d S u rfaces 199 1 Stim ulus generation and analysis of d is p a r itie s ... 199
2 Predicting slant th r e s h o ld s ... 202
List o f F igures
1.1 The coordinate system used. For details, see text... 23
1.2 Binocular transformations resulting from gradients o f horizontal dis
parity. A horizontal shear is introduced by slant about a horizontal
axis, while a horizontal expansion-compression is introduced by slant
about a vertical axis. Perspective figures represent slant about these
axes...26
1 .3 Orientation disparity, plotted against orientation, fo r equal magni
tudes of shear (solid line) and expansion-compression (dashed line).
Orientation disparities fo r the two transformations have equal magni
tudes only fo r orientations o f ±45°. Overall, more orientation dispar
ity is introduced by horizontal shear than by expansion-compression. 31
2.1 (A ) Orientation and (B ) spatial frequency disparities produced fo r an image contour by a constant magnitude o f shear or
expansion-compression. Disparities depend upon the orientation o f the contour.
The shear transformation produces m axim um orientation differences
fo r vertical gratings, and m axim um frequency differences fo r gratings
LIST OF FIGUKES
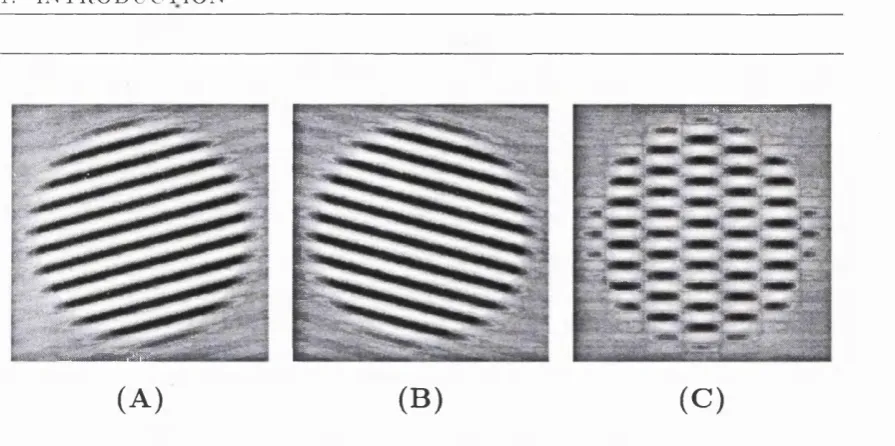
2.2 (A ) and (B ) Examples o f the sinusoidal gratings used. (C ) A n ex ample of a plaid used. This plaid was produced by adding the two
gratings in (A ) and (B ), It appears as a horizontal carrier with a
vertical contrast modulation. ... 52
2.3 Diagram o f the experimental apparatus used... 55 2.4 (A ) Horizontal axis and (B ) vertical axis slant thresholds plotted
against spatial frequency o f gratings and plaid beats. Error bars in
this and all other graphs represent 1 standard error o f the mean (note
that, fo r the sample sizes used here, this is equal to 0.577 times the
standard deviation)...59
2.5 Horizontal axis slant thresholds plotted against contrast. (A ) Grat
ings (B ) Plaids. The thick lines represent the slope predicted by the expected square-root relationship...60
2.6 The three stereoscopic transformations used. (A ) Shear (B )
Expansion-compression (C ) Rotation. Each transformation is expressed in the
Fourier frequency domain...61
2.7 Slant thresholds fo r grating stimuli plotted as a function o f orienta
tion. (A ) Results fo r rotation and shear. (B ) Results fo r
expansion-compression. Lines represent the best fitting curve, which was pro
duced by a model involving orientation disparities and (for shear and
LIST OF FIGURES
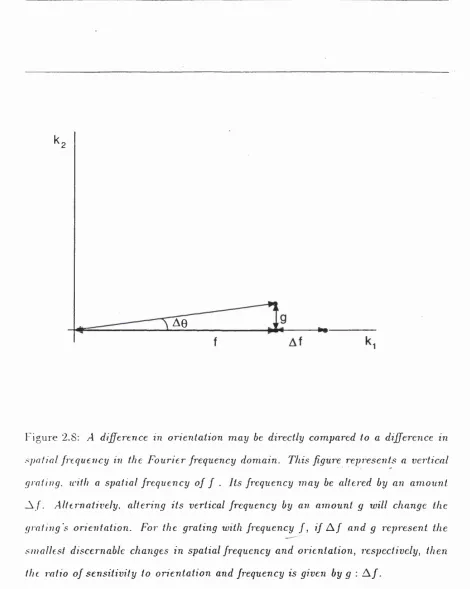
2.8 A difference in orientation may he directly compared to a difference
in spatial frequency in the Fourier frequency domain. This figure rep
resents a vertical grating, with a spatial frequency o f f i . Its frequency
m ay he altered hy an amount A / . Alternatively, altering its verti
cal frequency hy an amount g will change the grating’s orientation.
For the grating with frequency f , if A f and g represent the smallest
discernable changes in spatial frequency and orientation, respectively,
then the ratio o f sensitivity to orientation and frequency is given hy
g : A f...6 6
2.9 A n example o f a plaid stimulus, which has heen sheared ahout a hori
zontal axis between left and right eye views. Cross eyed fusion reveals
the plaid to slant ahout a horizontal axis...6 8
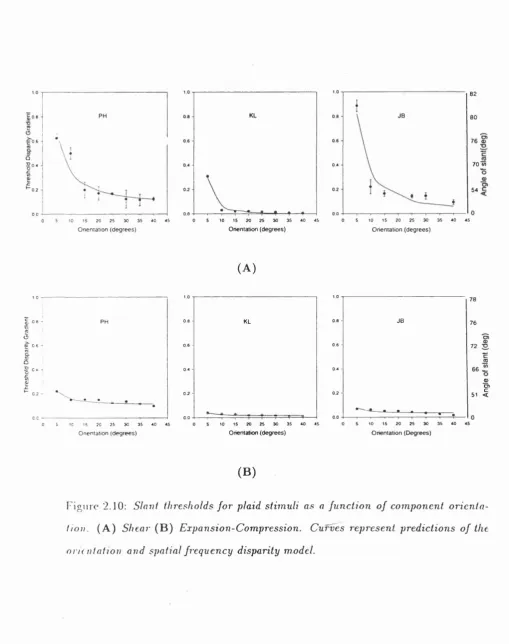
2.10 Slant thresholds fo r plaid stimuli as a function o f component orien
tation. (A ) Shear (B ) Expansion-Compression. Curves represent
predictions o f the orientation and spatial frequency disparity model. . 70
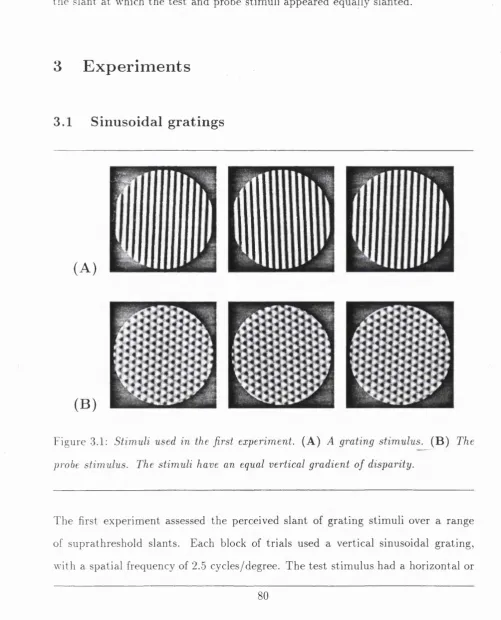
3.1 Stimuli used in the first experiment. (A ) A grating stimulus. (B )
The probe stimulus. The stimuli have an equal vertical gradient o f
disparity... 80
3.2 Fourier transforms o f the stimuli shown in figures 3.1 and 3.4- (A )
Grating. (B ) Plaid. (C ) Probe. Transforms represent the stimuli
prior to binocular transformation...' T ' . ...81
3 .3 50% points plotted against magnitude o f grating disparity gradient.
LIST OF FIGURES
3.4 Examples of the plaid stimuli used in the second experiment. In (A )
; the components are oriented at ± 1 0 °; in (B ) , they are oriented at
± 30°. While both stimuli have an equal vertical gradient o f disparity,
(A ) should appear less slanted than ( B ) ...
3.5 50% matching points fo r plaids, as a function o f the orientation of
plaid components. (A ) Vertical gradient. (B ) Horizontal gradient.
The solid horizontal line in each figure represents the results expected
if the plaids had appeared to slant equally to a probe stimulus with the
same disparity gradient. The dotted line in each figure represents the
apparent slant o f an equivalent grating stimulus (replotted from figure
g.g;... 86
4.1 (A ) Space-time diagram of contrast modulated grating motion. The carrier grating is stationary. As such, it appears as vertical in the
space-time plot. The contrast modulating grating moves to the right,
and can be seen as a contrast modulation oriented at 135°. (B )
Fourier transform of (A ). The centroid o f power represents the sta
tionary carrier grating. This is signified by the thick horizontal vector,
the magnitude o f which gives the grating’s spatial frequency. The side
bands o f power are introduced by the contrast modulation; the orien
tation o f the vector from the centroid o f power to the sidebands gives
the velocity o f the contrast envelope... 94 4.2 (A ) Light, with a luminance Ii, is reflected from a distant object is
attenuated by passing through a transparent object with transmittance
T. This is an example o f a multiplicative transparency. (B ). The
attenuated light may be added to light reflected from the transparent
LIST OF FIGURES
4.3 Examples o f the stimuli used in the first experiment. (A ) With the
vertical grating at low contrast, crossed-eyed fusion reveals a trans
parency, with the vertical grating appearing to slant in front o f ^left),
or behind right^ the horizontal grating. (B ) With both gratings at
high contrast, a single slanted surface is perceived...101 4.4 (A ) A typical response function (for subject JB, with a vertical spa
tial frequency o f 4-0 cycles/degree). Transparency was observed fo r
low contrasts o f the vertical grating, but not fo r higher contrasts. (B )
50% points fo r all subjects plotted against the spatial frequency o f the
vertical grating. Transparency was perceived over a wider range of
contrasts as the difference in frequency between the component grat
ings was increased...1 0 2
4.5 (A ) A plaid form ed from two gratings similar in orientation and fre
quency. (B ) Fourier transform of (A ). The two gratings lie within
the passband o f a single filter. (C ) A plaid formed from two gratings,
differing markedly in orientation and frequency. (D ) Fourier trans
form o f (C ). Here, the two gratings are widely separated in frequency
space, and would be expected to be detected by independent bandpass
filters... 104
4.6 Examples o f the stimuli used in the second experiment. Crossed f u
sion of the left two images should show the contrast envelope hovering
transparently in front o f the carrier grating._JWhen the right two im
ages are fused, the whole pattern appears to lie on a single surface in
LIST OF FIGURES
4.7 Typical response functions (A ) frontoparallel surfaces (B ) slanted
surfaces. Results in (B) represent a gradient o f uncrossed, or o f
crossed disparities. In each case, transparency was perceived only
fo r crossed disparities (or gradients o f crossed disparities) above a
m inim um value. Both functions are fo r subject PH, with an envelope
spatial frequency o f 0.7 cycles/degree...107
4.8 50% points plotted fo r different spatial frequencies (A ) frontoparallel
surfaces (B ) slanted surfaces. A s the spatial frequency o f the contrast
modulation was decreased, the m inim um disparity fo r which trans
parency was reported also decreased, reaching a m inim um fo r spatial
frequencies around O.j cycles/degree...108
4.9 Examples o f the stimuli used in the third experiment. (A ) With bright
intersections, transparency was not observed. (B ) With intersections
below the luminance o f the bars, transparency was observed, as re
ported by Stoner et al. (1990) in motion. (C ) With vary dark inter
sections, transparency was again reported. This time however it took
the fo rm of wide, light vertical bars seen transparently in front o f thin,
LIST O F FIGURES
4.10 (A ) A typical response function (subject JB, with a disparity gradi ent o f 0.1). With bright intersections, transparency was not reported.
With darker intersections, transparency became apparent; there ap
peared to be no lower bound on intersection luminance below which
transparency ceased to be reported. (B ) 50% points fo r different mag
nitudes o f surface slant, yls slant was increased, transparency was
observed over a wider range o f intersection luminances. The dotted
vertical line in the left-hand graph, and the dotted horizontal line in
the right-hand graph, represent the intersection luminance associated
with a purely multiplicative transparency... 114
5.1 Examples o f the stimuli used. Shown here are contrast modulated
grating stimuli, with no additional Fourier energy. The three stimuli
show the three contrast modulation patterns used. (A ): Square-wave .
modulation. (B ): Gabor modulation. (C ): Square modulation. In all
cases, cross-eyed fusion o f the left two images should reveal the con
trast modulation floating transparently in front o f the carrier grating.
In (A ) and (B ), cross-eyed fusion o f the right two images should re sult in the perception o f a single surface seen behind the plane o f the
paper. In (C ), a vertical carrier is modulated by a binocularly sheared
square, and appears as rivalrous, with no sensation o f depth. See text
fo r discussion...123
5.2 These stimuli are identical to those shown i n ^ u r e 5:1, except that lu
minance has been added in phase with the contrast modulation. Cross
eyed fusion o f either the left- or right- image pair should appear as a
transparency, with the contrast modulation pattern appearing in front
LIST OF FIGURES
5.3 A typical response function. For low contrasts o f added luminance
patterns, transparency was not reported. A s the contrast o f the added
luminance was increased, transparency was observed. This function
is fo r subject JB, with a square grating stimulus, a horizontal carrier,
and a contrast modulation depth o f 0.6...126
5.4 The results presented here represent 50% points o f psychometric fu n c
tions such as that shown in figure 5.3, fo r the situations in which the
transparency had a uniform uncrossed disparity. 50% points are plot
ted as a function o f modulation depth. Results are presented indepen
dently fo r the three different stimulus types. (A ): Square-wave. (B ):
Gabor. (C ): Square... 127
5.5 Results presented here correspond to the cases in which the trans
parency was slanted behind the fixation plane. L e ft: Square-wave.
R ig h t: Square... 128
6.1 Representation o f the Fourier spectrum o f the stimulus. The stimulus
has fo u r non-zero Fourier components, denoted by the black circles.
These are determined by the carrier frequency, the beat frequency, and
the two harmonics o f the beat. The horizontal carrier is located along
the ujy -axis, as denoted by the solid vector passing through the origin.
The length and direction o f the vector give the spatial frequency and
orientation o f the carrier, respectively. The beat spatial frequency
and orientation are given in a similar way by the horizontal vector
from the carrier to the component corresponding to the fundam ental
frequency of the beat. The empty circles, and the dotted vector, show
LIST OF FIGURES
6.2 Response function, fo r subject KL, fo r the baseline task. Subjects’
ability to perform the disparity detection task was affected by stimulus
contrast... 140 6.3 (A ): Mean threshold elevations, oh log~log axes, as a function o f the
spatial frequency o f the adapting grating. Results are averaged over
subjects and sessions. The two curves represent carrier frequencies o f
2.0 and f-O cycles/degree, which are marked on the horizontal axis.
Threshold elevations were maximal when the frequency o f the adapting
grating matched the carrier. (B ): Mean threshold elevation is plotted
as a function o f the angle between the carrier and the adapting grat
ing. Threshold elevations were maximal when the orientations were
identical. (C ): Mean threshold elevations when subjects were adapted
to a grating with the frequency o f the beat. Elevation is markedly
lower than when subjects adapted to a grating with the frequency o f
the carrier (note the different y-axis scales in (B ) and ( C) J. Results are plotted against the angle between the adapting grating and the car
rier. Threshold elevation was greater when the grating was parallel to
the carrier than when it was parallel to the beat... 141
7.1 The complex response R{ x , y ) is shown here in the complex plane.
Phase and amplitude fo rm a polar representation o f the response. . . 154
7.2 (A ): Plaid Stimulus. (B ): Response o f real part o f filter. (C ): Phase response. (D ): Amplitude response... 158
7.3 Results fo r four component plaid stimuli (A ): Rotation (B ): Shear.
LIST OF FIGURES
7.4 Slant estimation fo r plaid stimuli. (A ) Subject means fo r the psy
chophysical results from chapter 3, fo r horizontal shear. (B ) Model
estimates horizontal shear. (C ) Subject means fo r the
expansion-compression condition. (D ) Model estimates fo r the expansion-compression.
Results are plotted perceived or measured slant o f the probe stimulus
in all cases... 161 7.5 (A ) Perceived horizontal axis slant, as a function o f presentation
time, relative to geometrically predicted slant. (Replotted from Van
Ee and Erkelens (1996), fo r subject OS, fo r the shear condition).
Slant increases over time, fo r stimuli both with and without a zero
disparity reference. (B ) Model estimates o f the parameters o f rotation
and deformation, fo r a horizontally sheared plaid stimuli, relative to
the magnitude o f transformation. Parameter estimates increase with
successive iterations... 163
L ist o f Tables
2 .1 values fo r the fitted models. Combining orientation disparity with
positional disparity gradient or diffrequency gave a better fit than dis
parity gradient alone. The model combining orientation disparity and
diffrequency gave the best overall fit...63
3.1 Results of linear regressions on the data shown in figure 3.3. R?
values, and the slopes of the regression fits are shown. In all cases,
the slopes were significantly below 1.0, (p < 0.05^ showing that slant and inclination are consistently underestimated... 83
3.2 Results of linear regressions on the data shown in figure 3.5. R?
values, and the intercepts and slopes o f the regression fits are shown.
In all cases, the intercept was significantly less than 0.15 (p < 0.05j.
The slope values, representing the effect o f component orientation,
were signifcantly different to 0 fo r subject K L (p < 0.05j, but not fo r
1. In tro d u ctio n
1
G e n e r a l In tr o d u c tio n
One of th e more interesting features of m any visual system s is th eir ability to infer depth inform ation from differences in the images projected to th e left and right eyes. These differences are introduced by th e two eyes viewing th e sam e scene from different locations. A different geometric relationship will exist between objects in th e visual scene, and th e two retinae. This geom etric relationship will determ ine th e m apping of th e th ree dimensional coordinate fram e to th e im age formed on each retina. It follows th a t th e two binocular images will not be identical. T he differences betw een th e two images are known as binocular disparities, and m ay be specified in term s of th e differences in either the optic arrays subtended by each point to th e two eyes, or the positions of the projections of corresponding im age points.
1. GENERAL INTRODUCTION
point, such th a t both eyes are pointed directly towards it, th e point will have zero disparity. O ther points will have disparities determ ined in p a rt by th eir distance in depth away from this fixation point. D isparities thus provide a source of inform ation relating to the distance to points in the image. W heatstone (1838) first dem onstrated th a t depth m ay be perceived when two slightly different photographs or drawings are presented to the two eyes.
To determ ine th e binocular disparity associated w ith a point, it is necessary to establish which points in th e two retinal images correspond to the sam e point in three-dim ensional space. This is known as the correspondence problem (M arr and Poggio, 1979). Once correspondence has been determ ined, it is possible to com pare the positions of points in the two images, and to infer th e binocular disparity. In the stereogram s used by W heatstone, features were visible m onocularly which were thought to have been used to solve the correspondence problem (Sherrington, 1906). However, Julesz (1960) dem onstrated th a t extensive pre-processing of m onocular im ages is not required to solve the correspondence problem . Julesz devised a stim ulus known as a random dot stereogram, consisting of a binocular pair of images, both of which consist of random visual noise. The noise in the two images of a random dot stereogram is identical, except th a t some points are shifted betw een left and right images, so as to produce a binocular disparity. D epth is perceived in these stereogram s consistent w ith these disparity cues. These stim uli are interesting due to th e am biguity inherent in the correspondence problem. For any given point in th e left image, there will be a num ber of points in th e right image w ith th e same lum inance, to which the point may be m atched. T h e ^ s tim u li dem onstrate th a t th e correspondence problem may be solved in th e presence of point-wise am biguity in left- and right-eye matches.
1. GENERAL INTRO D U CTIO N
distance to objects, and to their shape. This thesis addresses two questions related to th e representation of surface shape on th e basis of stereoscopic cues. T he first question is w hat types of mechanisms are used to infer surface shape from stereo scopic disparity. W hile it is in principle possible to determ ine th e dep th of individual points from horizontal disparities, it has been suggested th a t th e analysis of higher order properties of shape, such as depth discontinuities, and surface orientation and curvature, exploits corresponding higher order properties of im age disparities (e.g. Rogers and G raham , 1983; Gillam, Flagg and Finlay, 1984; Stevens and Brookes, 1987; Brookes and Stevens, 1989; Rogers and Cagenello, 1989). The second ques tion relates to the types of monocular inform ation which m ay be used for binocular m atching to establish correspondence. Conventional models of stereopsis (e.g. M arr and Poggio, 1979; C rim son, 1980; May hew and Frisby, 1980), developed in light of the correspondence problem in random dot stereogram s, m atch points on th e basis of th eir lum inance. However, it has been suggested th a t contrast envelopes may present another source of m onocular inform ation which m ay be used for binocular m atching, and which may support depth perception (Liu, Schor and R am achandran, 1992; Sato and Nishida, 1993; 1994; Hess and Wilcox, 1994; W ilcox and Hess, 1995; 1996).
2. TH E GEOMETRY OF BINOCULAR IMAGE P R O JE C T IO N
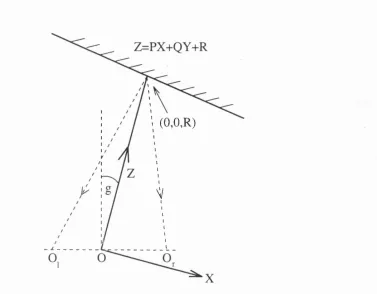
(0,0,R)
Figure 1.1: The coordinate system used. For details, see text.
2
T h e g e o m e tr y o f b in o c u la r im a g e p r o je c tio n
Disparities occur in binocular image pairs as a result of the projection of a single visual scene to two image planes, horizontally separated in space. An analysis of how points in three-dimensional space project independently to the two retinae may be used to understand these disparities. Longuet-Higgins an d Prazdny (1981) analysed the general problem of the projection of a moving three-dim ensional scene to a single image plane; May hew and Longuet-Higgins (1982) applied this analysis to the specific problem of binocular vision. The geom etry presented below is based on this latter analysis.
2. T H E GEO M ETRY OF BINOCULAR IMAGE P R O JE C T IO N _______________ is th a t of th e disparities introduced as a result of th e projection of th e three- dim ensional world coordinate system X Y Z to th e two-dim ensional left- and right- image coordinate systems, x y and x'y'. The world coordinate system used has an origin at 0 , th e m idpoint of th e line joining the optical centres of th e eyes [Oi and
Or). T he Z axis is defined by th e line joining 0 to the fixation point, (0,0, i?). The distance R, in th e direction of th e Z axis, gives th e fixation distance. T he X axis lies in th e plane containing th e line O;Or and the fixation point; th e Y axis is norm al to this plane. T he gaze angle, is given by th e angle between th e X axis and th e line O/Or- The interocular distance O/Or is given by I. The following analysis refers to the projection of th e plane Z = P X + Q Y -f R, which refers to any plane passing through the fixation point. It is assum ed th a t th e fixation distance R is sufficiently larger th an th e interocular distance I th a t term s in the second order of ^ m ay be ignored. The horizontal and vertical disparity of each point in th e scene is given by
[dh,dy] = (x' — — y), which describes the shift in th e projected im age of th e
point between left and right images. This disparity is given by:
dh =
d n , =
[P COS g -\-sm g ) x Q y COS g {cosg — P s\iig)x^ — Q x y sm g — (1)
^ sin ^ 4- (cos ^ f sin sin ^ ^ (2)
A ssuming g is small, then sin ^ and cos g m ay be replaced by g and 1, respectively,
and Pg and Qg may be neglected. (1) and (2) then become:
dh = { P x Q y g x x ' ^ ^ (3)
I
d v = [gy + xy] — (4)
2. T H E GEO M ETRY OF BINOCULAR IMAGE P R O JE C T IO N _______________ disparities vary spatially. However, only horizontal disparities are affected by sur face shape, which is here determ ined by P and Q. Slant about a vertical axis will introduce a horizontal gradient of horizontal disparity. Similarly, slant ab ou t a hori zontal axis will introduce a vertical gradient of horizontal disparity. B oth horizontal and vertical disparities are scaled by th e ratio of th e interocular distance to th e viewing distance.
This analysis suggests a m ethod of com puting th e unknown param eters P and Q, which determ ine th e slant of the surface about a vertical and a horizontal axis, respectively. Equation (3) shows th a t slant about a horizontal axis introduces a ver tical gradient of horizontal disparity which is directly proportional to th e m agnitude of slant. A m easurem ent of th e vertical gradient of disparity could thus be used to estim ate th e m agnitude of slant about a horizontal axis. This estim ate would need to be scaled by the quantity Longuet-Higgins (1982) suggested th a t this la tte r quan tity m ay be estim ated from vertical disparities. Similarly, equation (3) shows th a t slant about a vertical axis introduces a horizontal gradient of horizontal dis parity, which is again directly proportional to th e m agnitude of slant. However, disparity also changes horizontally as a result of eccentricity.
A gradient of horizontal disparity may be represented using m atrix notatio n by:
d fi ' G h Gy ' X
dy 0 0 .
y .
(5)
easure-2. TH E GEOM ETRY OE BINOCULAR IMAGE P R O JE C T IO N
Shear Expansion-com pression
l igure 1.2: Binocular transformations resulting fi'om. gradients of horizontal dis parity. A horizontal shear is introduced by slant about a horizontal axis, while a
horizontal expansion-compression is introduced by slant about a vertical axis. Per
spective figures represent slant about these axes.
2. .T H E GEO M ETRY O F BINOCULAR IMAGE P R O JE C T IO N
dh a b ' X
dy c d . y .
(6 )
which m ay be rew ritten:
dh Ai 0
+
0 —A2 +
0 A3 +
—A4 0
dy 0 Ai A2 0 A3 0 0 A4
(7)
where Ai = \{a + o?), A2 = \{c —6), A3 = \ { b c ) and A4 = | ( d — a). Equation
(7) represents an irreducible representation of the affine transform ation, in term s of its geom etrical invariants (I\oenderink and van Doom , 1975). The first term in (7) represents a. uniform expansion of m agnitude Ai. The second term represents a rotation. T he final two term s in (7) represent th e deform ation com ponent. R otation through a sm all angle a is given by:
dh 1 — cos a 1 — sin a X
dy 1 + sin a 1 — cos a
. y .
0 —A2 A2 0
X
. y .
(8)
(9)
where A2 = sin a and th e small angle approxim ation cos a % 1 is used.
3. ST ER EO SC O PIC SLANT
dh Gh 0 0 — Gy ’ Gh 0 0 c /
(10)
= + + +
dy 0 Gh Gy 0 0 Gh — Gy 0
Slant ab o ut a horizontal or a vertical axis will introduce a com ponent of rotation, or of dilation, respectively. Both will introduce a com ponent of deform ation. In the same way, ro tation and dilation of an image will b o th introduce horizontal and vertical gradients of disparity. The advantage of th e representation in equation (10) is th a t deform ation is unaffected by rotation and dilation, and is directly related to surface slant. A m echanism sensitive to the m agnitude and direction of deform ation would therefore have direct access to the m agnitude and direction of surface slant (the m agnitude being subject to a scaling factor).
3
S te r e o sc o p ic Slant
The geometric analysis presented above describes how disparities are related to sur face orientation. This section reviews em pirical research into th e use of stereoscopic inform ation in th e perception of shape. As in the geom etric analysis, th e m ain focus of the studies described here is the representation of surface slant. A ddition ally, only the role of horizontal disparities is discussed; th e question of how vertical disparities may be used to scale depth estim ates (Longuet-Higgins, 1982; May hew and Longuet-Higgins, 1982; Carding, Porrill, May hew and Frisby, 1996; Rogers and Bradshaw, 1996) is not addressed.
3. ST ER EO SC O PIC SLANT
a corresponding disparity discontinuity in the binocular images. W hile such discon tinuities cause problems for models of stereopsis (Nelson, 1975; May hew and Frisby, 1980), they also present a potentially efficient strategy for encoding surface slant (G illam , Flagg and Finlay, 1984). For planar surfaces, disparities on a surface are redundant once th e disparities at its boundaries have been determ ined, as they will vary linearly between the boundaries, Gillam et al. (1984) found th a t subjects were able to report th e slant of a surface more quickly and accurately if th e boundaries of the slanted region were defined by disparity discontinuities. Gillam , Cham bers and Russo (1988) provided further examples of how stereoscopic efficiency is improved by the presence of disparity discontinuities. In addition, they reported sim ilar fa cilitation of th e identification of surface slant by th e presence of discontinuities in disparity gradients, as occur when two surfaces m eet on a com mon line.
3. ST ER EO SC O PIC SLANT
3. STER EO SC O PIC SLANT >1 4J -H k (0 a w - H TS C O - H -P d 4J c 0) ■rH p o
•80 - 6 0 - 4 0 - 2 0 0 2 0 4 0 6 0 8 0 O r i e n t a t i o n
Eigure 1.3: Orientation disparity, plotted against orientation, for equal magnitudes of shear (solid line) and expansion-compression (dashed line). Orientation dispar
ities for the two transformations have equal magnitudes only for orientations of
±45°. Overall, more orientation disparity is introduced by horizontal shear than by ( xpa n s i o n -co mp ressi o n.
axis, th at is not available for slant about a vertical axis. This reference would allow for increased sensitivity to slant about a horizontal axis.
3. ST ER EO SC O PIC SLANT
respectively. B oth transform ations introduce orientation disparities. O rientation disparities for an image contour depend both on th e type and m agnitude of tra n s form ation, and on th e orientation of the contour. Here, the orientation of a contour is defined in term s of its absolute (cyclopean) orientation, ra th e r th a n th e individual orientations present in th e binocular images. For exam ple, figure 1.2 shows th a t a horizontal shear does not affect the orientation of horizontal lines, and produces a m axim um orientation disparity for vertical lines. For an expansion-com pression, orientation disparities are evident for neither horizontal nor vertical lines, and have th e greatest m agnitude for lines at ±45°. Figure 1.3 shows how orientation disparity depends on orientation, for both shear and expansion-compression transform ations. Integration of these graphs reveals th a t, on average, orientation disparities are 57% greater for a shear th an for an expansion-compression of th e sam e m agnitude (C a genello and Rogers, 1993). If orientation disparities provided th e prim ary cue to surface slant, one would predict th a t slant about a horizontal axis would be more readily perceived th an slant about a vertical axis.
3. .ST E R E O S C O P IC SLANT
orientational differences for small (< 2degrees) stim uli. Cagenello and Rogers sug gested th a t orientation disparities may similarly be used as a cue to slant only for sufficiently large stim uli. Gillam and Ryan (1992), however, reported anisotropic slant perception for diagonal lines, even for large stim uli.
Rogers and G raham (1983) showed th a t there is an analogous anisotropy in the perception of surfaces defined by motion parallax. For horizontal head m ovem ents, m otion parallax inform ation m ay be described as a horizontal shear for surfaces slanting about a horizontal axis, and as a horizontal expansion-compression for slant about a vertical axis. For vertical head movements, slant about a horizontal axis re sults in a vertical expansion-compression, whereas slant about a vertical axis results in a vertical shear. Rogers and G raham found th a t slant about a horizontal axis was more readily perceived for horizontal head movements. Conversely, slant about a vertical axis was more readily perceived with vertical head m ovem ents. These results dem onstrate th a t it is a shear transform ation th a t is more readily perceived th an an expansion-compression transform ation, rath er th an th e axis of slant per se
which is responsible for the anisotropy. These results m ay again be explained in term s of th e orientation changes associated w ith th e two transform ations, which are unaffected by th e directions of th e transform ations. Finally, th e anisotropy is also evident for stereoscopically defined curved surfaces (Rogers and G raham , 1983; Ca genello and Rogers, 1988; Rogers and Cagenello, 1989). The analysis of orientation changes m ay thus represent a general strategy in th e encoding of shape from both m otion and stereo cues.
3. STER EO SC O PIC SLANT
of lines between th e two eyes. In these stim uli, th e lum inances of corresponding points in left- and right-eye images are uncorrelated, and it is not possible to m atch points between images to determine horizontal disparities. O rientation disparities therefore provide th e only cue to slant. Ninio (1985) investigated slant perception in line stereogram s containing different am ounts of orientation and positional disparity. He found th a t a sm ooth surface was more likely to be observed in stim uli containing orientation disparities, than in those w ithout.
The role of orientation disparities in stereopsis is also supported by physiological evidence. Blakemore et al. (1972) found binocular cells in cat prim ary visual cortex th a t showed a difference in the orientation tuning of th eir left- and right-eye m onocu lar receptive fields. Blakemore et al. argued th a t this difference in orientation tuning m ade the cells ideally suited as orientation disparity detectors, and suggested they may play a role in stereopsis. Nelson, K ato and Bishop (1977) have also described binocular cells in cat visual cortex which were tuned to different orientations in left and right eyes, and which responded to binocular orientation disparities. Hànny, von der Heydt and Poggio (1980) found cells sim ilarly tu ned to orientation disparities in the p restriate cortex of monkeys.
3. ST ER EO SC O PIC SLANT
stim ulus was presented w ith a difference in frequency between left- and right-eye gratings, at a drift ra te sufficient to destroy th e perception of m otion in depth, slant was observed. In addition, it was reported th a t slant was evident in dichoptic displays of uncorrelated vertical one-dimensional noise, differing betw een left- and right- eyes in m ean spatial frequency. It was proposed th a t this slant percept was based on spatial frequency differences.
3. ST ER EO SC O PIC SLANT
lations in globally uncorrelated stimuli. Similarly, although th e stim uli of von der H eydt et al. (1981) are based on one dimensional, uncorrelated m onocular signals, it is possible th a t sufficient local correlations may have existed to support stereopsis. Horizontal disparities m ay also play a role in th e representation of surface slant. For a vertical grating, w ith an interocular difference in orientation or spatial frequency, analysis of positional disparities, and of orientation or frequency disparities, would predict the perception of th e same slant. However, an analysis of positional dispari ties would also predict th a t, for a sufficiently large difference in orientation or spatial frequency, th e surface would appear as a series of slanted patches, separated by hor izontal or vertical depth discontinuities, introduced by aliasing. This discontinuous percept has been reported for both orientation (Riggins, 1978) and frequency (Tyler and S utter, 1979; DeValois and De Valois, 1990; H alpern, W ilson and Blake, 1996) differences, and was described by Tyler and Sutter as being sim ilar in appearance to a Venetian blind. DeValois and DeValois reported bistability betw een th e p er ception of a Venetian blind, and a single surface, for gratings w ith an interocular frequency difference. This bistability may be explained in term s of conflicting depth cues generated by positional disparities and frequency disparities. A lternatively, it may represent conflict between local and global solutions of th e correspondence problem. In either case, th e existence of the Venetian blind percept dem onstrates th a t position disparities play a role in th e perception of slanted surfaces.
3. S T ER EO SC O PIC SLANT
be expected to perceive slant given a rotation or dilation between left and right images. Howard and Kaneko (1994; Kaneko and Howard, 1994) found th a t ro ta tion and dilation of images between th e two eyes generated relatively little apparent slant. Howard and Kaneko (1994) suggested th a t slant about a horizontal axis is derived from th e difference between horizontal shear and vertical shear. Similarly, it was suggested th a t slant about a vertical axis is derived from th e difference betw een horizontal and vertical expansion-compression (Kaneko and Howard, 1994). This strategy would predict th a t slant would be perceived from vertical shear, or from deform ation, which is equivalent to equal bu t opposite horizontal and vertical shear, b u t not from rotation, which is equivalent to equal m agnitudes of horizontal and vertical shear. Similarly, it is predicted th a t slant would be perceived from vertical expansion-compression (as is apparent in Ogle’s induced effect (Ogle, 1938)), bu t not dilation. Howard and Kaneko’s results contradict those of G illam and Rogers (1991), vvlio found th a t slant was perceived from ro tation , b u t not from vertical shear. Howard and Kaneko (1994) argued th a t this was due to th e zero dispar ity surround used in th e la tte r study. They found th a t, for stim uli w ith a black surround, slant was perceived for cyclorotated stim uli subtending 10 degrees of vi sual angle, b u t not for larger stimuli. For stim uli w ith a tex tu red , zero disparity surround, slant was perceived for all sizes of stim uli studied. They proposed th a t, while horizontal shear and expansion compression are m easured locally, th e equiva lent vertical transform ations may be m easured m ore globally. This strateg y would help to discount torsional m isalignm ent of th e eyes.
4. N ONLINEARITY IN STEREOPSIS
by global dilation or rotation of the image between left and right eyes.
C om putational models have shown th a t estim ates of surface slant m ay be obtained from algorithm s based on orientation disparities. W ildes (1991) showed th a t angular disparities, m easured from pairs of image contours, m ay be used to m easure slant on th e basis of deform ation. Jones and Malik (1992) presented an algorithm which estim ates slant on th e basis of both orientation and spatial frequency differences. These models dem onstrate th a t the theories proposed to account for psychophysical results are able to provide reliable estim ates of slant.
4
N o n lin e a r ity in ste r e o p sis
4. ,NONLINEARITY IN STEREOPSIS
envelope disparities in stim uli in which one-dimensional noise was m odulated by a vertical G abor signal. They found th a t, although stereoacuity was poor, depth was perceived when th e noise was un correlated between left and right eyes. F u rth er, they found th a t stim uli in which th e left- and right-eye one dim ensional noise signals were orthogonal did not support stereoscopic depth. Liu et al. (1992) presented subjects w ith G abor stim uli in which envelope and carrier disparities were m an ip u lated in dependently. They found th a t stereoacuity was b e tte r when th e envelope and the carrier had identical disparities than when only th e carrier had a nonzero dispar ity. In contrast to Wilcox and Hess (1996), they also reported th a t when presented w ith binocular G abor stim uli in which left- and right-eye sinusoidal carriers were orthogonal, subjects perceived depth correctly from th e envelope while th e carriers appeared rivalrous. Sato and Nishida (1993) presented subjects w ith second order random dot stereogram s, much like those used in some studies of non-Fourier m o tion. They found th a t upper lim its of disparity were lower w ith second order stim uli th an w ith conventional random -dot stereograms.
4. N ONLINEARITY IN STEREOPSIS
This two channel model of stereopsis is analogous to those used to explain non- Fourier m otion (e.g. Chubb and Sperling, 1988; V ictor and Conte, 1992; W ilson, Ferrera and Yo, 1992; Zhou and Baker, 1993; Fleet and Langley, 1994a). D errington and Bad cock (1986) dem onstrated th a t, in a plaid formed from th e product of a high frequency (carrier) and low frequency (m odulation) sinusoidal grating, tran sp aren t m otion m ay be seen if the carrier and m odulation move w ith different velocities. This stim ulus contains no Fourier component w ith th e velocity of th e m odulation, yet m otion is nevertheless seen w ith this velocity. Chubb and Sperling (1988) described this as “non-Fourier” m otion, and defined a class of stim uli, which they labelled drift balanced stim uli, for which this idea was extended. They proposed th a t m otion in these stim uli could not readily be understood in term s of th eir Fourier spectra. Fleet and Langley (1994a) dem onstrated th a t idealisations of m any of these stim uli have a relatively simple characterisation in th e Fourier frequency dom ain. However, a simple m echanism relying on velocity estim ates from image Fourier com ponents would fail to detect m otion in these stim uli. Chubb and Sperling suggested th a t m otion m ay be perceived following full-wave rectification of th e image (after a stage of spatially broadband filtering), which would have th e effect of introducing Fourier com ponents w ith the required velocity. This nonlinearity forms th e in itial stage of an independent, non-Fourier channel in m otion processing, which m ay account for the perception of m otion which does not correspond directly to image Fourier com ponents. O ther two channel models have been proposed, in which nonlinearities occur relatively late in processing, after a stage of orientation- and spatial frequency- specific filtering (Wilson et ah, 1992; Zhou and Baker, 1993; Fleet and Langley, 1994a).
4. NO N LIN EARITY IN STEREOPSIS
mechanism . The receptive fields of cortical simple cells m ay be modelled using two dim ensional G abor functions (Jones and Palm er, 1987), w ith adjacent cells dem on stratin g phase relationships of 90° or 180° (Foster, Gaska, M arcelja and Pollen, 1983; Liu, Gaska, Jacobson and Pollen, 1992; Palm er and Davis, 1981; Pollen and Ronner, 1981). G abor functions w ith a quadrature (90°) phase relationship m ay be used to com pute an energy response (Adelson and Bergen, 1985; Em erson, Bergen and Adel- son, 1992; Heeger, 1992). Fleet et al. proposed th a t complex cells m ay function as binocular energy neurons, nonlinearly combining responses from q u ad ratu re pairs of linear neurons (simple cells) in both left- and right-eyes. Binocular energy neurons in th e model are given disparity tuning by altering th e left- and right-eye receptive fields of simple cells. The binocular receptive fields are related by position shifts and phase shifts. A position shifted neuron has receptive fields w ith an identical shape in the left- and right-eye, but which are shifted in position between eyes. For a phase shifted neuron, receptive fields in the left and right eyes occupy th e same position, bu t have a difference in shape, taking th e form of a shift of th e phase of the sinusoidal com ponent of the Gabor. Additionally, hybrid neurons were proposed, combining a position shift with a phase shift. To provide robust and reliable esti m ates, the model com putes disparity by pooling responses of binocular energy units over position, orientation and scale.
4. N 0N LIN E A R4T Y IN STEREOPSIS
explain why disparity is more easily detected when carrier and envelope have the sam e disparity, and left and right images are perfectly correlated. In addition, by v irtu e of its integration across scale and position, this com putational strategy is able to detect disparities larger than one half cycle of the spatial frequency com ponents of th e stim ulus.
It m ay also be possible to account for stereospsis from contrast m odulated uncorre lated noise p attern s using a single channel model. Wilcox and Hess (1996) dem on stra ted th a t, for a spatial average taken over th e entire of ex ten t of th e stim ulus, th eir stim uli were uncorrelated. This does not however exclude th e possibility th a t local correlations may have existed. Any such local correlations m ay have been suffi cient to support stereopsis. Using a similar argum ent, H alpern et al. (1996) showed th a t the stim uli of Tyler and Sutter (1979) provided sufficient local correlations th a t a positional disparity based mechanism could support a slant discrim ination task above chance. W hile a m echanism which is dependent on chance local correlations would not be expected to be robust, it should be borne in m ind th a t stereoacuity for th e un correlated stim uli used by Wilcox and Hess was poor.
4. N ONLINEARITY IN STEREOPSIS
pansive nonlinearities m ay introduce additional components w ith th e orientation and spatial frequency of image contrast variations. B urton (1973) suggested th a t th e vi sual system m ay rely on these distortion products to detect contrast beats. As such, early nonlinearities m ay play a functional role in the detection of image contrast variations. B urton (1973) found th at prolonged exposure to th e product of a high frequency (carrier) and a lower frequency (modulation) sinusoidal grating increased contrast detection thresholds for gratings close in orientation and spatial frequency to th e m odulation. Since there is no Fourier component w ith this o rientation and frequency in the image, it was proposed th a t adaptation of th e relevant channel resulted from the presence of distortion products. Henning, H ertz and B roadbent (1975) found reciprocal masking effects between contrast beats and lum inance g ra t ings of equal orientation and frequency. Masking effects were greatest when gratings were 90° out of phase w ith the distortion product th a t woud be expected to be intro duced b}' a compressive nonlinearity, suggesting th a t th e masking is not caused by such a compression. Sm allm an and Harris (1996) suggested th a t early visual nonlin earities may be expansive rath er than compressive. In contrast, Scott-Sam uel and Georgeson (1995) provided evidence for an early compressive nonlinearity, in troduc ing a distortion product whose m agnitude is influenced by th e tem poral frequency of the contrast envelope.
4. N O NLINEARITY IN STEREOPSIS
found a subpopulation of neurons in cat areas 17 and 18 which did respond to bo th lum inance gratings and contrast beats. These neurons showed orientation and spatial frequency tuning for both types of stim ulus. However, th e optim al b eat spatial frequency was always lower th an th e optim al lum inance grating spatial frequency. A dditionally, responses to beats showed a m arked dependence on th e spatial frequency of th e carrier grating. These results are not consistent w ith a sim ple early distortion product hypothesis. R ather, Zhou and Baker argued th a t th e cell responses recorded resulted from nonlinearities occurring after orientation- and frequency-specific filtering, constituting a distinct pathw ay whose role m ay be to analyse spatial and tem poral contrast variations.
D errington and Bad cock (1985) provided further evidence th a t contrast b e at detec tion does not rely on distortion products. In a plaid form ed from th e sum of two sinusoidal gratings, w ith similar orientations and spatial frequencies, th e contrast of any distortion product will depend on the contrast of th e two com ponents. If contrast beats were processed on the basis of this distortion product, then th eir de tectab ility should depend on the product of the contrasts of th e com ponent gratings. Increasing th e contrast of one component should reduce th e contrast of th e other com ponent required to detect th e beat. Conversely, D errington and Bad cock found th a t increasing the contrast of one of the components increased th e contrast in the other com ponent required. These results would be predicted if beats are detected on the basis of spatial variations in contrast; such variations would becom e harder to detect at higher contrasts (Legge, 1981).
5. .O V ERV IEW channel.
5
O v e r v ie w
T he studies discussed in th e previous sections dem onstrate th a t stereopsis does not represent th e action of a single, uniform mechanism. R ath er, th e visual system appears to be sensitive to properties of disparity fields th a t are directly related to im p o rtan t properties of object and surface shape. These include discontinuities in, and gradients of, horizontal disparity, orientation disparities and, m ore contro versially, spatial frequency disparities, E In addition, it has been proposed th a t / stereopsis has access to independent linear and nonlinear channels. This suggestion is m ade of the grounds th a t luminance^ defined binocular disparities is not necessary for th e perception of stereoscopic depth.
The aim of this thesis is to explore how lum inance and contrast envelope inform ation are used in stereopsis, and how different types of disparity are combined in th e representation of depth. Prim arily, the thesis explores th e relationship between lum inance and contrast disparities. In doing so, it addresses th e question of w hether th e two forms of disparity are processed by a single mechanism , or w hether separate linear and nonlinear stereoscopic processing channels exist.
Previous studies of contrast envelope stereopsis have used G abor and contrast modu-
^ Although outside the scope of this thesis, it is also proposed that stereopsis m ay be divided into global and local operations (Julesz, 1971; Tyler, 1971,1975,1990). Global stereopsis is associated w ith stim uli such as random dot stereograms, in which the correspondence problem has to be solved in the face of ambiguous possible binocular matches. Conversely, local processing operates on features for which binocular matching is unambiguous.
5. OVERVIEW
lated random dot stim uli to m anipulate lum inance and contrast envelope disparities independently. These stim uli have suffered from the problem th a t, when lum inance and contrast disparities are different, they provide different cues to depth. An im po rtan t observation of Rogers and G raham (1983) was th a t, for slanted surfaces, the m agnitude of orientation disparities m ay vary independently of th e m agnitude and direction of surface slant. For a given binocular transform ation, th e orienta tion disparity of an image contour will depend on its orientation. In this thesis, this property is used to m anipulate lum inance and contrast envelope disparities independently, w ithout necessarily introducing any conflict between th e two. This m ethodology is applied to assess the roles of th e two sources of disparity inform ation in stereopsis. Further, this m anipulation allows for an exam ination of th e roles of positional, orientation and frequency disparities from th e two sources of inform ation in the representation of surface slant.
2. G rating and plaid slant
th resh old s
1
I n tr o d u c tio n
T he experim ents presented here address two questions concerning the encoding of stereoscopic slant. The first relates to the types of image disparity th a t are utilised in slant perception; th e second, the types of m onocular inform ation which m ay support this disparity processing. Specifically, th e experim ents address th e roles of o rientation, positional and spatial frequency disparities in determ ining stereoscopic slant thresholds, and th e extent to which slant may_he inferred from disparities in im age contrast envelopes.
1. IN TRO D U C TIO N
(1983) showed th a t th e anisotropy related to th e axis of slant m ay be predicted if orientation disparities represent an im portant cue to slant. Cagenello and Rogers (1993) dem onstrated th a t this anisotropy is dependent on th e orientation of surface contours, which determ ine the orientation disparity associated w ith a given binocular transform ation. Further, von der Heydt et al. (1981) showed th a t slant is clearly perceived from binocular images containing lines of random lum inance w ith different orientations in left and right eyes, even if th e lines them selves are un correlated. Finally, Ninio (1985) dem onstrated th a t orientation disparities are im p o rtan t in th e perception of sm ooth surfaces.
O rientation disparities cannot, however, explain th e perception of slant in all situ a tions. Slant may be perceived in stimuli consisting of grids of horizontal and vertical lines, w ith a horizontal gradient of disparity. This stim ulus contains no orientation disparities. Slant perception must therefore make use of other disparity cues. Two possible cues are positional disparity gradients (Ryan and Gillam , 1993) and diffre- quencies (Blakemore, 1970; Tyler and Sutter, 1979; H alpern, P atterso n and Blake, 1987; Tyler, 1990; Rogers and Bradshaw, 1994; H alpern, W ilson and Blake, 1996 ). Diffrequencies are defined as interocular differences in spatial frequency. Typically, diffrequencies have been studied with relation to vertical, one dim ensional signals (Blakemore, 1970; Tyler and Sutter, 1979; H alpern et al., 1987; Rogers and B rad shaw, 1994). Under these conditions, diffrequencies are associated w ith slant about a vertical axis (Blakemore, 1970).
1. INTRODUCTION
S h e a r
E x p a n sio n C om pression
« O. tn Q C O C a) O
0 15 30 45 60 75 90
O r i e n t a t i o n ( d e g r e e s f r o m h o r i z o n t a l )
E x p a n sio n C o m p r essio n S h ea r
ü C 0) g cr (U k
0 15 30 45 60 7 5 90
(A )
O r i e n t a t i o n ( d e g r e e s f r o m h o r i z o n t a l )
(B )
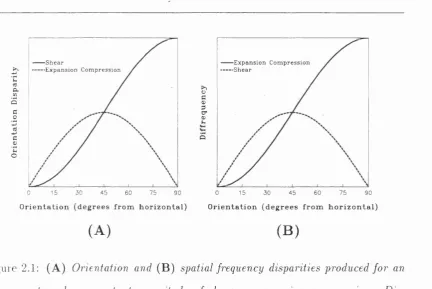
Figure 2.1: (A ) Orientation and (B ) spatial frequency disparities produced f o r an irnag( contour hy a constant magnitude o f shear or expansion-compression. Dis
parities dr-nffui upon the orientation o f the contour. The shear transformation
produces m a x i m u m orientation differences f o r vertical gratings, and maximum,
fre-qiK ucy differences f o r gratings oriented at ±45°; the reverse is true f o r an expansion-compression (see appendix A).
how orientation and frequency disparities vary as a function of orientation. For slant about a horizontal axis, maximum orientation disparities occur for vertical image contours, and maximum diffrequencies for contours at 45°. For slant about a vertical axis, this pattern is reversed. Overall, m axim um orientation disparities occur for vertical contours subjected to a vertical disparity gradient, while m axim um frequency disparities occur for vertical contours subjected to a horizontal disparity gradient.