M E T H O D O L O G Y
Open Access
Alignment of gene expression profiles from test
samples against a reference database: New
method for context-specific interpretation of
microarray data
Sami K Kilpinen
*, Kalle A Ojala and Olli P Kallioniemi
** Correspondence: sami.k. [email protected]; Olli. [email protected] Institute for Molecular Medicine Finland (FIMM), University of Helsinki, Tukholmankatu 8, Helsinki, Finland
Abstract
Background:Gene expression microarray data have been organized and made
available as public databases, but the utilization of such highly heterogeneous reference datasets in the interpretation of data from individual test samples is not as developed as e.g. in the field of nucleotide sequence comparisons. We have created a rapid and powerful approach for the alignment of microarray gene expression profiles (AGEP) from test samples with those contained in a large annotated public reference database and demonstrate here how this can facilitate interpretation of microarray data from individual samples.
Methods:AGEP is based on the calculation of kernel density distributions for the
levels of expression of each gene in each reference tissue type and provides a quantitation of the similarity between the test sample and the reference tissue types as well as the identity of the typical and atypical genes in each comparison. As a reference database, we used 1654 samples from 44 normal tissues (extracted from the Genesapiens database).
Results:Using leave-one-out validation, AGEP correctly defined the tissue of origin
for 1521 (93.6%) of all the 1654 samples in the original database. Independent validation of 195 external normal tissue samples resulted in 87% accuracy for the exact tissue type and 97% accuracy with related tissue types. AGEP analysis of 10 Duchenne muscular dystrophy (DMD) samples provided quantitative description of the key pathogenetic events, such as the extent of inflammation, in individual
samples and pinpointed tissue-specific genes whose expression changed (SAMD4A)
in DMD. AGEP analysis of microarray data from adipocytic differentiation of
mesenchymal stem cells and from normal myeloid cell types and leukemias provided quantitative characterization of the transcriptomic changes during normal and abnormal cell differentiation.
Conclusions:The AGEP method is a widely applicable method for the rapid
comprehensive interpretation of microarray data, as proven here by the definition of tissue- and disease-specific changes in gene expression as well as during cellular differentiation. The capability to quantitatively compare data from individual samples against a large-scale annotated reference database represents a widely applicable paradigm for the analysis of all types of high-throughput data. AGEP enables systematic and quantitative comparison of gene expression data from test samples
against a comprehensive collection of different cell/tissue types previously studied by the entire research community.
Background
Gene expression microarray data published by the entire biomedical community have been organized and made available for data mining in several public databases (e.g. Oncomine, Gene Expression Omnibus, Array-express, GeneSapiens) [1-7]. This has facilitated analyses of gene networks and gene regulatory processes [8-12], and the identification of tissue- or disease-specific gene expression patterns [13-19]. Compre-hensive microarray databases could also provide a powerful reference for guiding inter-pretation of new microarray data produced from test samples [20]. Such an approach would be particularly appealing for the analysis and interpretation of data from indivi-dual samples. Here, we have developed a microarray data analysis approach based on the similar concept as the simple, yet highly powerful and versatile sequence alignment comparisons (e.g. BLAST) for matching an unknown test DNA sequence against a comprehensive reference database of previously sequenced samples. The Alignment of Gene Expression Profiles (AGEP) method compares expression profiles of individual test samples with reference data obtained from large public gene expression microarray databases that are normalized to allow direct quantitative comparisons with the data from the test sample. The method provides the likelihood of the profile representing each of the known reference profiles as well as the sets of genes that show concordant and discordant expression levels against each of the reference datasets. Here, we describe the AGEP method and validate its utility in the analysis of microarray data from normal and disease tissue types as well as the quantitative analysis of cell differ-entiation patterns.
Results
Description of the AGEP method
We have created a tool to facilitate the comprehensive analysis and interpretation of gene expression profiles from individual test samples by comparing them against a reference dataset of previously analyzed, well-characterized and annotated samples from different tissues, pathologies, cell types or treatments. The AGEP method is based on the use of kernel density estimates for the expression levels of genes across each of the reference sample types (e.g. tissues). Density estimates make it possible to determine which gene expression states are characteristic for each gene in each tissue type, and can be used to compare individual test samples against the reference data.
sample types. For further description of the data or the normalization, see [7,21]. All the individual test samples were similarly normalized to make them comparable against the reference data.
For each gene in each tissue type in the reference data, we first calculated the density estimate of expression values between zero and the maximum observed value in the entire reference data,(Additional file 2A-B) using kernel density estimation. This resulted in both gene- and tissue type-specific density estimates. Approximately 16% of the genes had a bi- or multimodal distribution in the reference tissues highlighting the importance of using density distributions as a base for the AGEP analysis.
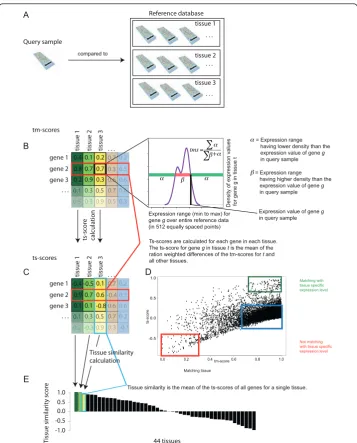
After transforming the entire reference dataset into density estimates, data from indi-vidual test samples can be compared against the density estimates of the reference data (Figure 1A). In order to achieve this, we first quantify for each gene how well its expression level in the test sample matches the levels seen in each of the tissue types in the reference data. This similarity is defined as the tissue match score (tm-score) for each gene in each reference data tissue type, ranging from 0 (no match) to 1 (perfect match). The tm-score is defined by calculating the proportion of the expression range for a gene where the density estimate in a particular reference tissue type is lower than the value of that gene in test sample (Figure 1B). It can be thought of as the likelihood
that the test sample’s value matches with the most frequently observed expression
range for this gene in that specific tissue type. For example, if a gene is expressed in the test sample at a level which has the highest density value in a reference tissue type, then the tm-score for that gene is 1 for this reference tissue type. Therefore, based only on this one gene, the test sample matches the reference tissue perfectly.
Tm-scores (Figure 1B) define how well the expression values in a test sample match with each of the reference tissue types however they do not define how unique, or tis-sue specific, those matches are among the various reference tistis-sue types. In other words, a gene in a test sample may have an expression value with a perfect match (tm-score of 1) against a reference tissue, but compared to the tm-(tm-scores of other reference tissues, this match may be completely unique or not unique at all (Additional file 2C).
A
Expression range (min to max) for gene g over entire reference data (in 512 equally spaced points)
Density of expression values for gene g in tissue t
tms= B -1.0 -0.5 0.0 0.5 1.0 T issue similarit y sc or e 44 tissues D tissue 1 . . . tissue 2 . . . Reference database tissue 3 . . . Query sample gene 1 gene 2 gene 3
tissue 1 tissue 2 tissue 3 . . .
. . . 0.4 0.1 0.8 0.2 0.7 0.9 0.2 0.7 0.3 C gene 1 gene 2 gene 3
tissue 1 tissue 2 tissue 3 . . .
. . . -0.4 -0.5 0.9 0.1 0.7 0.1 0.1 0.6 -0.8 tm-scores ts-scores ts-scor e calculation
Tissue similarity is the mean of the ts-scores of all genes for a single tissue. 0.4 0.1 0.8 0.2 0.7 0.9 0.2 0.7 0.3 0.7 0.3 0.6 0.7 0.5 0.3 0.1 0.2 0 0.5 0.6 0.66 0.5 0.9 0.3 0.5 0.3 0.7 -0.4 0.6 0.7 0.5 0.3 0.1 0.2 0.3 0.6 0.2 0.3 0.9 -0.3 0.2 -0.1 +
Expression value of gene g
in query sample = Expression range having higher density than the expression value of gene g
in query sample = Expression range having lower density than the expression value of gene g
in query sample
Ts-scores are calculated for each gene in each tissue. The ts-score for gene g in tissue t is the mean of the ration weighted differences of the tm-scores for t and all other tissues.
Tissue similarity calculation compared to
0.0 0.2 0.4 0.6 0.8 1.0 -0.5 0.0 0.5 1.0 E Matching with tissue specific expression level Not matching with tissue specific expression level
Matching tissue
ts-score
tm-score
Figure 1Principle of the AGEP method, comparing microarray data from one test sample against a
large reference database of different tissue/cell types. A) The expression profile of a test sample is first
normalized to be compatible with reference data. Density estimates are then calculated for expression levels of each gene in each reference tissue type. B) Data for each gene in the test sample is aligned with the density estimates of all the normal reference tissue types to calculate an tissue match score (tm-score). This defines the likelihood that the expression of the gene originates from the reference values, with the score of 1 indicating that the gene in the input sample had the best match with the levels for that tissue type. A tm-score of 0 means that the input sample had an expression level that did not match the reference tissue type at all. C) Tissue specificity scores (ts-scores) for each gene of the test sample for each tissue in the reference database are then calculated from the tm-score matrix (see methods). Ts-scores range from -1 to 1 and indicate how uniquely the test sample resembles a certain tissue type according to
the gene’s expression level. D) Scatter plot visualization of tm- and ts-scores of all genes for a single query
The comparison of individual test sample against the reference tissue types leads to a matrix of tm-scores (Figure 1B) and a matrix of ts-scores (Figure 1C). The interpreta-tion of both these scores for one individual test sample is summarized in Figure 1D showing for all genes how good the match was (tm-scores on the x-axis) and how unique the match was (ts-scores on the y-axis). Genes highlighted in green have both
high tm-scores and high ts-scores meaning that the test sample’s expression levels for
those genes both matched with that reference tissue type (high tm-score), and that this match was also unique to that tissue type (high ts score). Genes highlighted in red are such that they have a tissue specific expression level in the reference data tissue in question but the expression values in the test sample did not match those. Their tm-score for the reference tissue in question were very low, and the tm-tm-scores for other tissues were high, thus the ts-score ended negative. Genes highlighted in blue have
high tm-scores meaning that these genes’expression in the test sample matched well
with the reference tissue type, but that these expression levels also matched with many other reference tissues, implying little or no uniqueness (ts-scores around zero). Both the tissue match (tm) and tissue specificity (ts) scores can be used to interpret the nat-ure of a test sample. One such interpretation is to calculate the average of the ts-scores for each of the reference tissue types (Figure 1E). This tissue similarity score can be used as a metric to identify the tissue of origin of the test sample.
Detailed methods and formulae are provided in the methods section.
Comparing AGEP with existing methods
The idea of using existing microarray data to identify or categorize a new external sample is not new. Many scientists are using unsupervised clustering methods, such as hierarchical and k-means, to understand relationships between samples. Unsupervised clustering is considered as a simple, yet effective method. However, if the reference data are complicated and do not cluster according to their annotation, classification of the outside sample is challenging if not impossible.
In comparison to existing methods, AGEP method can be termed a search & retrie-val based method comparing single or multiple query samples against a reference data-base [22-24]. Search & retrieval methods not only try to identify most similar reference group, a task of traditional classifiers like nearest-neighbor (NN) [25,26] and support vector machines (SVM) [27-29], but also to provide interpretation of the component-wise (e.g. gene-by-gene) contributions to the similarity match.
AGEP performance in tissue identification task with both leave-one-out cross-valida-tion (LOOCV) [30] of the entire reference database and with an external dataset was compared to both a nearest-neighbor classifier [25,26], traditional instance-based lear-ner, and to SVM [27-29], more complex algorithm with good classifying performance. These both are supervised clustering methods, suitable for tissue identification tasks and therefore suitable for benchmarking AGEP performance in the same task.
LOOCV of the entire reference database with nearest-neighbor (NN) classification produced 65.1% overall accuracy with Euclidean distance, and 90.2% with Pearson cor-relation coefficient (Table 2). SVM resulted in 94.4% overall accuracy in 10-fold CV (Table 1) of the entire reference database. 10-fold CV, another well established way to evaluate classifier performance [30], was chosen instead of LOOCV for SVM due to Table 1 Accuracy of the AGEP method to finda prioriknown annotation class as primary hit in leave-one-out cross validation of the entire reference database against itself and accuracy of the SVM to finda prioriknown annotation class in 10-fold cross-validation of the entire reference database
AGEP Accuracy Nearest-neighbour (correlation) SVM Accuracy
Max 100% 100% 100%
75% percentile 100% 100% 100%
Median 96.4% 93.7% 96.7%
Mean 93.7% 90.7% 90.4%
25% percentile 90.3% 81.5% 91.7%
Min 58.3% 69.2% 9.1%
Overall 93.6% 90.2% 94.4%
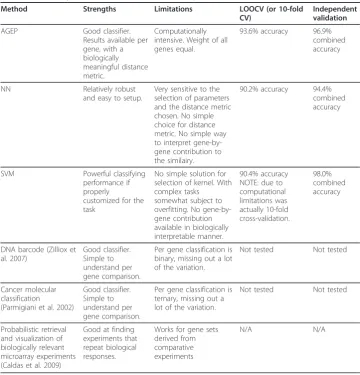
Table 2 Summary of the tissue identification capabilities of most related methods
Method Strengths Limitations LOOCV (or 10-fold
CV)
Independent validation
AGEP Good classifier.
Results available per gene, with a biologically meaningful distance metric.
Computationally intensive. Weight of all genes equal.
93.6% accuracy 96.9%
combined accuracy
NN Relatively robust
and easy to setup.
Very sensitive to the selection of parameters and the distance metric chosen. No simple choice for distance metric. No simple way to interpret gene-by-gene contribution to the similairy.
90.2% accuracy 94.4%
combined accuracy
SVM Powerful classifying
performance if properly
customized for the task
No simple solution for selection of kernel. With complex tasks somewhat subject to overfitting. No gene-by-gene contribution available in biologically interpretable manner.
90.4% accuracy NOTE: due to computational limitations was actually 10-fold cross-validation.
98.0% combined accuracy
DNA barcode (Zilliox et al. 2007)
Good classifier. Simple to understand per gene comparison.
Per gene classification is binary, missing out a lot of the variation.
Not tested Not tested
Cancer molecular classification
(Parmigiani et al. 2002)
Good classifier. Simple to understand per gene comparison.
Per gene classification is ternary, missing out a lot of the variation.
Not tested Not tested
Probabilistic retrieval and visualization of biologically relevant microarray experiments (Caldas et al. 2009)
Good at finding experiments that repeat biological responses.
Works for gene sets derived from comparative experiments
the computational requirements of SVM. Median imputation for missing values was used, which was necessary with SVM as virtually none of its implementations can han-dle missing values. This potentially enhanced the performance of SVM as the within tissue variation for median imputed genes was considerably lower than for non-imputed genes. Additionally, due to its constraints concerning missing data, SVM was run using only 11 834 genes of the 17 225 present in the data.
We then proceeded to compare the performance of all three methods with an exter-nal dataset of 195 healthy tissue samples from the Array Express [1] study E-GEOD-7307. Overall accuracy of the AGEP method to identify tissue of origin within this dataset was 96.9%, with 84.6% matching the exact tissue type and another 12.3% matching closely similar tissue types. In fact, all of these similar tissues were from the central nervous system and represented different anatomical parts of the brain. There-fore, only 3.1% of the external samples were identified incorrectly in terms of the tissue type (Additional file 6). With the same external dataset nearest-neighbour method (with Pearson correlation coefficient as distance measure) resulted in 78.3% accuracy to the exact tissue, and another 16.1% matching a similar tissue, leaving 5.6% of the samples incorrectly identified. SVM resulted in 98.0% overall accuracy.
The nearest-neighbour classifier achieves almost the same absolute accuracy than AGEP, but it has serious limitations. As highlighted by the LOOCV results, the choice of distance method greatly affects the results, while no biologically reasonable single distance method exists. Other commonly used instance-based learners, as k-nearest neighbor (k-NN), are also very sensitive to parameter selection. In contrast to AGEP,
there is no simple way to understand the individual genes’contribution to the
similar-ity. SVM offers a high accuracy as well, but does not offer gene-level data on the simi-larities either. Also, SVM methods are better suited to binary classification tasks, rather than choosing the correct group from a multitude of options. Ensembles of SVM classifiers have been successfully implemented for complex classification tasks, but they have a known tendency for over-fitting and usually require complex and diffi-cult case-by-case selection of the optimal kernel [31].
A recently published method by Caldas et.al. [23] provided 82% accuracy for identifi-cation of biologically relevant experiments when queried with data from external experiments. This method uses gene set enrichment, not individual gene expression, as the basis of its similarity. Therefore, data from individual samples cannot be analyzed, and the categories are experiments where a comparison between two sample sets is needed. This method also collapses the gene expression values by medians, thereby not addressing the problem of multimodal gene expression distributions, which AGEP was specifically designed to solve.
Other classification methods that operate per gene do exist, such as molecular classi-fication of cancer [24] and gene expression barcode [22]. These methods have been
found to be accurate in determination of tissue type, but they bin the genes’expression
profiles into on/off (bar code) or downregulated/normal/upregulated (molecular classi-fication) before using them for classification purposes. AGEP also operates on a per gene basis, but the way of looking at the expression profiles in the sample categories differs fundamentally from the abovementioned methods.
while having the advantages that AGEP can i) compare a single query sample against a reference database ii) take into account bi- and multimodal expression profile in refer-ence sample sets iii) deal with bi- and multimodal expression profiles, thereby more
accurately reflecting the actual gene expression variability ofin vivosamples iv) provide
biologically important gene-by-gene interpretation of the similarity against multiple references v) handle missing datapoints.
Biological interpretation of the gene-by-gene contribution to the similarity match As AGEP data for each gene is biologically interpretable we then evaluated and vali-dated the method in the interpretation of actual biological experiments.
Interpretation of microarray data I: Dystrophic muscle
We analyzed data from ten Duchenne muscular dystrophy (DMD) samples against the 44 tissue types in the reference database. In all cases striated muscle was identified as the primary alignment (Additional file 7). Heart and tongue also showed significant similarities, with uterus and prostate both scoring positively, probably linked to the relatively high smooth muscle content. Interestingly, adipose tissue was also among the top four alignments for all samples. This may reflect the common mesenchymal origin of these tissues as well as the fact that dystrophic muscle tissues may contain larger than normal amounts of adipose tissue [32]. For patient number four, adipose tissue was the second best normal tissue match. This sample may have contained more adi-pose tissue than others due to the disease progression [32] or specific subtype of the disease [33]. AGEP identified both the genes defining the similarity to the striated muscle as well as those with adipose tissue. This reflects the power of AGEP to pro-vide context-specific interpretation of microarray data.
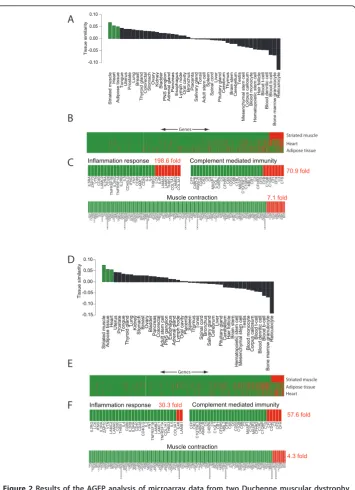
AGEP analysis of dystrophic samples against healthy striated muscle reveals the dis-ease-associated changes as as a decreasing level of alignment. For the sample from patient 3, gene sets with aberrant expression (Figure 2B-C) as compared to the refer-ence striated muscle included inflammation, complement mediated immunity and muscle contraction (with 198.6, 70.9 and 7.1 fold enrichment of atypically expressed genes as compared to normal muscle, with a p-value < 0.05 for each). These are expected differences in DMD [32,34,35] and were seen for all other disease samples, with the exception of patient 4, (Figure 2D).
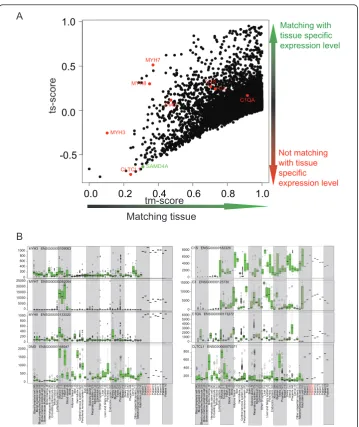
We also explored the AGEP results at the individual gene level (Figure 3). First we
selected five genes (MYH7, C1S,C3, C1QA,CLTCL1andDMD) previously known to
associate with DMD [33,32,36,37,35] and explored their alignment scores in individual
patient samples. The dystrophin gene, DMD, a gene whose mutations underlie most
muscular dystrophies [33], was underexpressed as compared to healthy muscle in all
but one patient (patient 4) and scored a mean 0.37 as the tm-score. In contrast,MYH3
and MYH8 displayed overexpression in all patients, both being known hallmarks of
dystrophic muscle [32,36], and received mean tm-scores 0.05 and 0.3, respectively.
MYH7 had lower expression than seen in healthy striated muscle with a mean
tm-score 0.5. CLTCL1expression was heterogeneous, with four Duchenne patients having
reduced expression levels that did not match muscle-typical levels with a tm-score of 0.28. In contrast, the mean of the tm-scores for the remaining patients was 0.79.
CLTCL1is involved in glucose transport in muscle tissue [38], a process known to be
Striated muscle Heart Adipose tissue Striated muscle Heart Adipose tissue
A
B
7.1 fold 4.3 fold Muscle contraction Muscle contraction Inflammation response 57.6 fold Complement mediated immunity Complement mediated immunity GenesC
D
GenesE
F
TNNI3CCK CACNA1HTAGLN3 TACR2 NEBL MYL7
CACNA1C
TPM3AVPR1BRY
R
2
CNN1
CAMK2AGALR3 TA
G
LN
TA
C
1
CAMK4 ADRB1 PRKG1MYLKPDLIM3 TNNT2OXTRADRB3
ENSG00000064042
CNN2
MYBPC3 MYBPC1
CACNA2D2
OXT
KCNMB1KCNJ5 ITPR2CACNB4EDNRAADORA1
GAL
CHRND
CACNA1A
MYL6B
UNC93B1
MYOTEDNRBTPM2 BDKRB2PRKG2
CACNA1F CACNA1D
MYL1
ADRA1BADORA2A NEBASPM
CACNB1CACNA1BCHRNG
ITPR1 CACNB3ADORA2B TNNI2 PDLIM4 CACNB2 CACNA2D3CCDC19 PTGDSADRA1D GAST KCNMA1 ENSG00000180209
ITPR3KCNE1 KCNJ2MYL4 MYL9CHRNETNNI1 PTGER1ALPK3 DTNB C3AR1CACNA1G
MYH4 UTS2
C14orf21
TPM4TNNT3CKB CKMPVALBMYH1 SGCB
ENSG000001
18680SRIDTNA GRPR TNNT1 CRYAA AVPR1ACNN3 BDKRB1SCN7A CACNA1E LASP1 ENSG00000106436 MYH15 VIP
TPM1 SETX PALLDAV
P
GALR2LMO7 BRS3 MYBPC2 CAMK2B CACNA1I
MYL2
MYOHD1 CHRNB1 MYH2TNNC1MYH6TNNC2ADRA1ACKMT2MYL3 NMBR
MYOM1 MYH7B MYOM2 PDLIM1DYSFCHRNA1PHKG1 MYH13NRAP CAMK2GMYBPH ENSG00000188055 MYL6 FER1L3 ENSG00000163106 RY R 1 CACNA1S CR Y AB
MYH8 TIAF1 MYH7 MYH3
MYL7
PTGER1 CACNB4RY
R
2
CACNA2D2
ADRB3 TNNI3TAC
1 AV P CCK CACNA1D OXT VIP CHRNG ENSG00000064042
CACNA1ACACNB1MYH2CAMK4
CACNA1H
NEBLTNNT3 CACNA1FCAMK2AKCNJ5 EDNRB MYH15
ENSG00000180209
ADORA2AMYBPC3TA
C
R
2
C14orf21 CACNA1I UNC93B1 CACNA1BCACNA2D3CACNA1G MYOT TNNI2
ADRA1B AVPR1BTAGLN3BDKRB1ADRB1
ENSG000001
18680
MYBPC1
ITPR2 ASPM ALPK3PDLIM3 PRKG2 CACNA1EKCNMA1 ADRA1A
OXTRSRITNNT1 KCNJ2CNN1 DYSF LMO7
CACNB2
NEB GAL CACNB3GALR3DTNB TNNI1 SETX
CCDC19ITPR3SCN7ACNN2
ENSG00000163106
PTGDSMYL3
ADORA2B
MYLKEDNRA CKMITPR1 TPM2
ENSG00000106436 TIAF1 A VPR1A ADORA1MYL6B TPM3PV ALB CACNA1C
MYH13 CKMT2 CRY
AA
KCNMB1
DTNATAG
L
N
CACNA1S
MYL1 TPM4 UTS2 BRS3CKB TNNC2BDKRB2KCNE1 TNNC1 CHRNEMYL4 GAST
MYBPC2 MYOHD1 MYH1MYH7B GALR2CAMK2B ADRA1DPDLIM1MYH4 MYL2CR
Y
AB
SGCBPRKG1 NMBRTPM1 NRAP CHRNB1 MYOM1 CAMK2G
MYH6 PA LL D GRPR MYOM2 CHRNA1 ENSG00000188055
MYH7 MYL6 MYL9PDLIM4RY
R
1
FER1L3LASP1 C3AR1 CHRND TNNT2CNN3PHKG1 MYBPHMYH8 MYH3 IL5RA ZAP70VTNCD40
LAMC2IL2RA CD28
TNFRSF1B IL2RG TNFRSF1A IL2RB IL5 CD40LG
IFNGFN1CD86 LAMC1CD80
IL2 IL4
THBS3
LCK IL4R LAMA5 LAMB1 THBS1COL1A1LAMB2COL3A1
198.6 fold Inflammation response
CFP
C4BPB AMACRCD46 CR2C6 C9
MASP1 C1QL1 C4BP AC5
CFHR5
C8ACD55C8BC1RL
MASP2 C1QTNF1 C1QBPMBL2 CR1C2 CFHR2 CFD CFB C1QB C1QACFI CFH
C3
C1S
70.9 fold
IL2RGLCK IFNGIL2RA ZAP70VTNLAMC2 LAMA5CD80THBS1
IL4
CD86 IL2RB IL5RA CD40 CD28
CD40LG IL2FN1 TNFRSF1B LAMB2 LAMC1 TNFRSF1A COL1A1THBS3 IL5 COL3A1 IL4R LAMB1 CFP CR2 C1QTNF1C4BPB AMACR
C5 C4BP AC9 C1QL1 CR1 CFHR5MBL2 CFB C8AC6
CD55 C1QBC8B
C2
MASP1C1QAMASP2 CFHR2C1RLC1QBP C1S CFICD46C3CFD CFH
30.3 fold
Striated muscle
Heart
Adipose tissue
Tongue Uterus Prostate
Lung
Breast
Thyroid gland
Colorectal Stomach Ovary Kidney Bladder
PNS ganglion Adrenal gland
Pancreas
Esophagus
Lymph node Oral cavity Bronchus Placenta
Salivary gland
Tonsil
Adult stem cell
Spleen
Spinal cord
Liver
Pituitary gland
Cerebrum Thymus Brain stem Cerebellum
Testis
Mesenchymal stem cell
Corpus callosum Blood monocyte
Hematopoietic stem cell
Hair follicle Blood t-cell
Blood denritic cell
Blood b-cell
Bone marrow granulocyte
Reticulocyte Tissue similarity -0.10 -0.05 0.00 0.05 0.10
Striated muscle Adipose tissue HeartUterus Prostate Tongue Thyroid gland Lung Kidney Stomach
Breast OvaryBladder Pancreas Colorectal
Adult stem cell PNS ganglion
Esophagus
Adrenal glandLymph node Oral cavity Placenta
Spleen Thymus Tonsil Spinal cord Bronchus
Salivary gland
Cerebrum
Liver
Pituitary gland
Cerebellum Hair follicle Brain stem
Hematopoietic stem cell Mesenchymal stem cell
Testis
Blood monocyte Corpus callosum
Blood t-cell
Blood denritic cell
Blood b-cell
Bone marrow granulocyte
Reticulocyte Tissue similarity -0.15 -0.10 -0.05 0.00 0.05 0.10
Figure 2Results of the AGEP analysis of microarray data from two Duchenne muscular dystrophy
samples against the reference database. A) The sample from patient 3 resembles most closely striated
muscle among the 44 reference tissues. B) Alignment of the patient’s transcriptome at the level of
individual genes. On the x-axis are genes (17 330) and on the y-axis the three most similar tissues. Green color indicates that the genes have an expression level typical for that tissue, whereas red indicates atypical expression levels. Genes have been ordered according to their level of similarity against the most similar tissue (striated muscle). C) View of distinct gene sets and pathways for the most similar tissue (striated muscle). Relative enrichment of atypical genes is shown on the right side to illustrate aberrant gene expression levels for individual patient samples. Genes involved in inflammation response,
Blood lymphoid cell (96)Blood myeloid cell (32)
Blood unspecified leukocyte (28)Bone marrow lymphoid cell (2) Bone marrow myeloid cell (10)
Bone marrow (8)
Hematopoietic stem cell (26)Circulating reticulocyte (30)
Whole blood (41)
Lymphatic system (96)
Muscle (73) Tongue (11)Heart (49)
Blood vessel (8)
Bone (2)
Adipose tissue (16)
Skin (3)
Hair follicle (16)
Central nervous system (425)
Peripheral nervous system (20)
Eye (4) Gum (2)
Salivary gland (9)
Respiratory system (123)
Mesothelium (4)Colorectal (23)
Other GI system (33)
Liver (15)
Liver and biliary system (9)
Pancreas (17)
Endocrine system (52)
Kidney (59) Bladder (20)Testis (22)
Prostate (147)
Breast (15) Ovary (10) Uterus (30)
Placenta (48)
Cervix (4)
Other urogenital system (11) Mesenchymal stem cell (10)
Adult stem cell (10)
Patient 1 Patient 2Patient 3 Patient 4Patient 5 Patient 6 Patient 7 Patient 8 Patient 9
Patient 10 0 200 400 600 800
1000 MYH3 ENSG00000109063
0 5000 10000 15000 20000
25000MYH7 ENSG00000092054
0 200 400 600 800
1000 MYH8 ENSG00000133020
0 2000 4000 6000 8000 0 5000 10000 15000 0 1000 2000 3000 4000 5000 6000
Blood lymphoid cell (96)Blood myeloid cell (32)
Blood unspecified leukocyte (28)Bone marrow lymphoid cell (2) Bone marrow myeloid cell (10)
Bone marrow (8)
Hematopoietic stem cell (26)Circulating reticulocyte (30)
Whole blood (41)
Lymphatic system (96)
Muscle (73) Tongue (11)Heart (49)
Blood vessel (8)
Bone (2)
Adipose tissue (16)
Skin (3)
Hair follicle (16)
Central nervous system (425)
Peripheral nervous system (20)
Eye (4) Gum (2)
Salivary gland (9)
Respiratory system (123)
Mesothelium (4)Colorectal (23)
Other GI system (33)
Liver (15)
Liver and biliary system (9)
Pancreas (17)
Endocrine system (52)
Kidney (59) Bladder (20)Testis (22)
Prostate (147)
Breast (15) Ovary (10) Uterus (30)
Placenta (48)
Cervix (4)
Other urogenital system (11) Mesenchymal stem cell (10)
Adult stem cell (10)
Patient 1 Patient 2Patient 3 Patient 4Patient 5 Patient 6 Patient 7 Patient 8 Patient 9
Patient 10
C1S ENSG00000182326
C3 ENSG00000125730
C1QA ENSG00000173372
0 500 1000 1500
2000DMD ENSG00000198947
200 400 600 800
CLTCL1 ENSG00000070371
A
0.0 0.2 0.4 0.6 0.8 1.0
-0.5 0.0 0.5
1.0 Matching with
tissue specific expression level Not matching with tissue specific expression level Matching tissue tm-score ts-score B CLTCL1 MYH3 MYH8 MYH7 DMD C1S C3 C1QA SAMD4A
Figure 3A) Scatterplot of tm- and ts-scores of DMD patient (number 4) when compared against
healthy striated muscle. On the x-axis are tm-scores of the patient and on the y-axis are ts-scores of the
patient. As explained in the figure 1D, upper right corner (high tm- and ts-scores) indicate genes having muscle specific expression and the query sample had expression level matching that. In this case there is clearly a group of genes having expression level assumed and specific for muscle and for this part the patients transcriptomic profile resembles healthy striated muscle. On the lower left corner are the genes (low tm- and ts scores) having muscle specific expression level (ts-score deviating from zero) but the query sample did not have expression level matching it. Thus these genes are potentially related to DMD. Eight
a prioriknown DMD related genes are highlighted in red while novel gene in DMD (SAMD4A) is
highlighted in green. SAMD4A has extremely muscle specific expression level but the query sample did not have expression matching it. B) Visualization of the normalized expression levels of selected genes from ten Duchenne Muscular Dystrophy samples in relation to the expression levels of these genes across all 44 normal tissue types. The green boxplot data display statistical data on gene expression for each of the normal tissue types (according to http://www.genesapiens.org), with the data from the 10 individual
DMD samples added to the far right. Patients illustrated in figure 3 are colored red.MYH3,MYH7and
MYH8.MYH3andMYH8(left panel) are muscle contraction genes, whose expression is discordant for DMD
tissue in patients 3 and 4. DMD samples show dramatic differences both between the patients and healthy
striated muscle for the levels of expression of these genes. On the right panel are boxplots of genesC1S,
C3,C1QA, representing key components of the complement mediated immunity process, whose expression
values are different both between the patients and the healthy striated muscle.CLTCL1is an interesting
complement mediated immunity contributing to muscular dystrophy [35], also showed heterogeneous expression across the dystrophy samples, with corresponding changes in tm-scores. Having demonstrated the capability of AGEP to provide patient-specific alignment scores for the individual genes in a context-specific way, matching the pre-vious biological knowledge on the disease biology (Figure 3), we then tested AGEPs ability to pick novel genes that have a muscle-specific expression which gets lost in the
DMD disease samples. SAMD4Ais highly muscle-specific gene, coding for a
posttran-scriptional regulator, but was among the 10 genes with the lowest ts-score of all genes in the DMD samples (the smaller the ts-score is the less gene matches the expression
level unique for the tissue). SAMD4Ahad lost its muscle specific expression level in all
dystrophy patients (mean ts-score of all patients -0.57). To our knowledge, loss of
muscle specific expression of the SAMD4Agene has never been associated with DMD
before.
As compared to other patients, patient number 4 had a unique disease with similari-ties to adipose tissue, less inflammation and immunity response, less impact on muscle contraction genes and dramatically reduced CLCTL1 expression (tm- ts-score scatter-plot displayed in Figure 3A), giving a powerful example of the ability for AGEP analysis to rapidly reveal patient-specific characterization of molecular properties. The scatter-plot identifies genes with a muscle specific expression pattern, and whether the query
sample matched that expression or not. Genes with a low tm-score (doesn’t match
muscle) and a negative ts-score (matches other tissues better) reside in the lower left corner of the plot, indicating genes with muscle specific expression patterns that do not match the query. Similarly, genes with a muscle specific expression matching the query are located in the upper right corner.
Taken together, this DMD example indicates, how AGEP allows interpretation of transcriptomic profiles of individual patients at a level of tissues, biological processes and individual genes and will facilitate the molecular interpretation of microarray pro-files from individual disease samples.
Application of the array alignment for the microarray data analysis II: stem cell differentiation
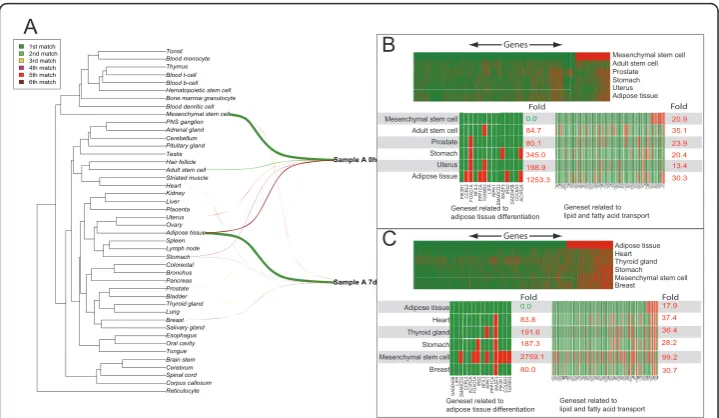
We then explored the AGEP method in the analysis and interpretation of transcrip-tional changes from a study of differentiating mesenchymal stem cells to adipocytes with three replicate samples measured over 5 time points (0 h, 1 h, 3 h, 9 h and 7d). Each of the 15 samples was aligned against 44 tissue types in the reference database to uncover transcriptional changes.
As anticipated, all the samples were initially similar to MSCs (Figure 4A, Additional file 8). Genes related to adipose tissue differentiation were expressed at the level expected for MSCs, and at an atypical level for adipose tissue (fold enrichment 1253.3 with p-value < 0.05) (Figure 4B). During the time series, AGEP analysis indicated how the transcriptomic program of the cells changed away from MSCs and gained similar-ity to adipose tissue. At 7 days, two samples already resembled adipose tissue more than MSCs. At this point, part of their transcriptome displayed heart-specific features
as well. While the extent of this change was unexpected, in vivoderived MSC tend to
differentiate in vitroto cardiac myocyte like cells [39].
adipose tissue, whereas a significant proportion (fold enrichment 2759.1, with p-value < 0.05) of these genes are no longer expressed at the typical MSC level. Similarly lipid and fatty acid transport genes have acquired expression values expected for adipose tis-sue, and a large number of them are now atypical for MSCs (110.6 fold relative enrich-ment with p-value < 0.05). In summary, during the differentiation, MSC-specific transcriptomic program is gradually lost and adipose tissue like program gained.
How-ever, the cells do not reach the full in vivoadipose tissue transcriptomic profile.
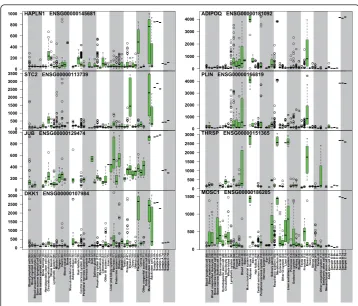
We further studied the genes with the highest match to MSCs at the 0 h time point, and those with adipose tissue as the highest match at the 7d time point replicates
(Figure 5). HAPLN1,STC2,JUB andDKK1 had the highest ts-scores for MSC
similar-ity at the 0 h time point.ADIPOQ,PLIN,THRSPand MOSC1genes all gained full
adi-pocyte specific expression levels at 7 days, these genes are known to be adipose tissue related [40-43]. As a summary, AGEP analysis of the data on stem cell differentiation demonstrates the ability of the technology to quantitatively follow the gradual tran-scriptomic changes during mesenchymal differentiation, revealing both expected (stem cell to adipose tissue) and unexpected (heart tissue) differentiation, along with the identification of the specific gene expression differences in each comparison.
A $GLSRVHWLVVXH 8WHUXV 6WRPDFK 3URVWDWH $GXOWVWHPFHOO 0HVHQFK\PDOVWHPFHOO *HQHVHWUHODWHGWR DGLSRVHWLVVXHGLIIHUHQWLDWLRQ 20.9 35.1 23.9 20.4 13.4 30.3 0.0 84.7 80.1 345.0 198.9 1253.3 *HQHVHWUHODWHGWR DGLSRVHWLVVXHGLIIHUHQWLDWLRQ $GLSRVHWLVVXH +HDUW 7K\URLGJODQG 6WRPDFK 0HVHQFK\PDOVWHPFHOO %UHDVW B Fold Fold Fold Fold C
3,.5 &&5/)2;2$
1),/
333&$ 7*)%5 /,)55,3.
60$5&':$6)
,56
*$''%&2/$ $&95$
*$''%
/,)5
60$5&'
&&5/$&95$ )2;2$,56 1),/ 5,3.333&$ :$6) 3,.5 &2/$ 7*)%5 0.0 83.8 191.6 187.3 2759.1 80.0 %=53/ 5%3 303 $73%$73% )$%3 &(17' 6&$5%70(0%3&73$%&$$%&$ $32( )$%33/6&5&$9$%&*26%3/)$%3 $32$5%3&5$%3$%&* )$%35%3$32/
26%3/ 6/&$$2$+3,7310 6/&$$73%26%3/$%&' 6+%* 26%36/&$)$%3 )$%3 $32%6/&$7632 $%&$ $32&26%3/5%3$%&'$32)$32$ $%&$ 6/&$$%&$67$5'$32/ $&%' $%&' $32$ $%&$ $73$&(73&2/$%3
$%&$ $%&$ $%&'$59 3/6&5 3,7310 6/&$$32/ $32/ $6&& $73& &5$%3 3/6&5 $73% $32$13& 13&6/&$ $73%$73' $73$ $%&$ $32& 625/ $32& $%&$ $%&$26%33/6&5 +'/%336$3 &$9 &$913&/
26%3/ 6/&$)$%3 )$%367$5' $32&)$%33,7310$32$ $73%)$%33,7310$%&' 6+%* $2$+ $%&$26%3/$%&$ $73' &5$%3 $32& $%&$ 26%3 )$%3 %=53/ $%&$ $32& $73%$32(&5$%3 6/&$$32$ $73$$32%$&%' $%&$ $73% $%&'26%3/$32/6&$5% 6/&$&2/$%3$%&*13&/ $%&$ +'/%3 &(17')$%3625/ $%&' $73%6/&$$%&$$%&* 3/6&5 $%&$ $32$ 3/6&5 $73&6/&$3/6&5$6&& $32/ 70(0%6/&$$%&$ $%&$3/6&5 $32$ $73%26%3/6/&$$%&$ $32/$%&' $73$ $32/
*HQHVHWUHODWHGWR OLSLGDQGIDWW\DFLGWUDQVSRUW
*HQHVHWUHODWHGWR OLSLGDQGIDWW\DFLGWUDQVSRUW
Adipose tissue Adult stem cell Heart
Cerebrum Bronchus
Lung Hematopoietic stem cell
Mesenchymal stem cell Bone marrow granulocyte Blood t-cell Thymus Blood monocyte
Reticulocyte Blood b-cell
Blood denritic cell
Lymph node Tonsil Oral cavity Spleen Tongue Salivary gland Esophagus Stomach Colorectal Liver Pancreas Kidney Bladder Testis Prostate Ovary Uterus Placenta Breast Pituitary gland Thyroid gland Adrenal gland Striated muscle Hair follicle Cerebellum PNS ganglion Brain stem Corpus callosum Spinal cord
Sample A 7d Sample A 0h
1st match 2nd match 3rd match 4th match 5th match 6th match d Genes Genes $GLSRVHWLVVXH 8WHUXV 6WRPDFK 3URVWDWH $GXOWVWHPFHOO 0HVHQFK\PDOVWHPFHOO %UHDVW 0HVHQFK\PDOVWHPFHOO 6WRPDFK 7K\URLGJODQG +HDUW $GLSRVHWLVVXH
Figure 4Alignment of transcriptomes of two samples from a differentiation series of mesenchymal
stem cells at the 0 h and 7d time-points. A) Alignments for the two time-points are visualized in
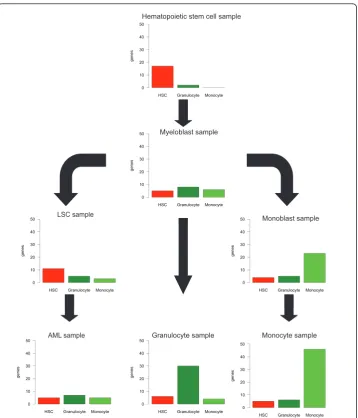
Application of the array alignment for the interpretation of transcriptome data from test samples III: hematopoietic cell types and myeloid leukemias
Data from seven cell types of the myeloid lineage: hematopoietic stem cells (HSC), myeloblasts, leukemic stem cells (LSC), acute myeloid leukemia (AML), granulocytes, monoblasts and monocytes were compared against the 44 tissue types of the reference data types. Figure 6 indicates the number of genes expressed in the test samples in a cell-type specific manner (ts-score >0.75) when compared against three specific sample types in the reference database (hematopoietic stem cells, granulocytes and mono-cytes). As expected, data from the hematopoietic stem cells were aligned most closely with HSCs in the reference database. Myeloblasts had roughly the same small number of cell-type specific genes corresponding to each of the three reference cell types. Monoblasts most closely resembled monocytes, but lacked specific genes expressed in the monocytic samples. Leukemic stem cells resembled HSCs the most, but with less HSC specific genes than the sample from the HSCs. The AML sample was further from the HSCs than LSCs, with some equally small similarity with both granulocytes and monocytes. Taken together, these data highlight the transcriptomic programs ran-ging from hematopoietic stem cells to mature myeloid cells.
0 200 400 600 800
1000 HAPLN1 ENSG00000145681
0 500 1000 1500 2000 2500 3000
3500 STC2 ENSG00000113739
0 200 400 600 800
1000 JUB ENSG00000129474
Blood lymphoid cell (96)Blood myeloid cell (32)
Blood unspecified leukocyte (28)
Bone marrow lymphoid cell (2)Bone marrow myeloid cell (10)
Bone marrow (8)
Hematopoietic stem cell (26)Circulating reticulocyte (30)
Whole blood (41)
Lymphatic system (96)
Muscle (73)Tongue (11)
Heart (49)
Blood vessel (8)
Bone (2)
Musculoskeletal system (0)
Adipose tissue (16)
Skin (3)
Hair follicle (16)
Central nervous system (425)
Peripheral nervous system (20)
Nervous system (0)
Eye (4)Gum (2)
Salivary gland (9)
Respiratory system (123)
Mesothelium (4)Colorectal (23)
Other GI system (33)
Liver (15)
Liver and biliary system (9)
Pancreas (17)
Endocrine system (52)
Kidney (59)Bladder (20)Testis (22)
Prostate (147)
Breast (15)Ovary (10)Uterus (30)
Placenta (48)
Cervix (4)
Other urogenital system (11)
Embryonic stem cell (0)
Mesenchymal stem cell (10)
Adult stem cell (10)
Sample A 0hSample B 0hSample C 0hSample A 7dSample B 7dSample C 7d
0 500 1000 1500 2000 2500
3000 DKK1 ENSG00000107984
0 1000 2000 3000 4000
ADIPOQ ENSG00000181092
0 1000 2000 3000 4000
PLIN ENSG00000166819
0 500 1000 1500 2000 2500
3000 THRSP ENSG00000151365
Blood lymphoid cell (86)Blood myeloid cell (32) Blood unspecified leukocyte (28)Bone marrow lymphoid cell (2)
Bone marrow myeloid cell (10)
Bone marrow (8)
Hematopoietic stem cell (26)Circulating reticulocyte (30)
Whole blood (41)
Lymphatic system (90)
Muscle (48)Tongue (11)Heart (32)
Blood vessel (8)
Bone (0)
Musculoskeletal system (0)
Adipose tissue (16)
Skin (3)
Hair follicle (16)
Central nervous system (290)
Peripheral nervous system (18)
Nervous system (0)
Eye (4)Gum (2)
Salivary gland (7)
Respiratory system (102)
Mesothelium (4)Colorectal (23)
Other GI system (33)
Liver (13)
Liver and biliary system (7)
Pancreas (14)
Endocrine system (33)
Kidney (50)Bladder (10)Testis (20)Prostate (12) Breast (8)Ovary (5)
Uterus (28)
Placenta (41)
Cervix (4)
Other urogenital system (11)
Embryonic stem cell (0)
Mesenchymal stem cell (10)
Adult stem cell (10)
Sample A 0hSample B 0hSample C 0hSample A 7dSample B 7dSample C 7d
0 500 1000
1500 MOSC1 ENSG00000186205
Figure 5Visualization of mesenchymal stem cell specific genes expression at time point 0 h (left
column) and adipose tissue -specific genes at 7d time point (right column). Each boxplot shows the
expression level of the corresponding gene in the reference data (from http://www.genesapiens.org) with
the data from external samples (A, B and C) shown at the far right in the two time-points.HAPLN1,STC2,
JUBandDKK1have mesenchymal stem cell specific expression levels at the 0 h time point, whileADIPOQ,
Discussion
A large number of methods have been developed for the analysis of microarray gene expression data, reflecting the tremendous complexity of the problem of transforming information on the expression levels of 20,000 genes into meaningful biological insights. Many microarray data analysis approaches are based on case-control study designs like comparing treated and untreated cells or matched disease and control
Monocyte sample Hematopoietic stem cell sample
Monoblast sample
AML sample Granulocyte sample Myeloblast sample
LSC sample LSC sample
HSC Granulocyte Monocyte
genes
0 10 20 30 40 50
Hematopoietic stem cell sample
HSC Granulocyte Monocyte
genes
0 10 20 30 40 50
AML sample
HSC Granulocyte Monocyte
genes
0 10 20 30 40 50
Myeloblast sample
HSC Granulocyte Monocyte
genes
0 10 20 30 40 50
Monoblast sample
HSC Granulocyte Monocyte
genes
0 10 20 30 40 50
Granulocyte sample
HSC Granulocyte Monocyte
genes
0 10 20 30 40
50 Monocyte sample
HSC Granulocyte Monocyte
genes
0 10 20 30 40 50
Figure 6Comparison of gene expression similarities based on AGEP analysis of seven samples
representing various differentiation and/or malignancy states of myeloid cells (hematopoietic stem
cells, leukemic stem cells, myeloblasts, monoblasts, AML, granulocytes and monocytes). For each
tissues. However, the control group may be hard to define and challenging to acquire. In some cases, like with differentiating stem cells, multiple control groups would be needed in order to achieve a comprehensive understanding of the differentiation path-ways. The method presented in this paper, AGEP, allows highly informative compari-son of a single microarray sample against an existing reference database of annotated, previously analyzed microarray data.
The philosophy of AGEP is analogous to the sequence alignment methods in the analysis and comparison of newly sequenced DNA. These methods are highly powerful because of the availability of fully sequenced genomes and 108 million sequence records as a reference in the Genbank. The key difference between sequence-based and gene expression based methods is that the latter provides quantitative information, not just qualitative sequence identities. Therefore, we had to take into account distri-butions of gene expression levels in each reference tissue that are often multi-modal in nature. In the AGEP method, this was accomplished by calculating kernel density esti-mates for each gene in each reference tissue type, thereby generating reference data for characteristic expression profiles of all genes in all the major normal tissue types.
We feel that a simple categorization of gene expression into two or three categories (like underexpression, average and overexpression) is insufficient to capture the true behavior of genes. The way AGEP works is that we assume that the whole spectrum of
expression values for a gene in a tissue reflects the true variationin vivo. Therefore,
when we compare the expression value from an external sample to a reference data-base, we determine quantitatively how well that value fits the distribution in each refer-ence tissue, instead of simply asking whether the gene is up- or down regulated in a direct comparison with a reference tissues, as these types of analyses are usually done.
One of the key features of the AGEP method is the tm-score. We believe that it is the best way to compare a single expression value to a host of values from any refer-ence sample group, such as a single tissue. Unlike a single summary value (like mean or median), it is able to account for any type of expression distribution, and takes into account the observed expression range of the gene in question. It can also accommo-date missing values, which is not the case for many other methods. It is also relatively robust against annotation errors as mixing two tissue types together will create a bimo-dal expression profile for at least some of genes and AGEP can accept that as a feature of the (mixed) tissue class whereas methods based single summary statistic would gen-erate values that are not correct for either tissue types of the mix.
AGEP performance in finding correct tissue of origin for a set of samples was bench-marked by using both nearest-neighbor and SVM, the latter being one of the most powerful classifying engines available [27-29]. As AGEP reached at least similar perfor-mance levels as SVM, we do not anticipate that comparison to other methods would
change the conclusion that AGEP’s absolute accuracy in tissue identification is
com-parable to other key methods and adequate for most purposes.
AGEP demonstrates that the tm-score is a good basis for comparing similarity of a sin-gle gene expression value to a reference pool.
Importantly, AGEP not only provides a metric of the sample similarities, but also defines the genes informative in comparison to all the reference tissues. This is impor-tant in order to understand the biological basis of the transcriptomic similarities. That
is, rather than just asking the question“What tissues does this gene expression profile
resemble?”, AGEP can also answer questions like“which genes contribute to the
simi-larity to a certain tissue?” or“what biological processes are different in the test sample
as compared to the various tissues?”, as evidenced by the presented case studies.
Previous methods for similar comparisons are typically based on an upfront selection of subsets of genes (gene sets or signatures) that are derived from the test samples and reference sets. Examples of conceptually similar approaches include the connectivity map [44,45], molecular concept mapping [46], and the relevancy metric [23], which all provide the capability to link new experiments to existing ones. Selected gene sets are most informative and powerful for the purpose they were designed for and depend entirely on the identification and annotation of meaningful gene sets that may or may not be available for a particular study. Also, gene sets may not transfer well from one context to another, e.g. from one tissue to another. Other informative gene expression patterns may be missed when focusing on gene sets or molecular concepts. AGEP
does not depend on a prioriassumptions of subsets of genes being more informative
than others and it was designed to be used for the analysis of individual samples. The AGEP method is widely applicable, but is particularly powerful when a deep interpretation of microarray results is needed for samples for which an optimal control tissue is not available due to technical, medical or biological considerations, such as cell differentiation and stem cell research, where comparisons with multiple different cell and tissue types are needed.
When selecting the reference data, we omitted any tissue with less than six samples. Obviously, human normal tissue specimens are hard to obtain in large quantities. Therefore, five is less than optimal as a statistical lower limit, as individual samples have a huge impact on the shape of the kernel density with so few samples. As more data become available, we would suggest raising the low limit to at least 20 samples, so that each reference sample type would have the representation of the spectrum of likely expression levels.
The computational requirements for AGEP are rather heavy, as the representation of the expression distributions as density estimates requires considerable amounts of memory. With the current implementation AGEP needs be run in a server with more than 10 GB of memory, however this is largely dependent on the size of the reference database used.
Conclusions
Alignment of samples from Duchenne muscular dystrophy (DMD) patients revealed known critical and causative expression changes in the transcriptome of dystrophic muscle. For example, the well-known role of inflammation in dystrophy was clearly
flagged by the AGEP analysis [33]. Known dystrophy related genes like MYH3, MYH7,
MYH8 andDMD[32,33,36] and genes previously unlinked to the dystrophic muscle,
muscle not matching healthy muscle. Interestingly, CLTCL1, a gene related to glucose metabolism, was expressed at levels matching those in normal muscle tissue in 6 dys-trophy patients while 4 had clearly lower expression illustrating how AGEP can pro-vide interpretation of molecular profiles of individual patients, and reveal pathogenetic genes and pathways in a context-specific manner. Furthermore, as more annotated reference data becomes available, this will facilitate molecular stratification of patients suggesting many possible future applications in diagnostic molecular pathology.
In the examples on cell differentiation, the AGEP method facilitated understanding of the changes in the transcriptomic programs of stem cell differentiation to adipose
tissue. Most MSC-specific genes (e.g. HPLN1,STC2,JUBand DKK1) lost their specific
expression levels and acquired levels typical for adipocyte while adipocyte-specific
genes (e.g. ADIPOQ,PLIN,THRSPand MOSC1) gained expression typical for
adipo-cytes during the differentiation. Illustrating the key advantage of AGEP method in con-text-specific comparisons, we were able to identify that during the stem cell differentiation cells also gained similarity with cardiomyocytes. This differentiation pat-tern is well known [39], but the extent to which this takes place during adipocytic dif-ferentiation has not been comprehensively characterized before. AGEP also helped to unravel genes with unique expression levels in cell types of the myeloid differentiation cascade. These analyses quantified the cellular differentiation states (and genes involved) that could in the future be applied for developing diagnostic applications in mapping differentiation states of normal and pathological hematopoietic lineages or any other cellular differentiation cascade. In conclusion, our biological validation experiments showed that AGEP is capable of identifying gene-by-gene contributions to the similarity between query sample and reference database.
Even though tissue classification was not the primary aim of the study, the AGEP method achieved high accuracy in identifying the tissue type of origin of test samples and the biological processes and genes behind such similarities, thus facilitating under-standing of biological concepts hidden in the complex transcriptomic profiles. Future implementation of this line of research could lead to diagnostic approaches for analysis of unknown primary tumors.
Taken together, the AGEP methodology provides a new paradigm for comprehensive analysis of gene expression profiles from individual samples, making efficient use of existing knowledge and collective data acquired by the research community. This AGEP concept is similar to the widely applied sequence alignment tools, where a new test sequence is compared against a large reference collection of known genomes and sequence repositories. We therefore believe that the AGEP approach will incrementally gain in value in the future, as the databases, annotations and statistical, bioinformatic, data mining and artifical intelligence methods for learning based on prior information continue to improve.
Methods
Reference data
As a reference data we have used 1667 healthy in vivosamples from GeneSapiens
Transforming the expression profile of query sample into compatible form
Gene expression data from the query sample to be analyzed against the reference data is transformed into compatible form by following procedure. MAS5 preprocessing algorithm and subsequent EQ transformation is applied as specified in Kilpinen et al. [7]. AGC correction method [7,21] is then applied for the sample. Gene and array gen-eration specific correction factors needed in the AGC correction are fetched from the reference database [7].
Calculation of gene expression density estimates
The density of expression values for each gene in each tissue type was calculated (Additional file 2A-B) as follows: For computational efficiency we used fast Fourier transformation based approximation to calculate kernel density estimates (R 2.7.2 [47]). Kernel densities were calculated by using Gaussian window with bandwidth selection given by Scott et al. [48] (R function bw.nrd). Density is estimated from 0 to maximum expression value in the entire dataset plus two times the highest bandwidth for that gene, with 512 equally spaced points.
The modality of gene expression estimates was calculated by searching for peaks hav-ing at least 0.1 of the total area of the density estimate. 14% of the genes were excluded from the analysis primarily due to the ambiguous modality of expression distributions.
Comparing a single query profile to the reference data
Gene and tissue specific expression density estimates (Additional file 1) are used to calculate the likelihood of obtaining the expression values observed in the query profile
from each tissue type for genegin tissuetas follows:
The value of the density diagram for genegin tissuetcorresponding to the
expres-sion value of gene gin the query sample is determined. Then that density value is
compared to the density values of the 512 evaluation points of the density diagram of
geneg in tissuetand the fraction of lower density values is calculated. This is called
the tissue match score (tm-score), with 1 meaning perfect match between the query
and tissue for expression of gene gand 0 meaning expression of the gene in the query
profile is outside the observed expression range of gene gin tissue t. This calculation
is repeated for each gene of the query profile against the density estimates of the same genes in each tissue type of the reference data. The calculations are detailed in Equa-tion 1. Based on the tm-scores the expression values of genes of query samples are also classified typical or atypical for each of the reference tissues. This is done by determining the tm-scores for all evaluation points, and weighting the abundance of that tm-score by the value of the density diagram at that point. This is repeated for all genes in all tissues. It essentially leads significance value of the tm-scores (less than 5% likelyhood of having at least equal tm-score by chance when comparing samples of the tissue against itself).
For the purpose of defining the similarity of the query sample at the level of tissues we calculate a tissue specificity score (ts-score) for each gene in each tissue (Equation
2). The ts-score for gene gfor tissue tis the mean of the ratio weighted differences of
tms(g, t) and all tms(g, nott). This gives us a score that indicates how well the
larger the ratio of the tm-scores, the higher the resulting ts-score will be. For example, a tm-score of 0.6 is deemed to better differentiate from a tm-score of 0.2 than a score of 1 from 0.6, even though their differences are the same. The scaling is controlled by
the scaling factor (□), which was set to 0.25 for the analyses in this paper. It produces
scores of 1/2 to 5/6 with a difference of 0.5. Setting □closer to 0 gives more weight to
the ratio, whereas a larger value decreases it. See Equation 2 for details. Ts-score varies
between 1 and -1 and describes how well gene gclassifies the query profile into tissue
t. A score of 1 means the gene has a unique level of expression in the tissue and the query profile has expression level matching it perfectly. 0 means that the expression level observed in the query sample cannot differentiate the tissue from other tissues. -1 means gene has a unique level of expression for the tissue and the query profile does not have that specific expression level.
The mean of tissue specificity scores (Equation 3) is used as similarity score at the tissue level.
Equation 1
The distribution of random, tissue vs. self tm - scores is defined as:
E={evaluation points for genegin tissuet} ei=i:th evaluation point
for eachi(1 .. |E|) tm - score =tms(eix,t)
with weight = eiy
1 |E|
i=1
eiy
Where
tms(t,g) = tm - score for tissuet, geneg
Equation 2
The tissue specificity score for tissuetand genegis:
tss(t,g) = 1
|T| |T|
i=1
f(t,xi,g)
Where
T={non−ttissues} xi=i:th element ofT and
f(t,x,g) ={
1−(1+σ)(tms(x,g) +σ
tms(t,g) +σ−
σ
1 +σ),fortms(t,g)tms(x,g)
−(1−(1+σ)(tms(t,g) +σ
tms(x,g) +σ−
σ
1 +σ)), fortms(t,g) ¡tms(x,g)
σ= scaling variable
Equation 3
The similarity score for samplesand tissuetis:
similarity(s,t) = 1
|G| n
i=1
tss(t,gi)
Where
G={common genes betweensandt}
gi=i:th element ofG
An R implementation of the AGEP algorithm is available at https://github.com/ skilpinen/AGEP
Leave-one-out cross-validation (LOOCV)
In order to validate the accuracy of the method we performed leave-one-out cross-vali-dation using 1667 healthy samples from the reference data. Density estimates for the tissue from which the query sample was removed were recalculated, and then the query sample was aligned to the tissues. From the results we calculated accuracy of identifying correct tissue type as first hit (Figure 1) and distribution of first and sec-ondary hits per each tissue (Additional file 5). The sensitivity and specificity for each
tissue were calculated (Additional file 4) as follows: for tissuettrue negatives (tn) were
non-ttissue samples that matched non-ttissues, false negatives (fn) were tissue t
sam-ples that matched a non-ttissue, true positives (tp) were tissuetsamples that matched
t and false positives (fp) were non-t tissue samples that matchedt. Sensitivity was
defined astp/(tp+fn) and specificity astn/(tn+fp).
In nearest-neighbor classification method the average expression of each gene in each tissue was calculated to form tissue average profiles. Samples were classified as the tissue having smallest Euclidean distance to the sample in question. A separate classification was made by classifying samples to the tissue with the highest Pearson correlation coefficient. In all cases, the sample in question was excluded from the cal-culation of average profiles.
With SVM we used libsvm package through R library e1071, with radial kernel. Since SVM cannot effectively handle missing values we imputed missing values to the data by using median value of data points in the tissues for the gene in question. Imputa-tion was done for each tissue separately so that each missing value was replaced by median non-missing values. If all samples of a tissue had missing value then the gene was discarded from the analysis. This resulted in 11834 genes with no missing values for each of the 1667 samples. Imputing missing values for SVM lowers variation within the tissue and thus to some degree artificially enhances the performance of SVM, which was tested with 10-fold cross validation of the entire database.
Independent validation with external dataset
External healthyin vivo samples used in additional independent validation were
ran-domly selected from Array Express [1] study E-GEOD-7307. 250 healthyin vivo
sam-ples were selected, and of these, 195 samsam-ples were from tissues that were also present in the reference data, and were thus used for the validation.
Datasets used in testing individual samples
Hematopoietic stem cell sample and leukemic stem cell sample were acquired from Array Express [1] study E-GEOD-17054 (GSM426413.CEL and GSM426407.CEL, respectively) [49], AML and bone marrow granulocyte samples were from GEO [3] study GSE1159 [50] (GSM20692.CEL and GSM20971.CEL, respectively), Blood mono-cyte sample was from GEO study GSE1133 [18] (3AMH02082315_PB_CD14Mono-cytes.CEL). Both the granulocyte and monocyte samples were originally part of the reference database [7] but were excluded from the density calculations to be used as external samples. Myeloblast and monoblast samples were from Array Express [1] study 12803 [51] (12803-raw-cel-1712284859.cel and E-GEOD-12803-raw-cel-1712284746.cel, respectively).
Duchenne muscular dystrophy samples were from Array Express [1] study E-GEOD-3307 [34].
Mesenchymal stem cell differentiation series was from Array Express [1] study E-MEXP-858. Within the study human mesenchymal stem cells, derived from bone marrow aspirations of iliac crest of healthy transplantation donors, were induced to differentiate into adipocytes with specific induction cocktail (described in detail in experiment description file E-MEXP-858.idf.txt available through Array Express).
Gene set enrichment analysis
In order to define the similarity of the query sample and the tissues at the level of biological functions tissue match scores were analyzed in terms of a priori known gene sets. For each gene set the relative enrichment of the members of gene set among the atypical, for the tissue in question, part of the transcriptome was calcu-lated. Gene sets were derived from molecular signatures database [52,53] and Panther database [54].
Boxplots
In boxplots there is one box for each tissue of reference data. Lines signify median expression; boxes extend to 25 and 75 percentiles while whiskers extend to the 1.5*IQR. Data points beyond are shown as individual points. Number of data points for each tissue is shown in the parenthesis. Expression level of the gene in individual samples is shown only as line after data of the reference database.
Tissue tree
The phylogenic tree for the tissues in the reference database was calculated as follows: the density estimates for a gene in one tissue was compared to the density estimate for the same gene in another tissue. The area of the non-overlapping part was calculated. This was done for all genes that had density estimates in both tissues. The distance between two tissues was set as the median of the non-overlapping areas of all their common genes. The tree was calculated using the hclust() R function with the linkage