Effect of Preparative Parameters on Structural, Optical and Electrical
Properties of Mn2O3 Nano Particles Prepared Via Microwave Assisted
Technique
L. Jayaselvan1*, C. Gnana Sambandam1, C. Ravidhas2, A. Moses Ezhil Raj3
1Physics Research Centre, S.T. Hindu College, Nagercoil,Tamilnadu, India
2Postgraduate and Research Department of Physics, Bishop Heber College (Autonomous), Tiruchirapalli,
Tamilnadu, India
3 Department of Physics & Research Centre, Scott Christian College (Autonomous) Nagercoil, Tamilnadu,
India
*Corresponding authore-mail:[email protected]
Abstract
In the present investigation Mn2O3 nanoparticles were
prepared by microwave assisted co-precipitation method
using MnCl2 and NaOH precursors. Obtained
nanoparticles were characterized using X-ray powder diffraction (XRD) for the confirmation of Mn2O3
formation with cubic structure. Nelson – Riley and William – Hall plots were constructed to estimate the lattice parameter, crystalline size and microstrain precisely. Variations in Structural parameters with preparative conditions was discussed and analyzed. Metal-oxide phase formation was confirmed from the bands in the specified finger print region of FTIR spectra of metal oxides. Scanning electron microscopy (SEM) micrographs revealed the reducing agent dependent morphology of particles, size and its distribution. Optical absorption measurements were used to obtain the band gap by nothing the absorption edge in the lower wavelength region and its dependence to preparative parameters was identified. Electrical conductivity and its variations with temperatures were used to evaluate the activation energy and temperature co-efficient of resistance.
Keywords: Microwave synthesis, Mn2O3, XRD, FTIR,
optical and electrical
1. Introduction
Metal oxide nanostructures are an important class of nanomaterials with unique properties and useful functionalities that are attractive for a variety of applications ranging from electronics to biomedicine and energy conversion [1,2]. Among the transition metal oxides, manganese exhibits many oxidation states and thereforeforms different oxides (MnO, Mn2O3, Mn3O4, Mn5O8 and MnO2). Manganese oxide
materials are of considerable importance due to their wide-spread applications in catalysis, ion-exchange, and rechargeable batteries. Among the oxide of manganese, Mn2O3 has vital application in various
fields.
Until now, numerous processes have been developed for the synthesis of inorganic nanostructures, in that, chemical routes have proved to be more effective and versatile [3]. A wide variety of morphological forms of manganese sesquioxide (Mn2O3), ranging from one- to
crystallographic structures are obtained by various researchers. Recently -Mn2O3 nanoparticles was prepared
through sol-gel method using manganese acetate tetrahydrate and oxalic acid as a precursor and ethanol as a solvent. [9,10] Manganese sesquioxide exhibiting different morphologies were prefund by giving nanostructure using heat treatment of manganese alkoxide precursor, which was synthesized from the reaction of manganese acetate with ethylene glycol [11]. Various manganese sesquioxide hollow nanostructures were prepared by oxidation of manganese carbonate using potassium permanganate as oxidizer. Tsang et al. [12] investigated the reduction of potassium permanganate by the use of potassium borohydride in aqueous solutions to obtain binary and ternary manganese oxides. Synthesis of various manganese oxides via thermal decomposition of manganese oxalate obtained using manganese acetate as precursor and ethyl trimethyl ammonium bromide (CTAB) as surfactant have been reported [13]. Hydrothermal cleavage-decomposition mechanism which was used to synthesize a single-crystal α-Mn2O3
nanorod at 1600C for 16 h using potassium permanganate
and ethyl trimethyl ammonium bromide as reducing reagent, was also been reported [14].
In the present study α-Mn2O3 nanoparticles have
been prepared by sol-gel method using MnCl2 and
sodium hydroxide. Amount of reducing agent was changed to vary the morphology of the prepared α- Mn2O3 nanoparticles and its consequences over the
structural, optical and electrical properties are reported in this manuscript.
2. Experimental
Mn2O3 nano powder were prepared from the
aqueous solution of MnCl2 at a concentration of 1M
and the concentration of the reducing agent was varied (0.25, 0.5, 0.75 and 1.0M). In a typical synthesis process, 19.78 grams of MnCl2 was added to 100 ml of
distilled water in a round bottom flask and then the required amount of NaOH pellets were slowly added in to the above solution. Resulted solution was kept under constant stirring for an hour to from a brown color solution. The solution thus obtained was heated in a domestic microwave oven (540 W, 920 C) for 20
minutes. After microwave processing, the mixture was cooled to room temperature and the resulted brown precipitate was separated by centrifugation followed by repeated washing with distilled water and absolute ethanol to remove the impurities and residual materials. After washing, the nano particles were dried at 600 C for 2 hrs for removing hydrated species.
Finally, the prepared materials were heated at 5000 C
for three hours. The same procedure is repeated for the all the Mn2O3 nano particles prepared using NaOH
solution of various concentrations. In order to differentiate the obtained products, the samples were named MnO-1, MnO-2, MnO-3, and MnO-4 respectively for the sample prepared using NaOH solutions of various concentrations, 0.25,0.50,0.75 and 1M respectively.
Prepared samples were characterized using various instruments. XRD patterns were recorded in Bruker AXS D8 Advanced diffractometer with Cu Kα radiation (λ=1.5406Å) and the voltage and current was maintained at 40 KV and 30 mA, respectively. FT-IR spectra were recorded in the range of 400-4000 cm-1
on a Thermo Nicolet, Avatar 370 using KBR pellet technique. Morphology of Mn2O3 nano particles were
3. Result and Discussion
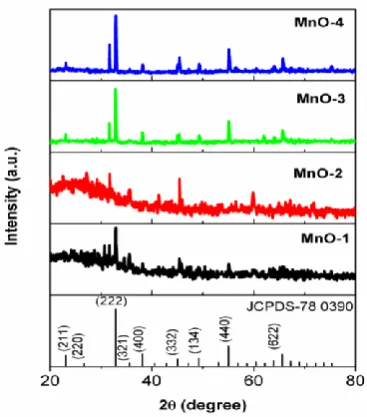
Figure 1.X-ray diffraction pattern of α-Mn2O3 samples
prepared using NaOH solutions of different concentration (0.25, 0.50, 0.75 and 1.0M)
The phase and purity of the prepared Mn2O3 nano
particles were verified by X-ray diffraction measurements (Figure1). XRD analysis confirmed that the obtained nanoparticles are in α-Mn2O3 polymorph
with cubic structure [space group: Ia-3 (206)]. No impurity peaks are found in the XRD pattern. The obtained peak positions are comparable to the standard JCPDS value (JCPDS No. 78- 0390), and are in perfect match with the standard peaks. The lattice parameter of the prepared samples was estimated from the known (hkl) values and d-spacing. Estimated average crystallite sizesare below 100nm. The unit cell volume, density and micro strain are also estimated. Nelson – Riley
function f(θ) = 1/2 cos2θ cos2θ+ sinθ θ
has
been plotted against the lattice parameter to estimate exact value of unit cell edges.
Figure2 shows the constructed Nelson-Riely plot of the Mn2O3 nano particles. Obtained straight lines are
extrapolated and the intercept point gives the true
value of the lattice parameter. Estimated structural parameter values from the XRD and N-R plot are listed in Table 1.
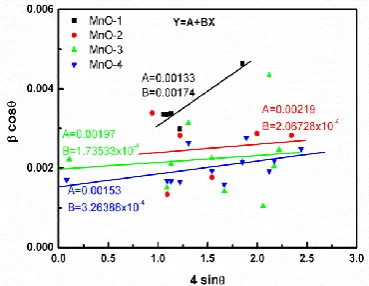
Williamson-Hall plot has been constructed to evaluate the crystallite size and microstrain of the prepared Mn2O3 nanoparticles (Fig.3). From the
intercept and the slope of the extrapolated line, the crystalline size and microstrains are estimated. Since W-H plot includes both line broadening caused due to instrumental error, crystallite size and strain, obtained values of crystallite size and microstrain are error free. Calculated crystallite size and microstrain are listed in Table 1.
Figure 2. Nelson-Riley plots of α-Mn2O3 samples
Figure 3. Williamson - Hall plots of α- Mn2O3 samples
Table 1. Structural parameters of α-Mn2O3 samples
Sample Details
Lattice Parameter (Å) Volume (Å)3 Density (g/cm3) Crystalline
Size (nm) Strain x 10-3
Exp. N-R Plot Std. Exp. Std. Exp. Std. XRD W-H plot Cal. W-H plot
MnO-1 MnO-2 MnO-3 MnO-4
9.4057 9.4455 9.4298 9.4040
9.3589 9.5430 9.4040 9.5295
9.3589 9.5430 9.4040 9.5295
832.16 842.81 835.04 836.80
838.56 838.56 838.56 838.56
5.0374 4.9737 5.0200 5.0090
5.0374 4.9737 5.0200 5.0090
39.5 63.5 66.9 73.7
108.8 66.13 73.51 94.65
0.8839 0.6269 0.5645 0.5085
1.74 0.2067 0.1735 0.3263
Figure 4 shows the Fourier Transform IR spectra of the prepared α-Mn2O3 samples
Figure 4. FTIR spectra of α-Mn2O3 samples prepared
using NaOH solutions of different concentrations
The appearance of two strong bands at ~690, and ~ 570 cm-1 in MnO-1 and MnO-2 samples are the clear
evidence for the presence of the crystalline Mn2O3.
However these two bands appear as single broad band.
On deconvolution, the band centered at 690 cm-1 is
ascribed to the longitudinal-optical (LO) mode and the one at 570 cm-1 is due to the transverse-optical (TO)
mode of α-Mn2O3. On increasing the concentration of
the reducing agent (MnO-3 and MnO-4) three separate bands are distinctly visible at ~ 410, ~ 508 and ~ 598 cm-1. The peak positioned at 410 cm-1 is assigned
to the bending vibrations of Mn–O–Mn bonding. The 510 cm-1 peak is assigned to the symmetric stretching
vibration mode in Mn–O-Mn bond. Peak at 598 cm-1 is
due to the asymmetric Mn–O–Mn stretching vibrations. Moreover, it is observed that all of the associated peaks are red-shifted with decreasing particle size, which might be due to the different local stresses. With decreasing grain size of Mn2O3 nanocrystals, many
defects and morphological changes are expected at the surface and interface of Mn2O3 nanocrystals, cause
differences are observed and these changes are attributed to the microstructural evolution, which results surface disorder due to morphological changes in the Nanomaterials on changing the preparative conditions. Since the surface of nanoparticles is very reactive, exposure to humid moisture environment, water molecules are co-ordinated at the surface. Hence, the band appearing at ~3410 cm-1 reveals the
presence of OH stretching vibration in H2O. The
presence of the absorption band centered at ~ 1625 cm-1 may be due to the bending vibration of OH in
H2O [16]. Thus FTIR study also confirms the
formation of α- Mn2O3 as that of the results of XRD.
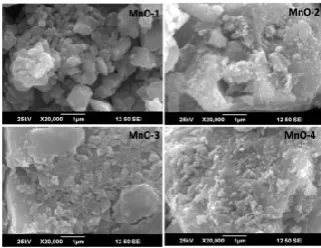
Figure 5. SEM micrographs of Mn2O3 Samples
Scanning electron microscope facilitates an understanding of the microstructure of the surface of the nano particles. Figure5 shows the recorded SEM images of α-Mn2O3 samples for the magnification of ×
20000. It is obvious that the size and morphology of powers mainly depend on the preparation conditions [17]. A detailed examination of SEM micrograph from a selected region of Mn2O3 samples, observed clusters
are non spherical but some particles are rectangular and irregularly shaped. Randomly 10 clusters are chosen from the image for the calculation of size of the agglomerated particles. The average value of the agglomerated particle size is found to be 0.9366 µm (~936nm). The size distribution and shape of the particles are not uniform. On increasing the concentration of the reducing agent, the cluster size reduces, but the size of the cluster is in μm range.
Since the resolution of SEM is very limited, size estimation of single particle is not possible. There seems a mismatch in average size of the grains determined through Scherrers calculation using the XRD data and SEM analysis. XRD usually provides the crystallite size of the particles, where as SEM provides the size of the surface clusters alone.
The optical absorption spectra of the prepared α-Mn2O3 samples are shown in Fig 6.
Figure 6. Optical absorption spectra of α-Mn2O3
samples prepared using NaOH solutions of different concentrations
It can be seen that, the strong absorptions of sample appears in the band range from 430 to 250 nm. Hence, the optical band gap for the absorption peak can be obtained by extrapolating the linear portion of the (αhν)2 – hν curve. The optical band gap values of the
samples prepared for different preparative conditions are respectively, 5.490, 5.483, 5.332 and 5.37eV. Blue shift shows low dimension of α-Mn2O3 nanoparticles
and due to their property variations.
Figure 7 shows the reflectance spectra of the prepared Mn2O3 nano particles using different
Figure 7. Optical reflectance spectra of α-Mn2O3
samples prepared using NaOH solutions of different concentrations
Reflectivity variations clearly show the inverse trend of the absorption curve. Since reflectivity is more in the IR region, it can be used as reflective coatings to eliminate IR radiations.
The electrical conductivity of the samples are measured by preparing pellets of known dimension. For that, initially the Mn2O3 powders were mixed with
polyvinyl alcohol which was used as a binder and then pressed in to pellets of known dimension. Pellets were then heated at 1500C for 1 hour to remove the binder.
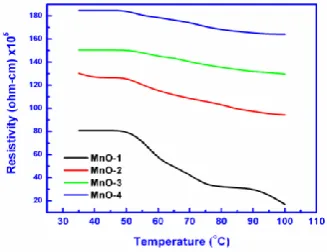
Using the two probe set-up, electrical measurements were carried out in the temperature range RT to 100 ºC. Figure8 shows the electrical resistivity variations with respect to temperature in all the α-Mn2O3
samples.
Figure 8. Resistivity variation with temperature in α-Mn2O3 samples prepared using NaOH solutions of
different concentrations
In all the samples the resistivity values decreases with temperature, which shows the semiconducting behavior of the α-Mn2O3 samples. As observed,
MnO-1 samples is having lower resistivity of about 80×MnO-105 Ω
cm at RT and it decrease to 10×105Ωcm on increasing
the temperature to 1000C. For the other three samples
MnO-2, MnO-3, MnO-4, the same trend prevails, however the room temperature resistivity gradually rises as the concentration of reducing agent is increased. In these samples, gradual improvement in crystallinity is observed, so the resistivity of the prepared powder sample increases.
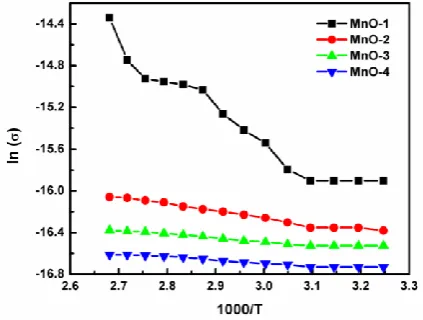
The conductivity variations in the prepared samples are useful in finding the activation energy, temperature co-efficient of resistance etc. Fig 9 shows the conductivity variation with temperature
Figure 9. Conductivity variations with temperature in α-Mn2O3 samples
The conductivity variation is prominent inMnO-1 samples. However, the conductivity variation in the other samples MnO-2, MnO-3 and MnO-4 are very small. Since the MnO-1 sample is almost amorphous, there may be more defect sites that make them to conduct heavily. The other samples MnO-2, MnO-3, and MnO-4 exhibit less conductivity variations with temperature.
charge transport. On measuring the variation of (σ) with temperature, Activation energy “Ea”can be
determined from the slope of the straight line obtained by plotting 1000\T against ln(σ) as shown in Figure 10.
Figure 10. Arrhenius plots to estimate activation energy of α-Mn2O3 samples
Slope of the Arrhenius plot directly gives the activation energy of the Mn2O3 samples. Temperature
co-efficient of resistance (TCR) can be measured from the noted conductivity values at two specific temperatures. Obtained activation energy and the TCR values are listed in Table 2.
Table 2. Electrical data of Mn2O3 samples
Samples details Ea(eV) TCR (K-1)
MnO-1 MnO-2 MnO-3 MnO-4
0.6207 0.1168 0.0640 0.0960
-0.0176 -0.0056 -0.0022 -0.0021
The activation energy gradually decreases on increasing the proportion of the reducing agent during preparations. The negative value of TCR indicates the presence of semiconducting behavior in Mn2O3
nanoparticles [18].
4. Conclusion
α-Mn2O3 nanoparticles have been successfully
synthesized using the simple microwave assisted sol-gel method by varying the concentration of the reducing agent NaOH. Property variations were systematically interpreted for the samples prepared for different conditions. XRD analysis confirmed the α-Mn2O3 polymorph with a cubic structure. The
Nelson-Riley and Williamson - Hall plots were constructed to estimate the lattice constant, crystallite plot and microstrain precisely FTIR spectral investigations confirmed the metal-oxide phase formation in the prepared manganese oxide nanoparticles. The surface morphology and agglomerated clusters and their size
variations with preparative conditions were
investigated using SEM. The optical absorption studies revealed the presence of fundamental absorption edge in the lower wavelength side. The optical band gap of the samples and their variations (5.39-5.49 eV) are explained based on the preparative conditions. The electrical resistivity values and their variations with temperature was explained with the aid of the obtained activation energy and TCR values.
References
[1] Cavicchi, R.E., Silsbe, R.H., “Coulomb
Suppression of Tunneling Rate from Small Metal. Particles”, Physical review letters, 52, April 1984, pp. 1453-1456.
[2] Ball, p., Garwin, L., “Science at the atomic scale”, Nature, 355, 1992, 761–766.
[3] Rao, C.N.R., Vivekchand, S.R.C., Biswas, K.,
Govindaraj, A., “Synthesis of inorganic
nanomaterials”, Dalton Transactions, July 2007, pp. 3728–3749.
[4] Chen, Y., Zhang, Y., Qi-Zhi Yao, Gen-Tao Zhou, Fu, S., Fan, H., “Formation of α-Mn2O3 nanorods
cleavage-decomposition mechanism”, Journal of Solid State chemistry, 180, April 2007, pp. 1218-1223L.
[5] Wang, Z., Ebina, Y., Takada, K., Sasaki, T., “Ultrathin hollow nanoshells of manganese oxide” Chemical Communication., 8, 2004, pp. 1074–1075.
[6] Zhang, Z.L., Du, G.H, Ren, T.Z., Su, B.L., “A simple method to synthesise single-crystalline manganese oxide nanowires”, Chemical Physics Letters, 378, September 2003, pp. 349-353.
[7] Lei, S.J., Tang, K.B., Fang, Z., Liu, Q.C., Zheng, H.G., “Preparation of α-Mn2O3 and MnO from thermal
decomposition of MnCO3 and control of
morphology”, Materials Letters, 60, January 2006, pp. 53–56.
[8] Li, W.N., Zhang, L.C., Sithambaram, S., Yuan, J.K., Shen, X.F., Aindow, M., Suib, S.L., “Shape Evolution of Single-crystalline Mn2O3 Using a
Solvothermal Approach”, The Journal of Physical Chemistry C, 111, September 2007, pp.14694–14697.
[9] Subhash T., Bhagwati P., Jitendra K., “Formation and magnetic behaviour of manganese oxide
nanoparticles”, Materials Science and
Engineering: B, 167, March 2010, pp. 153-160
[10]L. Liu, Z. Yang, H. Liang, H. Yang, Y. Yang, “Facile synthesis of MnCO3 hollow dumbbells and
their conversion to manganese oxide”, Materials Letters, 64, October 2010, pp. 891–893.
[11]Cao, J., Zhu, Y., Bao, K., Shi, L., Liu, S., Qian, V., “Microscale Mn2O3 Hollow Structures: Sphere,
Cube, Ellipsoid, Dumbbell, and Their Phenol Adsorption Properties”, The Journal of Physical Chemistry C., 113, September 2009, pp. 17755– 17760.
[12]Tsang, C., Kim, J., Manthiram, A., “Synthesis of Manganese Oxides by Reduction of KMnO4 with
KBH4in Aqueous Solutions”, Journal of Solid State Chemistry, 137, April 1998, pp. 28–32.
[13]Ahmad, T., Ramanujachary, K.V., Lofland, S.E., Ganguli, A.K., “Nanorods of manganese oxalate: a single source precursor to different manganese oxide nanoparticles (MnO, Mn2O3, Mn3O4)”,
Journal of Materials Chemistry, 14, December 2004, pp. 3406–3410.
[14]Masoud Salavati-Niasari, Fatemeh Mohandes, Fatemeh Davar, Kamal Saberyan, “Fabrication of chain-like Mn2O3 nanostructures via thermal
decomposition of manganese phthalate coordination polymers”, Applied Surface Science., 256, December 2009, pp. 1476–1480.
[15]Sadtler Research Laboratories, INC, Inorganics IR Grating Spectra, Philadelphia, PA 19104, USA, 3– 5 (1972) Y1173K.
[16]Chen, Z.W., Lai, J.K.L., Shek, C.H., “Influence of grain size on the vibrational properties in Mn2O3
nanocrystals”, J. Non-Crystalline Solids, 352 September 2006, pp. 3285–3289.
[17]Siti Aida Ibrahim, Srimala Sreekantan,
Proceedings of ICXRI 2010, International Conference on X-Rays & Related Techniques in Research & Industry June 9 – 10, 2010, Aseania Resort Langkawi, Malaysia.