Spot Welding Parameter Optimization To Improve
Weld Characteristics For Dissimilar Metals
Aravinthan Arumugam, MohdAmizi Nor
Abstract: Resistance spot welding is a process which is widely used in the automotive industry to join steel parts of various thicknesses and types. The current practice in the automotive industry in determining the welding schedule, which will be used in the welding process, is based on welding table or experiences. This however may not be the optimum welding schedule that will give the best spot weld quality. This work concentrates on the parameter optimization when spot welding steels with dissimilar thickness and type using Grey Based Taguchi Method. The experimentation in this work used a L9 orthogonal array with three factors with each factor having three levels. The three factors used are welding current, weld time and electrode force. The three weld characteristics that were optimized are weld strength, weld nugget diameter and weld indentation. The analysis of variance (ANOVA) that was carried out showed that welding current gave the most significant contribution in the optimum welding schedule. The comparison test that was carried out to compare the current welding schedule and the optimum welding schedule showed distinct improvement in the increase of weld diameter and weld strengthas well as decrease in electrode indentation.
Index Terms: Diameter, indentation, parameter optimization, Taguchi Method, tensilestrength
————————————————————
1 INTRODUCTION
1.1 Introduction to Spot Welding
Resistance Spot Welding (RSW) is a joining process that is being widely used nowadays especially in the automotive industry. RSW is used to join metal sheets which form the automobile’s body structure or normally known as the body-in-white (BIW). RSW is applied in the automotive industry mainly due to its robustness, speed, flexibility and low cost operation. Typically there are about 4000 – 6000 spot welds in an automobile which bear the loads due to various types of loadings (static load, impact load and fatigue load) during the life span of an automobile. The three main RSW parameters which determine the load bearing capacity of a spot weld, which is referred to as the tensile shear strength in this work, is the welding current, welding time and electrode force. Variations in these parameters will cause variations in the tensile shear strength, weld nugget diameter as well as weld indentation. Increase in welding current has been found to increase the weld nugget diameter and in turn the weld tensile shear strength until the occurrence of expulsion [1]. Similarly the increase in welding time and decrease in electrode force have been found to increase the weld nugget growth and the tensile shear strength until the occurrence of expulsion [2]. Therefore suitable combination of these parameters, called the welding schedule, is required to achieve a spot weld with the desired weld characteristics (nugget diameter, tensile shear strength and indentation) [3].
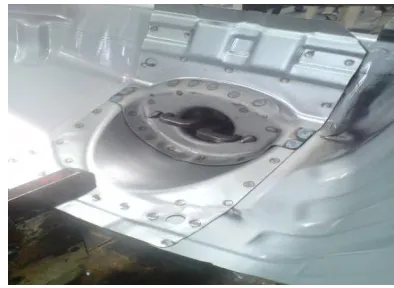
The automotive industry uses steel sheets of various thicknesses, coating and composition for various components of an automobile BIW. For example, panel spring housing assembly (Fig.1) is an automobile body component which is made of a combination of two dissimilar steel sheets with thicknesses of 2.0 mm and 0.8 mm. Therefore there will be various welding schedules developed to complete a full body structure of an automobile. In the current practice, the welding schedule for a certain combination of sheet thicknesses is based on experiences, handbook or welding table. However the selected welding schedule does not guarantee an optimum spot weld characteristics in the present working condition and environment. An optimum welding schedule needs to be identified to create joint which has the desired weld characteristics at the condition where the welds are being made.
Fig. 1 Panel spring housing assembly
1.2 Literature Review
Various authors have looked into the spot weld parameter optimization for various materials or processes. Thakur et.al [3],[4] has used Taguchi Method to determine the optimum welding schedule to spot weld galvanized steel and austenitic stainless steel AISI304 on two separate work. The author has investigated the effect of welding parameters on the tensile shear strength of the spot weld on both metals. Wuttipornpun [5] has determined an optimum welding condition to reduce welding spatter. The ____________________________
Aravinthan Arumugam is currently the Department
Head for Mechanical Engineering at KDU University College, Malaysia, PH-+603-79536809.
E-mail: [email protected]
MohdAmiziNoris currently the Manager for Autokeen
author has selected four independent variable namely electrical supply, thickness of material, welding angle and welding position and used a full factorial experiment. The conclusion of the work showed that electrical supply, welding angle and welding position are variables that affect the number of defective parts due to spatter. Balasubramaniam [6] has used regression analysis to optimize the welding current and weld time setting to achieve a minimum nugget diameter and a maximum tensile shear force. The work was carried out on the SPRC35 steel sheet. Subramaniam concluded the increase in welding current will lead to increase in nugget diameter and tensile shear strength. Hamedi et.al [7] has used artificial neural network (ANN) and genetic algorithm (GA) to optimize spot welding parameters required to minimize dimensional deviations or gaps in subassemblies. The ANN was used to produce relationships between the welding parameters and their respective produced assembly gaps. GA was later used to select the optimum welding parameters which gave the smallest dimensional deviation. Norasiah et.al [8] has looked into optimizing spot weld parameters in order to achieve a nominal weld diameter and smaller heat affected zone (HAZ) using Response Surface Methodology. Kim et.al [9] also has used Response Surface Methodology to determine the optimum spot weld parameters for TRIP steels. The work has developed a regression model to determine the response surface expressing the relationship between the input variables (welding current, welding time and welding force) and the output variables (shear strength and indentation). Finally Lin et.al [10] has looked into spot weld parameter optimization using Taguchi Method and ANN. The Taguchi Method was used to identify the optimum settings for the four parameters; current, time, electrode force and electrode tip diameter. ANN was used in this work to model the welding process and predict the achieved weld strength for various welding schedules. The work reported above have used steels with the same type and thickness. Furthermore most work has only considered one weld characteristic; the weld strength except for Subramaniam [6] and Norasiah [8]. This work will be investigating the optimum weld setting for dissimilar steel and different thicknesses. The existing welding tables do not recommend parameter setting for dissimilar steel or dissimilar thickness. As most automotive body parts are made of steel of different thicknesses and different steel types as shown in Fig.1 above, determining the optimum welding schedule for welding joints of dissimilar thickness and dissimilar steel is very critical. The current practice in the automotive industry is to use the recommended welding schedule for the thinner steel when welding steel with two different thicknesses or the intermediate thickness when joining steels with three different thicknesses. This work will also consider three different weld characteristics namely the tensile shear strength, weld nugget diameter and the weld indentation as all these weld characteristics play significant roles in evaluating the quality of the spot weld. Finally the Grey based Taguchi Method which has not been reported by any of the authors above will be used for the optimization of the weld parameters.
2 EXPERIMENTATION
This work was carried at an automotive part manufacturing company using a weld gun which is used in the production line. This is to ensure that the results obtained will relate well to the actual working condition and can be used in the process improvement of the company. A Type-C welding gun (75 kVA) was used is this work. The steels used are hot rolled mild steel (SPHC) with thickness of 2.0 mm and cold rolled re-phosphorised steel (SPRC35) with thickness of 0.8 mm. Both these steel are commonly used in the automotive manufacturing. The compositions for both these steels are given in Table 1.
TABLE 1
SPHC AND SPRC STEEL COMPOSITIONS
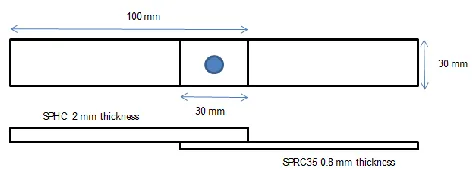
The test samples are 100 mm in length and 30 mm in width and each weld is made on sample combiningthe steels above. As the test samples will be used for the tensile shear test to determine the tensile strength of each weld, samples were prepared with an overlap of 30 mm as shown in Fig.2.
Fig. 2 Tensile shear test sample
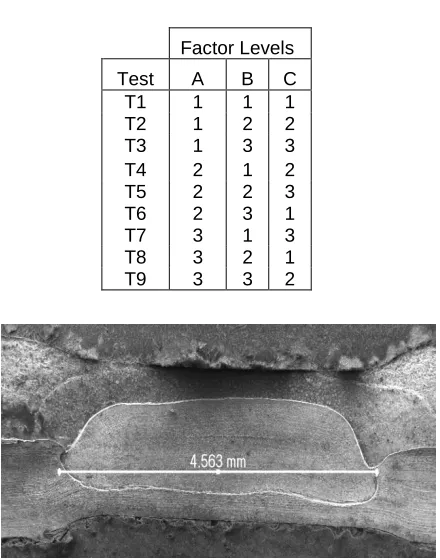
The electrodes which were used are RWMA Class II Cu-Cr alloy with tips of Ø6 mm diameter. Welding current, weld time and electrode force have been used as the control factors with each having three levels as shown in Table 2. The electrode tip diameter, squeeze time and hold time were maintained constant. Welding currents, weld times and electrode forces are identified by developing the weldability lobe for the welding gun mentioned above. The experimentation was carried out using L9 orthogonal array in Taguchi Method with eight degrees of freedom as shown in Table 3. Orthogonal Array is a statistical method of defining parameters that converts test areas into factors and levels. Test design using orthogonal array creates an efficient and concise test with fewer test cases without compromising test coverage. The interactions between control factors were not considered in this work.
Steel
Type C Mn P S Si
SPHC 0.15 0.6 0.05 0.05 -
TABLE 2
CONTROL FACTORS AND LEVEL
Four repetitions were made for each test and thirty six test samples were made for the entire work. The outputs of this work were the weld tensile shear strength, weld nugget diameter and weld indentation. Tensile shear strengths for three test samples for each test were obtained by conducting a tensile test on a Lloyd Tensile Testing Machine. The crosshead speed was maintained at 10 mm/min. The fourth test sample from each test was used to prepare metallographic samples. The samples were etched with 2% Nital solution to view the weld fusion zone as shown in Fig.3. Optical microscope was used to measure the weld fusion zone in order to determine the weld nugget diameter. Weld indentations on each weld samples were measured using a digital dial gauge. The dial gauge was placed on the sample surface to get a measurement point. The gauge was later place on the surface of the spot weld to get another measurement point. The difference between the measurement points is computed as the weld indentation.
TABLE 3
L9ORTHOGONAL ARRAY
Fig. 3 Diameter of the fusion zone
3 RESULTS OF OPTIMIZATION STUDY
3.1 Experimentation Results
The steps involved in the optimization process are as follows [11:-
i) Normalizing the experimental responses for all the trials.
ii) Performing Grey relational generating and to calculate Grey relational coefficient (γ).
iii)Calculating Grey relational grade by averaging the Grey relational coefficient.
iv)Performing statistical analysis of variance (ANOVA) with Grey relational grade and to find which parameter significantly affects the process.
v) Selecting the optimal levels of process parameters.
vi)Conduct confirmation experiment and verify the optimal process parameter setting.
Table 4 shows the results of the experimentation in L9orthogonal array. Tensile shear strength and weld diameter are weld characteristics that will be maximized and weld indentation is the weld characteristic that will be minimized in the work. Excessive indentation was found to affect the weld strength and the surface appearance of spot weld [12]. Therefore Grey relational analysis (1) will be used for both tensile shear strength (AvgStr) and weld diameter (AvgD) and (2) will be used for weld indentation (AvgI) for normalization purpose.
TABLE 4
RESULTS IN L9 ORTHOGONAL
Test A B C AvgStr AvgD AvgI
T1 1 1 1 6.82 4.77 0.21
T2 1 2 2 7.77 5.53 0.22
T3 1 3 3 7.51 6.43 0.38
T4 2 1 2 7.67 5.53 0.15
T5 2 2 3 7.93 6.2 0.29
T6 2 3 1 7.83 6.4 0.36
T7 3 1 3 7.63 6.27 0.4
T8 3 2 1 7.43 5.73 0.21
T9 3 3 2 7.01 6.37 0.48
AvgStr = average tensile shear strength (kN), AvgD = average weld nugget diameter (mm), AvgI = average weld indentation (mm).
3.2 Normalized Experimental Results
The normalized original sequence used in Table 5 is as the following [13]:-
a. If a larger quality characteristics of the original data is better (larger-the-better)
) ( min ) ( max
) ( min ) ( ) (
) 0 ( )
0 (
) 0 ( )
0 ( *
k x k x
k x k x k x
i i
i i
i
(1)
b. If a smaller quality characteristics of the original data is better (smaller-the-better)
) k ( x ) k ( x max ) k (
x (0) (0)
) 0 ( i ) 0 ( i *
i
(2)
Sym Factor Unit Level 1
Level 2
Level 3
A Force kN 2 3 4
B Current kA 8 9 10
C Time cycle
s 10 15 20
Factor Levels
Test A B C
T1 1 1 1
T2 1 2 2
T3 1 3 3
T4 2 1 2
T5 2 2 3
T6 2 3 1
T7 3 1 3
T8 3 2 1
where *()
k
xi is the normalized original sequence after pre-processing, max.(0)( )
k
xi is the maximum value of () ) 0 (
k
xi and
) ( .
minxi(0)k is the minimum value of ( ) ) 0 (
k
xi . Table 5 shows the normalized values after data pre-processing using Grey relational analysis (1) and (2).
TABLE 5
NORMALIZED RESULTS USING GREY RELATIONAL ANALYSIS
Test A B C AvgStr AvgD AvgI
T1 1 1 1 0.00 0.00 0.82
T2 1 2 2 0.86 0.35 0.79
T3 1 3 3 0.62 0.80 0.30
T4 2 1 2 0.77 0.35 1.00
T5 2 2 3 1.00 0.65 0.58
T6 2 3 1 0.91 0.83 0.36
T7 3 1 3 0.73 0.68 0.24
T8 3 2 1 0.55 0.44 0.82
T9 3 3 2 0.17 1.00 0.00
3.3 Deviation Sequences
Table 6 gives the deviation sequences, (k) oi
which is the absolute value between *( )
0k
x and x*(k)
i ) ( ) ( ) ( * *
0k x k
x
k i
oi
(3)
TABLE 6
DEVIATION SEQUENCES
3.4 Determination of Grey Relational Coefficient and Grey Relational Grades.
Table 7 shows the calculations of Grey relational coefficients and Grey relational grades using (4) and (5) respectively. max 0 max min * * 0 . ) ( . )) ( , ( k k x x i i i (4) 1 )) ( ), ( (
0 x0* k xi* k
ζ which is a distinguishing coefficient was given a value 0.5.
) ( ) ( max
max *0 *
max x k xi k
k i j
minmin ( ) ( )
* * 0
min x k xi k
k i j ) ) ( ), ( ( 1 ) , ( 1 * * 0 * * 0
n k ii x k x k
n x
x
(5)
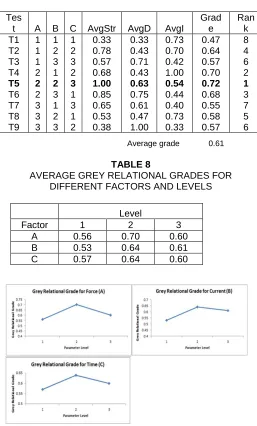
Grey relational grades represented the level of correlation between the reference and the comparability sequences; the larger Grey relational grade means the comparability sequence exhibiting a stronger correlation with the reference sequence [13]. Table 8 shows the average grey relation grade for each factor levels. Fig.3 shows the largest value of grey relational grades for factors A, B and C respectively. Therefore the welding schedule with force of 3 kN, time of 15 cycles and current of 9 kA is identified as the optimal welding schedule for welding the SPHC and SPRC35 steels with 2mm and 0.8mm thicknesses respectively
TABLE 7
GREY RELATIONAL COEFFICIENTS AND GRADES
TABLE 8
AVERAGE GREY RELATIONAL GRADES FOR DIFFERENT FACTORS AND LEVELS
Fig 3 Largest grey relational values
Test A B C AvgStr AvgD AvgI
T1 1 1 1 1.00 1.00 0.18
T2 1 2 2 0.14 0.65 0.21
T3 1 3 3 0.38 0.20 0.70
T4 2 1 2 0.23 0.65 0.00
T5 2 2 3 0.00 0.35 0.42
T6 2 3 1 0.09 0.17 0.64
T7 3 1 3 0.27 0.32 0.76
T8 3 2 1 0.45 0.56 0.18
T9 3 3 2 0.83 0.00 1.00
Tes
t A B C AvgStr AvgD AvgI
Grad e
Ran k T1 1 1 1 0.33 0.33 0.73 0.47 8 T2 1 2 2 0.78 0.43 0.70 0.64 4 T3 1 3 3 0.57 0.71 0.42 0.57 6 T4 2 1 2 0.68 0.43 1.00 0.70 2
T5 2 2 3 1.00 0.63 0.54 0.72 1
T6 2 3 1 0.85 0.75 0.44 0.68 3 T7 3 1 3 0.65 0.61 0.40 0.55 7 T8 3 2 1 0.53 0.47 0.73 0.58 5 T9 3 3 2 0.38 1.00 0.33 0.57 6
Average grade 0.61
Level
Factor 1 2 3
A 0.56 0.70 0.60
B 0.53 0.64 0.61
4 ANALYSIS OF VARIANCE (ANOVA)
ANOVA was carried out to find out which out of the three factors used in this work gives the most significant contribution in the spot welding of two different steels (SPHC and SPRC35) with two different thicknesses (2mm and 0.8mm). Results are shown in Table 9 below:-
TABLE 9
ANOVA ANALYSIS FOR WELDING PARAMETERS
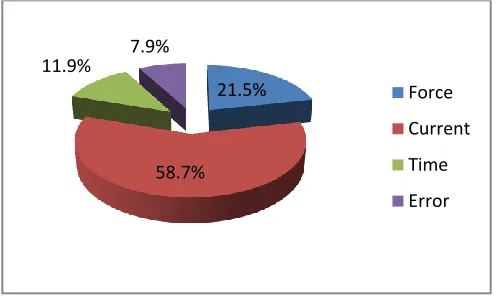
As show in Fig. 4, Factor B, welding current seems to be giving the most significant contribution of 58.7%. This is followed by Factor A, electrode force with 21.5% contribution to increase the tensile shear strength and weld diameter as well as minimize electrode indentation, if simultaneously considered.
Fig. 4 Parameter contribution in process optimization
5 CONFIRMATION TEST
Further experiment was carried out to validate the optimum welding schedule. The validation experiment is done to determine the improvements in the weld characteristics compared to the current welding schedule used in the production line. The current welding condition uses a welding schedule recommended by the welding table for steel with 0.8 mm thickness. Table 9 shows the comparison results for the current welding schedule and the optimum welding scheduleFour repetition were made for each welding schedule. The predicted grey relational grade for the optimum schedule was calculated using (6).
𝛾 = 𝛾𝑚 + ( 𝛾𝑛 – 𝛾𝑚 ) (6)
where𝛾𝑚 = total mean grey relational grade and 𝛾𝑛 = mean grey relational at optimum level
TABLE 9
Comparison between current welding schedule and optimum welding schedule
The comparison of results show that there is an improvement in weld strength, weld nugget diameter and weld indentation. Average weld strength and diameter have increased to 7.99 kN and 6.6 mm diameter respectively while the electrode indentation has reduced to 0.11 mm.
6 CONCLUSIONS
This work was conducted to study the use of Grey Based Taguchi Method to optimize the welding schedule for welding steels with dissimilar thicknesses and types. The conclusions of the work are as below:-
a) The optimum welding schedule obtained from this work is a combination of 3 kN of electrode force, time of 15 cycles and 9 kA welding current.
b) ANOVA analysis shows that current gives the most significant contribution in this work to obtain optimized weld characteristics.
c) The optimum welding schedule showed improvement in the weld characteristics compared to the welding schedules currently being used.
7 ACKNOWLEDGMENT
The author wanted to thank Autokeen (M) SdnBhd, Malaysia, for supporting this work and giving permission to carry out the experimentation at the company.
8 REFERENCES
[1] S. Aslanlar, A. Ogur, U. Ozsarac, and E. lhan, E, ―Effect of Welding Current on Mechanical Properties of Galvanized Chromided Steel Sheets in Electrical Resistance Spot Welding,‖ Materials and Design, vol. 28, pp. 2-7, 2007.
[2] M. Pouranvari, and S.P.H Marashi, S.P.H, ―Factors Affecting Mechanical Properties of Resistance Spot Welds,‖ Materials Science and Technology, vol. 26, no. 1, pp. 1137-1144, 2010.
[3] A.G. Thakur, T.E. Rao, M.S. Mukhedkar, and V.M. Nandedkar, ―Application of Taguchi Method for Resistance Spot Welding of Galvanized Steel,‖ARPN Journal of Engineering and Applied Sciences, vol. 5, no. 11, pp. 22-26, 2010.
[4] A.G. Thakur, and V.M. Nandedkar, ―Application of Taguchi Method to Determine Resistance Spot Welding Conditions of Austenitic Stainless Steel 21.5%
58.7% 11.9% 7.9%
Force
Current
Time
Error
A B C Avg Str
Avg D AvgI
Grey relational grade Current 2 8 20 6.92 5.3 0.21 0.63
Optimum 3 9 15 7.99 6.6 0.11
Predicted – 0.76
Experime ntal –
AISI304,‖ Journal of Scientific and Industrial Research, vol. 69, pp. 680-683, 2010.
[5] T. Wuttipornpun, ― Analysis of Welding Factors to Determine an Optimal Condition of Resistant Spot Welding Process,‖ The Journal of KMUTNB, vol. 20, no. 1, pp. 1-9, 2010.
[6] M. Subramaniam, and V. Subramanian, ―Effect of Process Parameters on SPRC35 Spot Welded Automotive Panels,‖ ActaMetallurgicaSinica, vol. 23, no. 3, pp. 185-190, 2010.
[7] M. Hamedi, M. Shariatpanahi, and A. Mansourzadeh, A‖ Optimizing Spot Welding Parameters in a Sheet Metal Assembly by Neural Networks and Genetic Algorithm, ― Proc. IMechE Part B: J. Engineering Manufacture,‖ vol. 221, pp. 1175-1184. 2007.
[8] M. Norasiah, Y.H.P. Manurung, M. Hafidzi, and S.K. Abas, ― A Quality Improvement Approach for Resistance Spot Welding using Multi-Objective Taguchi Method and Surface Response Methodology,‖International Journal of Advanced Science, Engineering and Information Technology, vol. 2, no.3, pp. 17-22, 2012.
[9] T. Kim, H. Park, and S. Rhee, ―Optimization of Welding Parameters for Resistance Spot Welding of TRIP Steel with Surface Response Methodology,‖ International Research of Production Research, vol. 43, no. 21, pp. 4643-4657, 2005.
[10]H.L.Lin, T. Chou, and C.P. Chou, ― Optimization of Resistance Spot Welding Process using Taguchi Method and a Neural Network,‖ Experimental Techniques, pp. 30-36, 2007.
[11]K.S. Prasad, Ch.S. Rao, and D.NageswaraRao, ―Application of Grey Relational Analysis for Optimizing Weld Bead Geometry Parameters of Pulsed Geometry Micro Plasma Arc Welded AISI 304L Stainless Steel Sheets,‖ International Journal of Advanced Design and Manufacturing Technology, vol. 6, no. 1, pp. 79-86, 2013.
[12]S. Niranjan Kumar, and Y. Vijayakumar, ―Application of Taguchi method for optimization of resistance spot welding of austenitic stainless steel AISI 301L,‖ Innovative Systems Design and Engineering, vol. 3, no. 12, pp 49-61, 2012.
[13]C.J. Tzeng, Y.H. Lin, Y.K. Yang, and M.C. Jeng, ―Optimization of Turning Operations with Multiple Performance Characteristics using the Taguchi Method and Grey Relational Analysis,‖ Materials Processing Technology, vol. 209, no. 6, pp. 2753-2759, 2009.