216
Microwave Assisted Synthesis of Polycrystalline Flower-like Zinc
Oxide Nanostructure Using Dicationic Ionic Liquid
M. Movahedi, A. R. Mahjoub*, I. Yavari, E. Kowsari
Department of Chemistry, Tarbiat Modares University, Tehran, I.R. Iran
(*) Corresponding author: [email protected]
(Received: 05 Sep. 2010 and Accepted: 12 Nov. 2010)
Abstract:
In this paper, synthesis of the flower-like zinc oxide was performed using microwave assisted dicationic ionic
liquid [mmp(im)2 ]Br2 . The polycrystalline flower-like zinc oxide nanostructure was obtained when a suitable
mole ratio (ionic liquid /zinc acetate) and short duration microwave was used. X-ray diffraction (XRD),
scanning electron microscopy (SEM), and photoluminescence (PL) spectra were employed to characterize of the as-synthesized zinc oxide. The SEM image illustrates that the surface of flower-like zinc oxide is
polycrystalline with nanoparticles of about 48 nm. The samples fabricated in presence and absence of ionic liquid exhibited (UV, green-yellow) and (UV, blue, green) emission, respectively, while Commercial ZnO exhibited UV and green emission.
Keywords: Zinc oxide; Flower-like; Polycrystalline; Ionic liquid; Luminescence
1. INTRODUCTION
Room temperature ionic liquids (RTIL) have been widely studied in organic chemistry as new types of environmentally friendly reaction media, owing to their unique properties such as extremely low volatility, wide temperature range in liquid state, ionic conductivity and non-flammability [1]. A
variety of inorganic nanostructures have been fabricated via various RTIL involved processes, including, TiO2 nanoparticles and nanotubular [2,
3], Bi2Se3 nanosheets [4], CdS hallow nanospheres [5], gold nanoparticles [6], CdF2 nanoflakes [7], ZnO nanorods [8-10] flower-like ZnO [11, 12] ZnO particles [13] and iron oxide nanorod and nanocubs [14]. However, in contrast to their application in
organic chemistry the use of ionic liquid (IL) in inorganic synthesis is still in its primary stage.
In recent years, the microwave method has been
rapidly developed for synthesis of nanomaterial.
Ionic liquids are excellent microwave absorbing agents due to their high ionic conductivity and
polarizibility, thus leading to a high heating rate and a significantly shortened reaction time [15, 16]. Luminescence spectroscopy is known to be an effective method for evolution of surface defects and optical properties. Generally, the UV emission is due to the recombination of photo-generated electrons
and holes, while the visible emission is associated
with oxygen vacancies [17]. Presence of oxygen vacancy and existence of defect in the structure of
zinc oxide makes the ZnO nanostructures ideal gas
sensors and photocatalyst [18-21]. Furthermore, room temperature ferromagnetism property of zinc oxide was strongly related to the presence of oxygen vacancy defect [22]. Hence, new strategy synthesis of zinc oxide is important for tailoring of gas sensor and room temperature ferromagnetism devices. In this paper, a simple and rapid one-step method by microwave assisted ionic liquid [mmp(im)2]Br2 was
217
proposed for the synthesis of polycrystallineflower-like zinc oxide nanostructure. X-ray diffraction (XRD), scanning electron microscopy (SEM), and photoluminescence (PL) spectra have been employed for characterization of the as-synthesized ZnO samples.
2. EXPERIMENTAL
The IL used in this study was synthesized according to the procedures reported in the literature [23]. Figure 1 shows the structure of the IL used in this
study.
11
Table 1: Experimental conditions for the prepared zinc oxide
Fig. 1
N N N N
Br Br
+
+
Fig. 2
Fig. 3
Morphology ProductMole ratio of
IL/Zn2+ Time of reaction (min) % Microwave Out put power Precursors Sample No. Fig. 2 ZnO -1.5 75 Zinc acetate/NaOH 1 Fig. 4a ZnO + Zn(OH)2
0.75:10 1 75 Zinc acetate/NaOH 2 Fig. 4c ZnO 1:10 1 75 Zinc acetate/NaOH 3 Fig. 4d ZnO 2:10 1 75 Zinc acetate/NaOH 4
Figure 1: The structure of the dicationic IL used in this study.
Zinc acetate-2-hydrate and Commercial ZnO were purchased from Aldrich and Merk, respectively. Sodium hydroxide was used without further purification. Zinc acetate dihydrate was dissolved
in double distilled water under vigorous stirring
and, NaOH solution (mole ratio of OH-/Zn2+ = 15:1)
was added drop wise until the solution become transparent, and a solution of the IL in double
distilled H2O was added and stirred for about 5 min (mole ratio of IL/Zn2+ = 0.75:10, 1:10 and 2:10).
Finally, 10 mL of the mixture was loaded into a 50 mL capacity pyrex bottle. The reaction vessel was placed in a microwave oven (Daewo,
KOR-63A5, 800W) and 75% of the microwave output power was used to irradiate the mixture for 1 min (on for 30 s, off for 7 s). The product was separated
by decantation, washed with double distilled water several times and dried. Furthermore, the
experiment was carried out in absence of IL under
the same condition.
The structure and morphology of the products were characterized by XRD (Holland Philips Xpert X-ray diffractometer with Cu-Kα radiation) and SEM (Holland Philips XL30 microscope with an accelerating voltage of 25 kV). The PL spectra were recorded on a Varian Cary-Eclipse spectrometer.
3. RESULTS AND DISCUSSION
The conditions of typical samples are listed in Table 1. Figure 2 shows the SEM image and XRD pattern of sample 1. In this experiment zinc oxide was synthesized in absence of IL. The SEM image illustrates agglomerated flower-like zinc oxide. The position of the diffraction peaks (XRD) is in good agreement with the JCPDS file of ZnO (JCPDS card No. 36-1451).
Sample 2 was prepared in presence of the IL (mole ratio of IL/Zn2+=0.75:10). The XRD pattern of
sample 2 indicated that the product consists of two types of peaks, which can be well indexed to the
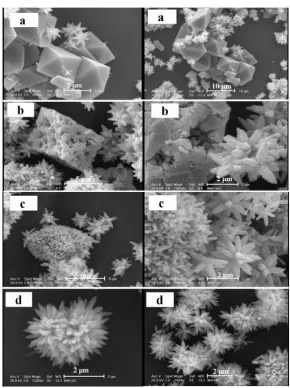
ZnO and Zn(OH)2 reported in JCPDS file (No.36-1451 and No.38-0385) (Figure 3A). The SEM image of this product is shown in Figure 4a. When the product was transferred to the furnace and heated at 180ºC for 1 hour, pure ZnO was obtained (see Figures 3B, XRD pattern and 4b, SEM image).
Mahjoub,
et al.
Table 1: Experimental conditions for the prepared zinc oxide
Fig. 1
N N N N
Br Br
+
+
Fig. 2
Morphology ProductMole ratio of
IL/Zn2+ Time of reaction (min) % Microwave Out put power Precursors Sample No. Fig. 2 ZnO -1.5 75 Zinc acetate/NaOH 1 Fig. 4a ZnO + Zn(OH)2
218
International Journal of Nanoscience and Nanotechnology
Figure 3: XRD pattern of the: (A) as-prepared product, mole ratio of IL/Zn2+ = 0.75:10, sample 2 (B) annealed sample 2 at 180 °C for 1 hour (C) as-prepared product, mole ratio of IL/Zn2+ = 1:10, sample 3 (D)
as-prepared product, mole ratio of IL/Zn2+ = 2:10, sample 4.
11
Table 1:
Experimental conditions for the prepared zinc oxide
Fig. 1
N
N
N
N
Br
Br
+
+
Fig. 2
Fig. 3
Morphology Product
Mole ratio of
IL/Zn2+
Time of reaction
(min)
% Microwave Out put
power Precursors
Sample
No.
Fig. 2 ZnO
-1.5
75 Zinc acetate/NaOH
1
Fig. 4a ZnO + Zn(OH)2
0.75:10 1
75 Zinc acetate/NaOH
2
Fig. 4c ZnO
1:10 1
75 Zinc acetate/NaOH
3
Fig. 4d ZnO
2:10 1
75 Zinc acetate/NaOH
4
11
Table 1: Experimental conditions for the prepared zinc oxide
Fig. 1
N N N N
Br Br
+
+
Fig. 2
Fig. 3
Morphology Product
Mole ratio of
IL/Zn2+
Time of reaction (min)
% Microwave Out put
power Precursors
Sample
No.
Fig. 2 ZnO
-1.5
75 Zinc acetate/NaOH
1
Fig. 4a ZnO + Zn(OH)2
0.75:10 1
75 Zinc acetate/NaOH
2
Fig. 4c ZnO
1:10 1
75 Zinc acetate/NaOH
3
Fig. 4d ZnO
2:10 1
75 Zinc acetate/NaOH
4
219
Mahjoub,
et al.
13
Fig. 4
Figure 4: SEM images of the: (a) as-prepared product, mole ratio of IL/Zn2+ = 0.75:10, sample 2 (b) annealed sample 2 at 180 °C for 1 hour, (c) as-prepared product, mole ratio of IL/Zn2+ = 1:10, sample 3 (d)
as-prepared product, mole ratio of IL/Zn2+ = 2:10, sample 4.
Fig. 5
Fig. 6
Int
ens
ity
(a
.u.)
448 nm
573 nm 393 nm
220
International Journal of Nanoscience and Nanotechnology
Increasing the mole ratio of IL/Zn2+ (1:10 or 2:10)led to pure zinc oxide (sample 3 and 4). The phase characteristics of the products were determined by using XRD pattern of the samples. All the reflections were indexed as pure hexagonal ZnO phase which were in good agreement with the data reported for Zincite [JCPDS 36-1451] (Figure 3C and 3D). XRD patterns indicated that the products were pure powders with no observable peaks relevant to such impurities as Zn(OH)2. Figures
4c and 4d show the morphologies of zinc oxide prepared in presence of the IL with mole ratio of
IL/Zn2+ = 1:10 and 2:10, respectively. It is obvious
from the results that suitable mole ratio of the IL/
Zn2+ played an important role in the morphology
and purity of zinc oxide. The SEM image illustrates that the polycrystalline flower-like zinc oxide has nanoparticles on the surface with average size of
about 48 nm (Figure 5).
In the present work, the duration of microwave heating process was very short (1 min). The microwave irradiation played a critical role in the rapid formation of flower-like zinc oxide. During the microwave irradiation, the heating phenomenon was occurred by the interaction of the dipole molecules with the high frequency electromagnetic
radiation [24]. Polar molecules such as H2O and
ionic liquid have high dipole moments that make them appropriate solvents for microwave-assisted reactions. For the growth process of the flower-like ZnO crystals a possible formation process of ZnO was suggested as follows. Zinc hydroxide
[Zn(OH)4]2- species could be easily formed, and
served as growth units for the formation of ZnO nuclei and epitaxial growth of ZnO nuclei into flower-like structures. The overall reaction may be simplified as follows:
[Zn(OH)4]-2 Microwave irradiationZnO+H2O +2OH
-In this investigation, the formation of ZnO flower-like is due to the initial formation of nuclei by the
microwave radiations, and then the IL molecules may serve as a growth controller [25]. As it is
known, ZnO is a polar crystal, O2- is in hexagonal
closest packing, and each Zn2+ lies within a
tetrahedral group of four oxygen ions [26]. The IL is
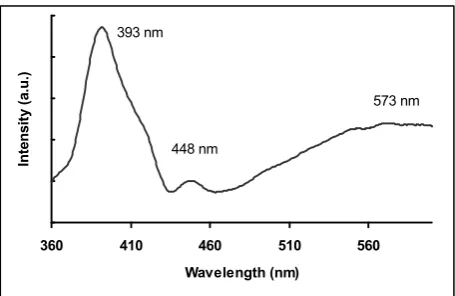
Figure 6: Room temperature PL spectrum of the zinc oxide produced in absence of IL, sample 1.
14
Fig. 5
Fig. 6
360 410 460 510 560
Wavelength (nm) Int ens ity (a .u.) 448 nm 573 nm 393 nm 15
Fig. 7
0 0.5 1350 400 450 500 550 600
Wavelength (nm) N or m al iz ed In ten si ty (B) (C) (D) (A)
Fig.8
0 0.2 0.4 0.6 0.8 1360 410 460 510 560
Wavelength (nm) In ten si ty ( a. u. ) 393 n m 50 8 n m 15
Fig. 7
0 0.5 1350 400 450 500 550 600
Wavelength (nm) N or m al iz ed In ten si ty (B) (C) (D) (A)
Fig.8
0 0.2 0.4 0.6 0.8 1360 410 460 510 560
Wavelength (nm) In ten si ty ( a. u. ) 393 n m 50 8 n m
Figure 7: Room temperature PL spectra of the ZnO produced in presence of IL: (A) as-prepared product, mole ratio of IL/Zn2+ = 0.75:10, sample 2 (B) annealed sample 2 at 180 °C for 1 hour, (C) as-prepared product, mole ratio of IL/Zn2+ = 1:10,
sample 3 (D) as-prepared product, mole ratio of IL/Zn2+ = 2:10, sample 4.
221
Mahjoub,
et al.
ionic compound, which completely ionize in water. The cations of ionic liquid can be easily absorbed on the surface of the O2-- terminated by electrostatic
force, and the hydrogen bond, formed between the hydrogen atom at position 2 of the imidazole ring and the oxygen atoms of O–Zn, may act as an effective bridge to connect the O2--terminated plane
of the produced nuclei of metal oxide and cations of
ionic liquids [12, 27, 28].
In other experiments, PL spectra of the ZnO products were measured by an excitation wavelength of 325 nm at room temperature to examine the quality of the product. The PL spectrum of the sample 1
indicates a strong UV emission bond at 393 nm,
blue emission at 448 nm and green emission at
540-573 nm (Figure 6).
The PL spectra of zinc oxide fabricated in presence of IL (samples 2, 3 and 4) are shown in Figure 7. The emission bonds show a strong UV emission at about (396-401 nm) and a green-yellow emission peak (540-584 nm). PL spectrum of the sample 2 annealed at 180°C for 1 hour shows a strong green-yellow emission band (Figure 7 B). This indicates the presence of large quantities of defect centers. Generally, the green emission (500-570nm) corresponds to the singly ionized oxygen vacancy in zinc oxide [29-31].
PL spectrum of the commercial zinc oxide is shown in Figure 8. The fluorescence spectrum of
commercial zinc oxide shows a strong UV emission at 393 nm and a weak green emission at about
508 nm. A comparison between PL spectra of the commercial zinc oxide with prepared samples show a rising trend in the green emission range of 500-570 nm for the prepared samples. The result could be attributed to the increasing of oxygen vacancy; however there is no upward trend for the commercial
Zinc oxide.
4. CONCLUSIONS
In summary, results show that short duration of microwave (1 min) and suitable mole ratio of IL/
Zn2+ = 1:10 led to rapid formation of polycrystalline
flower-like zinc oxide. This product consists of
nanoparticles on the surface with grain size of about 48 nm. The photoluminescence spectrum of this sample exhibited strong UV emission at 401 nm and a green-yellow emission at 540-584 nm. Generally, the UV peak is due to the recombination of
photo-generated electrons and holes, while the visible emission is associated with oxygen vacancies. On
the basis of our experimental results, presence of the IL plays an important role in photoluminescence properties.
ACKNOWLEDGMENTS
This work was supported by Tarbiat Modares University. The authors are grateful for the financial support
REFERENCES
1. Y.J. Zhu, W.W. Wang, R.J. Qi, X.L Hu, Angew. Chem. Int. Ed. Engl. 43 (2004) 1410.
2. T. Alammar, A. Birkner, O. Shekhah, A.V. Mudring, Mater. Chem. Phy. 120 (2010) 109.
3. I. Paramasivam, J.M. Macak, T. Selvam, P. Schmuki,
Electrochimica Acta. 54 (2008) 643.
4. Y. Jiang, Y.J. Zhu, G.F. Cheng. Cryst. Growth.
Design. 6 (2006) 2174.
5. X. Li, Y. GaO, L. Yu, L. Zheng, J. Solid State. Chem
183 (2010) 1423.
6. K.S. Kim, D. Demberelnyamba, H. Lee, Langmuir. 20 (2004) 556.
7. C. Xu, H. Luo, W. Liu, T. Ying, Ceramic.
International. 35 (2009) 917.
8. T. Alammar, A.V. Mudring, Mater. Lett. 63 (2009) 732.
9. C. Chen, Q. Li, M. Nie, H. Lin, H. Wu, Y. Wang,
Material Res. Bull. 46 (2011) 888.
10. L. Wang, Sh.Z. Xu, H.J. Li, L.X. Chang, Z. Su,
M.H. Zang, L.N. Wang, K.N. Huang, J. Solid State.
Chem. 184 (2011) 720.
222
International Journal of Nanoscience and Nanotechnology
12. I. Yavari, A.R. Mahjoub, E. Kowsari, M. Movahedi,
J. Nanopart. Res.11 (2009) 861.
13. H. Zou, Z. Li, Y. Luan, T. Mu, Q. Wang, L. Li, G. Ge, G. Chen, Current Openion in Solid State an
Material Sci. 14 (2010) 75.
14. Y. Wang, H. Yang, Chem. Engin. J. 147 (2009) 71.
15. P. Wasserscheid, T. Welton, Ionic Liquids in Synthesise. Wiley-VCH, Weinheim, 2008, chap. 2.1.2, p. 9-12.
16. Y. Ni, S. Yang, J. Hong, P. Zhen, Y. Zhou, D. Chu, Scripta Materialia, 59 (2008) 127.
17. M.H Weber, F.A, Selim, D. Solodovnikov, K.G
Lynn, Applied Surface Science 255 (2008) 68.
18. L.Q. Jing, Y.C. Qu, B.Q. Wang, S.D. Li, B.J. Yang,
W. Fu, H.G. Fu, J.Z. Sun, Sol. Energy Mater. Sol.
Cells, 90 (2006) 1773.
19. L.M. Li, Z.F. Du, T.H. Wang, Sensor and Actuators
B, 147 (2010) 165.
20. C.M. Chang, M.H. Hon, I. C. Lu, Sensor and
Actuators B, 151 (2010) 15.
21. N. Faal-Hamedani, A.R. Mahjoub, A.A. Khodadadi,
Y. Mortazavi , Sensors and Actuators B, xxx (2011) xxx–xxx
22. L. Zhang, Z. Ye, B. Lu, J. Lu, Y. Zhang, L. Zhu, J. Huang, W. Zhang, J. Huang, J. Zhang, J. Jiang, K. Wu,
Z. Xie, J. Alloys and Compounds, 509 (2011) 2149.
23. Y.S. Vygodskii, E.I. Lozinskaya, A.S. Shaplov,
Macromol. Rapid Commun. 23 (2002) 676.
24. H. Yang, C. Huang, X. Li, R. Shi, K. Zhang, Mater. Chem. Phys. 90 (2005) 155.
25. [25] L. Wang, L. Chang, B. Zhao, Z. Yuna, G.
Shao, W. Zheng, Inorg. Chem. 74 (2008) 1443. 26. X.L. Hu, Y.J. Zhu, S.W. Wang, Mater. Chem.
Phys. 88 (2004) 421.
27. L. Wang, L. Chang, B. Zhao, Z. Yuan, G. Shao, W. Zheng, Inorg. Chem. 47 (2008) 1443.
28. J. Hu, F. CaO, Y. Shang, C. Peng, H. Liu, Y. Hu, Microporous and Mesoporous Materials 142 (2011)
268.
29. S. Monticone, R. Tufeu, A.V. Kanaev, J. Phys. Chem. B 102 (1998) 2854.
30. O.D. Jayakumar, V. Sudarsan, C. Sudakar, R. Naik, R.K. Vatsa, A.K. Tyagi, Scripta Materialia. 62
(2010) 662.
31. S. Singh, M.S. Ramachandra, Scripta Materialia.