Original Research Article
Utilization of immunization services among children aged under five
in Kirinyaga County, Kenya
Margaret W. Njeru
1*, Priscilla N. Kabue
2, Albert G. Gachau
3INTRODUCTION
Global immunization prevents mortalities of approximating 3 million children aged under five years annually with 64% of them being from Africa.1 Immunization has been regarded as the key strategy to curb communicable diseases which are number one killer of children aged under five.2 To achieve maximum immunization services, the Kenya expanded programme
on immunization (KEPI) recommends adherence to the standard operating procedures to ensure vaccine preventable diseases are controlled, eliminated and eradicated. This can only be possible if staff is properly trained on KEPI, all logistics are available to ensure cold chain is maintained and efficient active and passive surveillance done to detect vaccine preventable diseases (VPD) that might emerge.3
ABSTRACT
Background: Immunization is the key strategy to curb communicable diseases which are the number one killer of children under five years of age. Immunization prevents mortalities of approximating three million children under five years annually. This study aimed to assess utilization of immunization services among children aged under five in Kirinyaga County, Kenya.
Methods: This was a descriptive cross-sectional study conducted among 388 participants in the five sub-counties of Kirinyaga County through systematic random sampling. Data was collected using a structured interview and review of recorded data from the Children immunization record card. Data was analyzed using SPSS and chi-square tests used to measure the association between independent and dependent variables. Statistical significance was set at p≤0.05.
Results: Immunization at birth and at 6 weeks was highly utilized at 91%. However, there was a decline during the subsequent visits. Age, gender, profession and level of income were significant factors that affected timely immunization. Health service barriers to utilization included long ques and waiting time, stock out of vaccine and rescheduling of vaccination and clinic return dates. Other identified factors were myths and misconception, side effects, parity and lack of information.
Conclusions: The results showed that utilization of immunization services was not in compliance with the expanded programme on immunization schedule. There is therefore need for health education programs to be carried out to improve utilization of immunization services and a door to door campaign to trace and immunize defaulters.
Keywords: Utilization, Immunization, Under-fives
Department of 1Population and Reproductive Health, 2Community Health Nursing, 3Pathology, Kenyatta University, Nairobi, Kenya
Received: 19 December 2018
Revised: 18 February 2019
Accepted: 01 March 2019
*Correspondence:
Dr. Margaret W. Njeru,
E-mail: [email protected]
Copyright: © the author(s), publisher and licensee Medip Academy. This is an open-access article distributed under the terms of the Creative Commons Attribution Non-Commercial License, which permits unrestricted non-commercial use, distribution, and reproduction in any medium, provided the original work is properly cited.
In Kenya, the immunization schedule is as follows: BCG and oral polio vaccine is given at birth or within 2 weeks after birth; 3 doses of oral polio, pneumococcal vaccine and pentavalent vaccine all administered at 6 weeks, 10 weeks and 14 weeks; 1 dose of IPV given at 14 weeks; rotavirus vaccine is administered at 6 weeks and 10 weeks. At 6 months‟ vitamin A is given and measles 1 and 2 vaccine is administered at 9 and 18 months respectively.4 In Kenya in every nine children, one child dies annually from vaccine preventable diseases before they attain the age of five.5 According to the centre for disease control (CDC) in Kenya by the year 2015, the mortality rate of under-five stood at 73/1000 live births.6 A study in Pokot County Kenya noted that despite the Kenyan governments initiative to improve childhood immunization by availing vaccines and training of health workers, immunization services was not accessed by all children thus demonstrating equity gaps.7
According to the county health information system (CHIS), Kirinyaga County‟s under five mortality is at 48/1000 live births.8 In Kirinyaga County, children vaccinated in the year 2014 were reported to be at 85%.8 Statistics showed mortalities and morbidities reported to be related to vaccine preventable diseases were; pneumonia 11%, diarrhea 34%, eye and ear infections 18% and 191 cases of confirmed TB.8 These statistics indicate a gap as there is no correlation between the immunization coverage and mortalities and morbidities related to vaccine preventable disease. The study was prompted by the alarming statistics on morbidities related to vaccine preventable diseases in a county where there has been a lot of intervention on immunization services. The main objective of the study was to assess utilization of immunization services among children aged under five in Kirinyaga County, Kenya.
For proper control and elimination of vaccine preventable diseases which are leader killer and disabling diseases of young children under the age of five years, the provision of immunization services and interventions should be put in place to ensure successful utilization of immunization services that ensures a „reach every child strategy‟. The results and gaps generated from the study formed baseline information that will be used in policy advocacy towards improving immunization services for this key population.
METHODS
This was a descriptive cross-sectional study conducted in 5 sub counties in Kirinyaga County, Kenya that took place between June 2017 to June 2018.Through proportionate sampling, data was collected in the community among 388 participants who had children under five years and have lived for at least five years in Kirinyaga County. To get the participating households, systematic random sampling of every 9th household was done. The respondents were interviewed through a structured questionnaire and the children immunization
record card was assessed for data entry. Quantitative data was analyzed using IBM statistical package for social scientists (SPSS). Descriptive data was presented using frequencies, percentages, means and standard deviation while inferential statistics used chi-square test to measure association between independent and dependent variables. P values equal to or less than 0.05 were considered statistically significant.
RESULTS
Social-demographic characteristics of the participants
In this study 79% of the respondents were female, 45% of whom were aged between 20-30 years. Most of the participants were married, had at least a secondary school education however most were unemployed (Table 1).
Table 1: Social-demographic characteristics of the study participants (n=388).
Variables n %
Gender
Male 44 20.6
Female 308 79.4
Age (in years)
10–20 81 20.9
20–30 174 44.9
30–40 82 21.2
Over 40 51 13.1
Occupation
Employed 74 19.1
Self–employed 146 37.6
Not–employed 160 41.2
Others student* 8 2.1
Marital Status
Non-responses 24 6.2
Widows and widowers 13 3.4
Single 169 43.6
Married 182 46.8
Religion
Christian 361 93
Muslim 19 4.9
Others 8 2.1
Level of education
None 21 5.4
Primary 161 41.8
Secondary 169 43.6
Tertiary 37 9.7
Level of utilization of the immunization services
Table 2: Level of immunization utilization (n=388).
Variables Immunized on time Immunized late Total immunized Not immunized
(n) % (n) % (n) % (n) %
At Birth 329 87 25 4 354 91 34 9
At 6 weeks 339 87 15 4 354 91 35 9
At 10 weeks 336 87 14 3 350 90 39 10
At 14 weeks 315 81 3 1 318 82 70 18
At 9 months 296 76 15 4 311 80 77 20
At 18- 59 months 195 50 31 8 226 58 162 42
Table 3: Social-demographic factors associated with utilization of immunization (n=388).
Demographics n % P value
Gender
Non-responses 36 9.3
0.001
Male 44 11.3
Female 308 79.4
Age (years)
10–20 81 20.9
0.003
20–30 174 44.9
30–40 82 21.2
Over 40 51 13.1
Occupation
Employed 74 19.1
0.001
Self–employed 146 37.6
Not –employed 160 41.2
Others student* 8 2.1
Income level (Kshs)
0–2000 171 44.1
0.002
2001–4000 70 18
4001–6000 99 25.7
6001–8000 45 11.7
8001–10, 000 3 0.8
Religion
Christian 361 93
0.707
Muslim 19 4.9
Others 8 2.1
Educational level
None 21 5.4
0.001
Primary 161 41.8
Secondary 169 43.6
College 25 6.6
University 12 3.1
Social-demographic factors associated with utilization of immunization services
Various socio-demographic factors were subjected to a chi-square analysis test to determine whether they significantly affected the decision by respondents to utilize immunization services. Gender, (X2=68.093 p=0.001-<0.05), age (X2=212.920, p=0.002-<0.05), profession (X2=423.442, p=0.001-<0.05), and income (X2=233.410, p=0.003-<0.05) were statistically significant. Religion however was not statistically significant (Table 3).
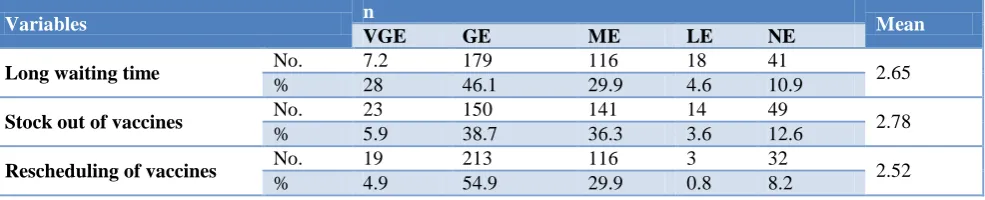
Health Service factors facilitating utilization of immunization services
Health service factors were identified as some of the possible reasons facilitating the decision by parents and guardians to utilize immunization services. The respondents were provided with a variety of statements on a Likert scale where they were given five choices to select from; 1=very great effect, 2=great effect, 3=moderate effect, 4=low effect and 5=no effect. The response mean average of 2.79 implies that majority of the responses were skewed towards great effect (Table 4).
Chi-square analysis was also done to show the association between the identified factors and immunization utilization. Long waiting time (X2=352.709, p=0.001-<0.05), Vaccines out of stock (X2=233.147, p=0.002-<0.05), rescheduling of vaccines (X2=206.867, p=0.001-<0.05), and rescheduling of return dates (X2=199.964, p=0.001-<0.05) were statistically significant. Distance to the health facility was however not significant.
Table 4: Health service factors facilitating utilization of immunization services(n=388).
Variables n Mean
VGE GE ME LE NE
Long waiting time No. 7.2 179 116 18 41 2.65
% 28 46.1 29.9 4.6 10.9
Stock out of vaccines No. 23 150 141 14 49 2.78
% 5.9 38.7 36.3 3.6 12.6
Rescheduling of vaccines No. 19 213 116 3 32 2.52
Variables n Mean
VGE GE ME LE NE
Return date No. 38 186 116 7 30 2.48
% 9.8 47.9 29.9 1.8 7.7
Distance to health facility No. 34 62 55 133 98 3.52
% 8.8 16 14.2 34.3 25.3
Average 7.32 40.72 28.04 9.02 12.9 2.79
Other factors identified that hindered immunization utilization
Myths and misconception, Immunization side effects, parity and lack of information on immunization were identified as other factors hindering immunization utilization at the county.
DISCUSSION
The study findings revealed that utilization of immunization services for children aged under five for measles 2 is low at 58% which is below the recommended target by WHO of 85%. These findings concur with those of Canavan et al whose findings revealed that majority children had not received all vaccine doses recommended by WHO meaning that not all those children who were started on BCG completed schedules.9
Immunization uptake revealed high utilization of initial antigens which are BCG and birth polio given at birth and first pentavalent, polio, rotavarix and pneumococcal vaccines given at 6 weeks while the utilization of subsequent antigens given at 10 weeks, 14 weeks, 9 months and 18 months shows a significant decline. This compares well with a study done in a peri-urban area in Kenya which revealed that utilization of first antigens was high followed by a declining trend in subsequent visits.10
Social demographic factors were significant in influencing the utilization of the immunization services by the mothers or caregivers. This included; age, gender, profession and level of income. these findings are supported by several studies that revealed the caregivers or mothers age, level of income, parity, profession or employment, expenditures, educational background, and the number of children a mother had, influenced utilization of immunization.11-15
Health system factors were also identified as major barriers to immunization utilizations at the health facilities in the county. The factors include long ques and waiting time, vaccines out of stock and rescheduling of vaccination and clinic return dates. This concurs with a study done by Favina et al who noted that stock out of vaccines lead to missed opportunities and long waiting hours without being served forced mothers/caregivers not to return their children for successive vaccinations.16
Other factors identified were vaccine side effect which concurs with a study done in India which revealed that immunization coverage was low due to fear of vaccine side effects.17 The study also revealed that myths and misconceptions affected utilization of immunization services. These findings are similar to a study conducted in Pakistan which revealed myths and misconceptions as significant factors in utilization of immunization services.18 Noteworthy, is that the study identified that birth order did not influence the respondents‟ choice to utilize immunization services and these findings differed from a study conducted by Samra et al which revealed that first born children in Bangladesh are given priority.19
CONCLUSION
The study concludes that the level of utilization of immunization services for performance antigens was low below the recommended target by WHO in Kirinyaga County, Kenya. Social demographic factors that facilitate utilization of immunization services are high level of education, while formal employment, income levels, and age are barriers to immunization utilization. The health system factors that are barriers to immunization services are; long waiting time, stock out of vaccines rescheduling of vaccines, lack of information and return dates. Other factors identified as barriers include myths and misconceptions, vaccine side effects, parity, and lack of information.
Delaying or refusing some or all the immunizations puts a child‟s life and health at risk of contracting vaccine preventable diseases. The county health management team should therefore ensure health workers give health education to the community emphasizing on benefits of immunization and the need to adhere and complete the national child immunization schedule. It should also intensify door to door campaign strategies to trace and vaccinate defaulters of immunization. The county government of health should employ adequate health workers to address the issue of long waiting time, as well as purchase and stock all the health facilities with adequate vaccines to eliminate concerns about stock outs of vaccines that leads to rescheduling of vaccines and return dates.
ACKNOWLEDGEMENTS
gratitude goes to the parents/caregivers in Kirinyaga County who participated in this study. Special gratitude goes to the county director of health and county commissioner Kirinyaga County for allowing us to conduct the study in the community.
Funding: No funding sources Conflict of interest: None declared
Ethical approval: The study was approved by the Institutional Ethics Committee
REFERENCES
1. WHO and UNICEF. Levels and Trends in Child Mortality, (2014). Available at: https://www.who. int/maternal_child_adolescent/documents/levels_tre nds_child_mortality_2014/en/. Accessed on 19 November 2018.
2. Etana BW. Deresa W. Factors Associated With Complete Immunization Coverage of children aged 12-24 months in Ambo Woeda. Central Ethiopia: BioMed Central ltd; 2012.
3. Kenya Expanded Programme on Immunization. National policy guidelines on immunisation, (2013). Available at: https://www.medbox.org/kenya/kenya-national-policy-guidelines-on-immunization-2013/ preview. Accessed on 19 November 2018.
4. World Health Organization. “WHO
Recommendations for routine Immunization”, (2013). Available at: https://www.who.int/ immunization/policy/immunization_tables/en/. Accessed on 19 November 2018.
5. Hill HA, Elam-Evans LD, Yankey D, Singleton JA, Kang Y. National immunisation survey-children (19-35 months). Morbidity Mortality Weekly Report. 2018;67(40);1123–8.
6. Center for Disease Control (CDC). Under five Mortality Rates In Kenya, (2015). Available at: https://www.cdc.gov/globalhealth/countries/kenya/d efault.htm. Accessed on 19 November 2018. 7. Koskei A, Tabu S, Malalu P. Immunisation services
of children under five years old in Kalichemba divsion, Pokot county, Kenya. Sci J Public Health. 2014;2(6):617-23.
8. County Health Information System (CHIS) (2014); Health Sector Strategic and Investment Plan, Kirinyaga County.
9. Canavan M, Sipsma H, Kassie G, Bradley E. Correlates of complete childhood vaccination in
East African countries. PLoS One.
2014;9(4):e95709.
10. Karanja S, Kombich J. Immunization coverage and its determinants among 12-23 months in a Peri-Urban area of Kenya. Pan Afr Med J. 2013;14:3. 11. Abdi M, Feleke A,Worku W, Kifle M, Sharma R.
Immunisation coverage of 12- 24 months old children and associated factors in the uran and rural areas of Jigiga District. MC Public Health. 2014;14:865.
12. Sembuche S. Uptake of vaccination services and associated factors among under five, Banada District Shinyange region Tanzania. 2010.
13. Mutua M, Kimani M, Remare E. Childhood Vaccination in Informal Urban Settlements in Nairobi, Kenya. BMC Public Health. 2011;11:6. 14. Onsuma O, Abuya A, okech N Moore D, Collins J.
Maternal Education and Immunization Status Among Children in Kenya. Matern Child Health J. 2015;1-10.
15. Onyango D, Kikuvi G, Amukoya E, Omolo J. Risk factors of severe pneumonia among children aged 2-59 months in western Kenya. Pan Afr Med J. 2012;13:45.
16. Favina M, Steinglass R, Fields R, Kauhik B, Monica S. Why children are not vaccinated: Review of the grey literature international health. Int Health. 2012;4(4):229-38.
17. Gupta P, Prakash D, Srivastava P. Determinants of immunisation coverage in Locknow District. N Am J Med Sci. 2015;7(2):36–40.
18. Roberts J, Hsiao P, Reich R. Trends revealing local barriers, myths and misconceptions in Pakistan. 2010.
19. Samra S, Anwar S, Khan A, Jeelani G. Impact of Mother‟s Employment on Child vaccination, A Case Study of Bangladesh. J Finance Economics. 2015;3(4):64-6.