Modelling the acceptance and use of electronic
learning at the University of Zululand
Neil Davies Evans
1and Jerry le Roux
2[email protected] ORCID: orcid.org/0000-0001-9723-0168
[email protected] ORCID: orcid.org/0000-0002-5852-1082
Received: 26 October 2015 Accepted: 26 January 2016
We present a new and compelling method to help understand some of the important needs, perceptions and expectations of users of existing electronic learning (e-learning) resources at the University of Zululand by contextualising the pedagogic place in this blended tertiary learning environment of e-learning resources and confirming their acceptance by both academic staff and students. Predicting their acceptance was achieved conceptually by adopting the Unified Theory of Acceptance and Use of Technology (UTAUT) model and statistically validating its application to predict the behavioural intentions and usage behaviour of the primary users towards e-learning using a positivist epistemological belief and deductive reasoning. This paper also embraces an interpretive research paradigm to include the researchers’ views on the topic. Partial Least Squares structural equation modelling and inferential statistics predicted the level of acceptance of e-learning by academic staff (adjusted R2 = 0.41) and students (adjusted R2 = 0.39) and illustrated the strengths and significances of the postulated UTAUT relationships and their moderating effects. Academic performance gains proved to be the strongest significant influence on both sets of primary users’ intentions to use e-learning. Although the results may not be generalised to other institutions, they do contribute to UTAUT’s theoretical validity and empirical applicability to the management of e-learning-based initiatives. We argue that the high predictive accuracies found in Venkatesh et al. (2003) could be obtained if significant moderators contextualised to the education sector were added to the structural equation model, although cognisance of maintaining a parsimonious structural equation model should also be taken into consideration before inflating the coefficient of determination (R2), which is a measure of how well a data set fits a statistical model (in this case UTAUT). A R2 value of 1 indicates a perfect fit – with the observed outcomes being replicated in the model – while a R2
value of 0 indicates that the data set does not fit the model at all. R2 values closer to 1 allow more predictable future outcomes, which in this study was the acceptance of existing e-learning resources by the primary users.
Keywords: E-learning, Unified Theory of Acceptance and Use of Technology, UTAUT, Partial Least Squares structural equation modelling, PLS-SEM, University of Zululand, South Africa
1 Introduction and background
Since the beginning of the twenty-first century, the abundant use of various technologies connected to digital networks has changed the way information, especially multimedia information, is accessed, stored and disseminated (Agyei 2007: 5; E-learning Africa 2013: 10; Mansell and Tremblay 2013: iii). Users today essentially want information delivered to them (Sturges 2006). This need is particularly pertinent to institutions of higher education that constantly have to evaluate instructional policies and technical frameworks to accommodate new pedagogies and educational technologies that are required by a rapidly-growing generation of students with different learning styles and different needs (Siemens 2004). The growing use of information and communication technologies (ICTs) and information systems (IS) for teaching and learning has given rise to new pedagogies, for example connectivism, where Siemens (2004) purported that language, technology and media act as conduits of information, promoting greater participation, collaboration and interaction among networked learners who socially construct an active learning experience within different learning networks (Siemens 2004a in Evans 2013).
E-learning Africa (2012), which surveyed electronic learning (e-learning) experiences from African countries, confirmed that, for 42% of respondents, the principal motivating factor for using ICT-enhanced teaching and learning was to improve the quality of their teaching and learning. An equal proportion of respondents (18% each) stated that the biggest motivations were developing twenty-first century skills and improving access to education in remote areas, respectively. Lastly, 12% of respondents were motivated by the promotion of creativity and critical thinking (E-learning Africa 2012: 16). For the majority of survey respondents of the 2013 report, laptops (83%) and mobile phones (71%) were the most popular learning devices compared to tablets, virtual desktops and smartboards. 67% of respondents still used stand-alone computers, 34% still used televisions and 31% used radios for learning (E-learning Africa, 2013: 9).
Backhouse (2013: 256) concluded that the use of emerging technologies in South African universities is principally motivated by pedagogic advantages to teach more effectively rather than pragmatic reasons of limited resources.
E-learning has occurred at most South African universities since the late 1990s (Ravjee 2007: 27), however Zinn (2009: 159) noted that caution and inadequate rewards for innovative teaching methods have slowed the acceptance and uptake by academics. In 2008, the University of Zululand participated in a developmental study towards effective practices in technology-assisted learning (TAL) by the University of Johannesburg (UJ) in collaboration with Edge Hill University (United Kingdom). Fifteen institutions, including the University of Zululand, accepted the invitation to participate. The workshop provided some valuable insight into TAL benchmarks. It emerged that the University of Zululand was significantly behind other institutions, such as Stellenbosch University and UJ, in the twelve lenses of review (Boere and Kruger 2008). In the self-evaluation part of the workshop, e-learning challenges that were noted at the University of Zululand included:
poor computer literacy among some academic staff and a low desktop computer-to-student ratio;
a general reference to the use of technologies in the University of Zululand’s Teaching and Learning Policy (2004: 2) but no specific policy that refers to or promotes e-learning;
no specific quality management processes to emphasise and enhance e-learning;
limited incentives and initiatives for the professional development of staff to integrate e-learning within the existing traditional curricula;
few structures in place for technical and system support and for working with pre-determined digital standards; and
few contributions from leadership and change managers, hence relying on a bottom-up approach in its implementation and support.
A number of institutions seem to have set the benchmark and made full use of technologies in their teaching and learning. These include Stellenbosch University, the University of Cape Town (UCT), UJ, the University of the Free State (UFS) and UNISA, all of which are reported on in more detail below.
Stellenbosch University defines e-learning as using ICTs to add value to the teaching and learning process. The institution has always followed a blended approach where it strives not to distinguish between “learning with technology” and “learning without technology” but rather aims to attain the optimal blend of face-to-face and e-learning activities to achieve the outcomes of a specific module or programme. Applications which were previously dedicated to e-learning, such as the Learning Management System (LMS) and the satellite-based Interactive Telematic Education system, are still mostly used in teaching and learning, but are also increasingly used in community outreach and research. These are just two examples of the many e-learning applications in the so-called “technology basket” available to academic staff and students to support them, not only in their teaching and learning, but also in research and community outreach (Boere and Kruger 2008: 8).
UCT’s position regarding educational technology is contained in these seven points (Boere and Kruger 2008: 12):
1. UCT encourages and is committed to enabling the innovative and effective use of ICTs for teaching and learning in UCT courses and programmes.
2. UCT believes that the use of ICTs for teaching and learning must be driven by sound pedagogical principles and the needs of the institution's students and staff, facilitated by technological advances.
3. UCT supports an integrative approach to the use of ICTs
4. UCT is committed to the provision of an appropriate ICT infrastructure and technical support to enable effective implementation of the intentions expressed in this document.
5. UCT expects priorities regarding educational technology to be determined at faculty level.
6. UCT recognises and wishes to exploit the synergies between teaching-and-learning and research with regard to ICTs. As a research-led institution, UCT is also committed to ongoing research in the emerging field of educational technology.
7. UCT acknowledges that the changing terrain requires increased flexibility of course provision, and that ICTs can be used to support this flexibility.
The focus of UJ’s Centre for Technology Assisted Learning (CenTAL) is to make the integrated approach to TAL, teaching and assessment a reality in the learning experiences of all students, and on all campuses. The university’s integrated approach is based on the use of different modes of delivery – learning guides, interactive DVDs and web learning environments – including educational technologies, and aims to promote their use in an integrated manner to enhance student learning experiences (Boere and Kruger 2008: 13).
broadcasting and online teaching and learning using UNISA’s Virtual Learning Environment (VLE) called myUnisa3
(Boere and Kruger 2008: 20).
In 2006, UFS accepted blended learning as a teaching and learning strategy for all their academic programme offerings. The blended model included offering courses on a face-to-face basis, as well as on an online basis. UFS used a variety of delivery methods and strategies, such as engaged learning, collaborative learning, experience-based learning, problem-based learning, reflective learning, community service learning, resource-based learning, e-learning, group work, and directed self-study, which they intended to help with lifelong learning (UFS in Boere and Kruger 2008: 23).
For the purposes of Evans’ (2013) study, e-learning was broadly defined as the use of ICTs and IS in formalised teaching and learning. At the University of Zululand, e-learning occurs within a blended learning environment where traditional face-to-face teaching and learning is combined with e-learning, experiential learning, research, and community engagement. E-learning resources can specifically include office and classroom ICT and IS, portable presentation tools for lectures, research databases and institutional repositories, and the LMS (a software application for the administration, documentation, tracking, reporting and delivery of e-learning activities and resources) which can be accessed through the wired or wireless network services available to both staff and students. A number of e-learning projects have been initiated on the main campus since 2000, ranging from ‘virtual classrooms’ to the actual deployment of various LMSs, including WebCT (now called Blackboard) in 2000, MyCMT, which was developed in-house by the Department of Accounting and Auditing in 2002, and Moodle (Modular Object-Orientated Dynamic Learning Environment), introduced by Evans and piloted in the Department of Information Studies. Moodle was officially adopted as the preferred LMS on campus in 2009, with one instance installed for each of the four faculties.
In 2009, the e-learning task team at the University of Zululand developed a strategy and implementation plan which recommended a two-phase implementation approach for e-learning (Muller and Evans 2009). The first phase included a requirements analysis for academic staff, students and other stakeholders to determine their e-learning needs and expectations. The second phase involved creating the necessary organisational changes to facilitate, support and roll out e-learning on campus. Later in 2009, the e-learning implementation strategy and plan was presented to all four faculty boards and Senate; all bodies unanimously adopted it. Over the next two years, no support was received by the university to implement the plan. However, in 2012, the document, together with a budget proposal, was submitted, via the Academic Development Unit, to the Department of Higher Education and Training, requesting funding through the Teaching Development Grant (TDG). The theme, ‘Creating a Sound Teaching Environment through E-learning’, was allocated R5.6 million out of a total TDG of R15.2 million for the period 2012 to 2013 (University of Zululand 2013).
According to the Council on Higher Education (2014: i) higher education has an important role to play in contributing to the reconstruction and development of all aspects of South African society. In any education system, the quality of the academic staff profoundly affects the quality of student learning. In addition to disciplinary expertise, academics need skills in pedagogy, curriculum development, assessment and moderation, as well as other skills and attributes such as digital literacy. There are often limited opportunities and incentives for academic staff to acquire such skills. On the contrary, the university reward and promotion criteria often act as disincentives for academics to put time into developing teaching skills, since research output is often the main criterion for recognition, promotion and financial rewards.
Dillon and Morris (1996) defined user acceptance as “the demonstrable willingness within a user group to employ information technology for the tasks it is designed to support”. Dillon (2001) believes that by developing and testing models of the variables influencing user acceptance, researchers seek to provide direction to the process of design and implementation in a manner that will minimise the risk of disapproval by users of these resources.
With the renewed impetus in 2014 to enhance all aspects of teaching and learning though the Quality Enhancement Project and to improve student success by integrating e-learning resources into teaching and learning methods at the university, this paper attempts to analyse some of the relationships that influence the primary users’ (academic staff and students) acceptance of these resources, a prerequisite for the successful planning, implementation and support of e-learning.
2 Theoretical framework
A learning theory like connectivism (Siemens 2004) provides insight into a learning ecology for the digital era, where the skills required to work in the knowledge economies of today are built through forming connections within expert communities using language, media and technology (as conduits of information) and ethics, beliefs and perspectives (as filters of information). Creating a blended learning network at the University of Zululand varies among different faculties, departments and academic staff but could include face-to-face, experiential learning (where students volunteer for work experience during their holidays), research – which is an essential component of any academic programme, community outreach, e-learning, self-learning, and informal learning.
Based on the assumption that actions are guided by emotions (Hayes 2013: 24), it has been shown that users’ initial reactions or attitudes towards ICT and IS technologies affect their intentions to use the technologies, which in turn will influence their actual use of such technologies (Venkatesh et al. 2003: 427; Davis, Bagozzi, and Warshaw, 1989:982).
According to Evans (2013: 56), predicting the acceptance of e-learning requires a review of psychology-based theories, which include the original Theory of Reasoned Action (TRA) by Fishbein and Ajzen (1975, 1980) (Dillon and
Morris 1996; Ajzen 2008); the Technology Acceptance Model (TAM) by Davis, Bagozzi, and Warshaw (Dillon and Morris, 1996; Dillon 2001) and the Theory of Planned Behaviour (TPB) by Ajzen (1985, 1991) (Ajzen 2008) and others which are essentially modifications of the three above-mentioned models.
Ventakesh et al. (2003: 425) empirically compared eight models to formulate the Unified Theory of Acceptance and Use of Technology (UTAUT) model which incorporated all validated relationships across all models as well as a selected subset of additional moderators. The UTAUT model thus condensed the thirty-two variables found in the eight existing models into four main effects and four moderating factors (Ventakesh et al. 2003: 467). The UTAUT model proposes that four constructs, namely, performance expectancy (PE), effort expectancy (EE), social influence (SI) and facilitating conditions (FC), are significant determinants on the two dependent variables – behavioural intentions (BI) and use behaviour (UB) – and, hence, of user acceptance of ICT innovations (Venkatesh et al. 2003) (see Figure 1). These constructs are moderated, by varying degrees, by gender, age, experience, and voluntary or compulsory use. For the sake of parsimony, the moderation of voluntariness of use on the social influence to use e-learning was not postulated in this study as the use of e-learning at the University of Zululand can be seen as both compulsory (structured lectures) and voluntary (using resources afterhours).
By applying a user acceptance model, criteria that contribute to the primary users’ reactions, their intentions to use, and their actual use of existing e-learning resources can be measured, thus enabling the study to predict their acceptance. While the UTAUT model’s ability to predict student and academic staff’s behavioural intentions to accept e-learning at the university was empirically validated by Evans (2013) using a strictly positivist epistemological belief and deductive reasoning, this paper attempts also to interpret the level of acceptance, behavioural intentions and usage behaviour of academic staff towards e-learning by inductive reasoning and the use of constructivism or interpretivism, which recognises the important role of the observer and society in constructing the patterns we study (Moses and Knutsen 2012: 9).
Figure 1 The Unified Theory of Acceptance and Use of Technology model (UTAUT)
Source Venkatesh et al. (2003: 445)
Taiwo and Downe (2013:48) report that the objective of their study was to investigate the validity of UTAUT and reveal how much this validity is substantiated in present literature. They provided a meta-analysis of thirty-seven empirical studies that made use of the UTAUT model, highlighting those that validated the model and those that found differences. They concluded that the inconsistency in the results of the above-mentioned studies on UTAUT left the output of the relationships in the model in question; however, on the basis of the meta-analysis study, their findings confirmed the initial findings of Venkatesh et al. (2003) between the five constructs of the UTAUT model. Only the relationship between performance expectancy and behavioural intention was found to be strong; others, although weak, were still significant.
3 Problem statement
acceptance and use of these resources by students and academic staff to help identify, interpret and support relationships that are important to facilitate this development and encourage, firstly, that users take ownership and use the resources, secondly, that the resources serve their intended purpose and, lastly, that the resources give a good return on investment.
4 Research questions
The main research question was whether academic staff and students accept existing e-learning resources at the University of Zululand. The secondary research questions were as follows:
1. Can the UTAUT model be used to reasonably predict the acceptance of e-learning by students and academic staff at the university?
2. How will the constructs and their moderating variables in the UTAUT model impact on the acceptance of e-learning, with special reference to their specific influence on student and academic staff’s behavioural intention to use, and their use of, e-learning at the university?
3. How strong is the adopted user acceptance model’s theoretical validity and practical applicability?
5 Methodology and data collection
A non-experimental statistical method was used to analyse the quantitative data from both primary user groups. Descriptive statistics were used to report on the biographical data, whereas inferential statistics were used to predict the level of acceptance of e-learning by students and academic staff. The two target populations of students and academic staff represented the primary users of e-learning resources at the university. Static probability sampling of the primary users made use of Probability Proportionate to Size (PPS) and Equal Probability Selection Methods (EPSEM) to select students randomly and proportionally, stratified according to their faculty and academic year. Academic staff were stratified according to their positions, from their respective sample frames.
The survey of students and academic staff was conducted using three self-administered questionnaires. Two online questionnaires (one for students and one for academic staff) and an additional multi-mode paper version (for academic staff) were used as instruments to measure the biographic and indicator statements of the key UTAUT relationships of both target populations. The survey questions were mapped to constructs of the UTAUT model to measure the four independent variables or determinants (PE, EE, SI and FC) and their moderating effects (gender, age and experience in using e-learning), together with the two dependent variables, BI and UB4. Survey participants were asked to respond to each indicator statement using a five-item Likert scale, with 1 representing strong disagreement and 5 being strong agreement with the statement.
The main objective of factor analysis is to describe the relationship between a large number of measured traits and a small number of unobserved factors. According to Hair et al. (2010: 94), factor analysis is an interdependence technique used to define the underlying structure among variables in the analysis, which are the building blocks of relationships. The authors recommend that the sample size not be less than fifty but preferably be 100 or larger. Hair et al. (2010: 10), however, caution against samples that are too large because at any given alpha (α) level, increasing the sample size always produces greater power for the statistical test; by having a very large sample size, smaller and smaller effects become statistically significant. Although a minimal sample size can give results, Urbach and Ahlemann (2010: 17) warn that the situation can be more complicated. Small sample sizes (for example, n = 20) do not allow the discovery or validation of structural paths with small coefficients (Chin and Newsted 1999 in Urbach and Ahlemann 2010). In such cases, sample sizes are required that are similar to those necessary for covariance-based approaches: samples should be greater than 150. This study thus recognised the possible limitations of the minimum sample sizes (insensitive) and relatively large sample sizes (overly sensitive) (Hair et al. 2010: 10) and thus aimed to obtain the minimum recommended sample size from 150 academic staff and 300 students to provide a statistically strong sample size with the correct balance of power.
Once all responses from the primary users had been captured, data were imported into a statistical software program for the statistical analysis. PLS regression was the statistical data analysis method used to process the results and was made possible through the use of specialised statistical software, SmartPLS.
After data quality was evaluated and outliers and spoilt responses discarded, the PLS regression algorithm was run to calculate the UTAUT model parameter’s estimates for each target population. Statistical output was analysed according to recommendations for model validation by Urbach and Ahlemann (2010: 18). The analysis represents the process of systematically evaluating whether the hypotheses expressed by the structural model are supported by the data or not. Urbach and Ahlemann (2010: 18) state that, although PLS does not provide an established global goodness-of-fit criterion, there are several criteria for assessing partial model structures, a systematic application of which was carried out in a two-step process: firstly, the assessment of the measurement models that included internal consistency reliability, indicator reliability, convergent validity and discriminant validity and, secondly, the assessment of the structural model, including its validity and predictive relevance (Urbach and Ahlemann 2010: 18). This paper refers readers to Evans’ (2013) study for all the statistics. Both SmartPLS (Ringle, W ende & Will 2004) and PROCESS – designed by Hayes
(2013), and installed as an add-on in the regression tools of IBM SPSS Statistics – were used to analyse the hypothesised moderating effects of the UTAUT model.
Evans (2013) administered a pilot survey to a sample of staff and postgraduate students to evaluate the survey instrument and to obtain feedback on its quality. After the pilot survey, three UB indicators were added to allow the self-measure of use behaviour towards e-learning by participants, one indicator statement with low loadings for EE was removed, and three SI indicator statements were removed and replaced to improve content validity of the survey (Evans 2013: 104).
6 Statistical analysis and findings
The total available participant pool included 692 students, who were enrolled in ten academic modules that were randomly selected (probability proportionate to size) from the university’s four faculties. The student population was selected using cluster sampling according to the faculty and stratification according to the academic level of the randomly selected modules. Lecturers whose modules were selected for the survey were contacted in advance and permission was sought to administer the survey to their students during scheduled class time. All surveys were administered in this manner, except for one hydrology module, whose class was not being held in the computer laboratories during the time of the survey. In this case, a link to the survey was posted on their Moodle LMS module, and messages sent to all enrolled students asking for their participation. The student survey was open for a week; a total of 511 responses were captured on the hosting website, ninety of which were incomplete and so discarded. This left a sample size of 421, which equals a response rate of 59%. Responses were then filtered for those who had four or more non-random missing answers for the construct and moderator-related questions on the second page of the questionnaire. The result was sixteen more cases being removed from the sample, thus leaving a final student sample size of 405.
The academic staff survey was open for three weeks. From the 310 academic staff listed in the institution’s email address book and stratified according to their positions (contract lecturers, junior lecturers, lecturers, senior lecturers, associate professors and professors), 150 were selected using simple random sampling (with replacement) and PPS formula. Four tracked emails and a paper questionnaire – placed in postboxes of staff who had not responded after the second email – elicited a total of ninety-eight online submissions and five paper questionnaires, giving a total of 103 responses. One of the paper questionnaires was blank; the remaining four paper questionnaires’ data were captured manually onto the hosting website’s database. There were twenty-seven incomplete responses that were excluded from the academic staff sample, leaving a total of seventy-five participants. After delivering the paper questionnaires to the postal services, it was discovered that four staff members had left the institution, one had retired and another had died, leaving a total possible participant pool of 144 and a response rate of 52%. Responses were then filtered for those who had four or more non-random missing answers for the construct and moderator-related questions on the second page of the questionnaire. Two more cases were removed, leaving a final academic staff sample size of seventy-three.
The majority of the student respondents were females (245; 61%), with the minority being males (160; 39.5%). Most student respondents were 18-23 years old (70.1%), followed by the age categories 24-29 (23%) and 30-35 (6%). The average age of the student participants was 23, with a standard deviation of almost four years. The academic level of the student sample showed the majority were in their first year (200; 49%), followed by second year (96; 23.7%), third year (79; 20%) and fourth year (29; 7%); one post-graduate student featured in the survey. The great majority (98%) of the students were South African, while 2% were from other African countries.
The academic staff sample consisted of fewer females (29; 40%) than males (44; 60%) and the average age of the staff who participated was 45, with a standard deviation of ten years. The representation of academic staff was from all four faculties including: Arts (28; 38%), Science and Agriculture (25; 35%), Commerce, Administration and Law (10; 14%) and Education (10; 14%). The stratification of academic staff according to their position showed that the majority were lecturers (45; 62%), followed by senior lecturers (10; 14%), junior lecturers (8; 11%), associate professors (6; 8%), professors (3; 4%) and one other (1; 1%). The majority (84%) of the staff who participated were South African nationals, while 16% were from other countries.
Brown (2011: 13) explains that Likert items and Likert scales (made up of multiple items) are reported in different ways and that Likert items, whether nominal, ordinal or interval, are irrelevant when using Likert scale data, which can be taken to be interval. This paper provides only a summary of findings later in the discussion and refers readers to the full study (Evans 2013) for detailed ordinal and interval scale statistics for the individual indicator statements used to measure the various latent variables in the structural equation model (SEM). Evans’ (2013) study took cognisance of the warning of Hair et al. (2014: 8) that it was not appropriate to calculate arithmetic means or variance for ordinal data because the researcher cannot assume that the differences in order are equally spaced. However, with a well-structured Likert scale with appropriate categories (1 = strongly disagree, 2 = disagree, 3 = neutral, 4 = agree and 5 = strongly agree), the inference is that the “distance” between categories 1 and 2 is the same as between 3 and 4, for example (Hair et al. 2014: 8).
6.1 Measurement models
Students
The PLS-SEM algorithm converged in six iterations in the first PLS algorithm run for students, and five in the last, showing that the algorithm could find a stable solution in one fewer iteration after the unreliable indicators were removed from the student measurement model. Both student and staff reflective measurement models were validated by following the guidelines suggested by Straub et al. (2004) and Lewis et al. (2005) in Urbach and Ahlemann (2010: 18), Hair, Ringle and Sarstedt (2011) and Hair et al. (2014). To start the approximations for the relationships between the reflective latent variables and their indicators, the indicators’ outer loadings were investigated. Statistics led to the removal of unreliable indicator items. All these items were below the recommended loading value of 0.7 and, because they do not adequately explain their associated latent variables, were considered unreliable for the student data analysis. A weaker behavioural intention indicator below this value (0.64) was, however, retained for content validity as exemplified by Hair, Ringle and Sarstedt (2011: 146). In statistics, bootstrapping can refer to any test that relies on random sampling with replacement. The significance of the indicator loadings was also tested using the resampling method of bootstrapping (Efron 1979; Efron and Tibshirani 1993 both in Urbach and Ahlemann 2010: 18) and all proved significant.
The discriminant validity assessment aims to ensure that a reflective construct has the strongest relationships with its own indicators in comparison to than any other construct in the PLS model (Hair et al. 2014). The Fornell-Larcker criterion showed evidence of discriminant validity between each reflective construct and their remaining reliable indicators. The average variance extracted (AVE) of each latent variable (LV) should be greater than the LV’s highest squared correlation with any other LV, which is the same as comparing the correlation with the square root of the AVE.
Academic staff
The PLS-SEM algorithm converged in six iterations in both the first PLS algorithm run and the last, showing that the algorithm could find a stable solution relatively easily for academic staff. Statistics led to the removal of the unreliable indicator items in the academic staff’s reflective outer measurement model. The significance of the indicator loadings was also tested using the resampling method of bootstrapping (Efron 1979; Efron and Tibshirani 1993 both in Urbach and Ahlemann 2010: 18) and all remaining reliable indicators proved significant.
The Fornell-Larcker criterion showed evidence of discriminant validity between each reflective construct and its remaining reliable indicators.
6.2 Structural models
The assessment of the structural model included its validity and predictive relevance.
Students
The first step in assessing the students’ PLS-SEM structural model was to run the collinearity assessments for the two sets of predictor constructs (Hair et al. 2014: 168) (BI and FC for Use and PE, EE and SI for BI), which were run in IBM SPSS Statistics and showed no unwanted collinearity. Variance inflation factor (VIF) values above 5 and tolerance values below 0.2 are indicative of unwanted collinearity (Hair et al. 2014: 170).
The second step in assessing the PLS-SEM structural model was to examine the path coefficients after running the PLS-SEM algorithm, as these represented the postulated relationships between the independent and dependent constructs (Hair et al., 2014: 170). The significance of the path coefficients depends on their standard error, which was obtained by bootstrapping in SmartPLS (Hair et al. 2014: 171). For the student sample (n = 405), the empirical t value has to be larger than the critical t value (1.96) at a significance level of 5%; the p value should therefore be less than 0.05 for the hypothesised relationships to be significant.
The significance of the total effects, including the direct (PE, EE, SI on BI and BI and FC on Use), and indirect (PE, EE and SI on Use) effects, was obtained by bootstrapping in SmartPLS and is summarised in Table 1.
Table 1 Significance testing of the total effects for the structural model of students
Total effect t value Significance
level p value
95% Confidence intervals
LLCI ULCI
BI -> USE 0.22 4.50 *** 0.00 0.13 0.32
EE -> BI 0.31 4.35 *** 0.00 0.16 0.42
EE -> USE 0.07 3.01 *** 0.00 0.02 0.11
FC -> USE 0.27 5.86 *** 0.00 0.17 0.34
PE -> BI 0.34 5.77 *** 0.00 0.24 0.48
PE -> USE 0.07 3.33 *** 0.00 0.03 0.13
SI -> BI 0.11 2.07 ** 0.05 0.00 0.19
SI -> USE 0.02 1.88 NS 0.07 0.00 0.04
The coefficient of determination is the square of the correlation (R) between predicted scores and actual scores; thus, it ranges from 0 to 1. The coefficient of determination (R2) is a measure of the model’s predictive accuracy (Hair et al. 2014: 174). Hair et al. (2014: 175) warn that problems can arise if the R2 value is used to compare models that are specified differently, that is, having the same endogenous constructs but adding additional non-significant exogenous constructs that are correlated with the endogenous LV, as this causes the R2 values to be inflated. Therefore, in models like UTAUT, Hair et al. (2014: 176) recommend using the adjusted R2 value (R2adj), as represented in the formula below,
as the criterion to avoid bias toward complex models.
R2adj = 1 – (1 – R 2
). n – 1 n – k – 1
where n = sample size and k = the number of exogenous LVs.
R2, R2adj andStone-Geisser’s (Q
2) values, which indicate the model’s predictive relevance (Hair et al. 2014: 178), can
be seen in Table 2.
Table 2 Endogenous LVs’ R2
, R2adj and Q
2 values for the students’ structural model
R square Adjusted
R square Q square
BI 0.40 0.39 0.22
EE
FC
PE
SI
USE 0.16 0.16 0.11
In addition, the endogenous latent variables’ R2
values, the change in their R2 value (when a selected exogenous latent variable is included or excluded in the model), was estimated by running the PLS-SEM algorithm twice to calculate the f2 effect sizes (Hair et al. 2014: 177), which can be seen in Evans’ (2013) full study.
Similar to the f2 effect sizes approach to assessing R2 values, the relative impact of predictive relevance of the exogenous latent variables explaining endogenous ones can be compared by the measure of the q2 effect size (Hair et al 2014: 183), which can also be seen in Evans’ (2013) full study.
Academic staff
The collinearity assessments (Hair et al. 2014: 168) for the two sets of predictor constructs (BI and FC for Use and PE, EE and SI for BI) of academic staff, which were run in IBM SPSS Statistics, showed no unwanted collinearity.
When analysing path coefficients representing the hypothesised relationships between the independent and dependent constructs for the academic staff sample (n = 73), the empirical t value had to be larger than the critical t value (1.99) at a significance level of 5%; the p value should be less than 0.05 for the hypothesised relationships to be significant. The significance testing of the total effects include the direct (PE, EE, SI on BI and BI and FC on Use) and indirect (PE, EE and SI on Use) effects as shown in Table 3, obtained by bootstrapping.
Table 3 Significance testing of the total effects coefficients for the structural model of academic staff
Total effect t value Significance
level p value
95% Confidence intervals
LLCI ULCI
BI -> USE 0.42 3.46 *** 0.00 0.19 0.70
EE -> BI 0.14 1.37 NS 0.16 -0.07 0.40
EE -> USE 0.06 1.35 NS 0.16 -0.03 0.18
FC -> USE 0.22 2.09 ** 0.04 0.01 0.46
PE -> BI 0.54 4.42 *** 0.00 0.32 0.83
PE -> USE 0.23 2.25 ** 0.03 0.03 0.48
SI -> BI 0.06 0.77 NS 0.30 -0.13 0.30
SI -> USE 0.02 0.79 NS 0.29 -0.06 0.13
Note NS = not significant **p < .05. ***p < 0.01
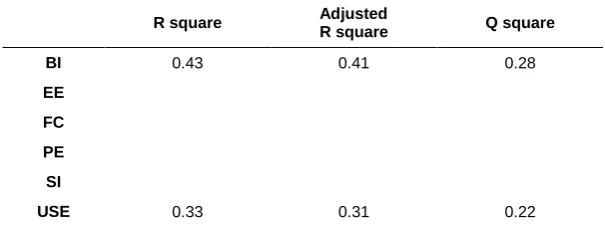
Table 4 Endogenous LVs’ R2
and Q2 values for the structural model
R square Adjusted
R square Q square
BI 0.43 0.41 0.28
EE
FC
PE
SI
USE 0.33 0.31 0.22
Academic staff’s f2
effect sizes and q2 effect sizes can be seen in Evans’ (2013) full study.
6.3 Moderation
Having described the relationships of the UTAUT constructs for the primary users of e-learning resources at the University of Zululand, attention shifted to understanding under what conditions the constructs operate. Hayes (2013: 27) explained that a relationship between two variables X and Y is said to be moderated when its size and sign depend on a third variable or set of variables M. Gender was coded as a 0/1 dummy variable, consistent with previous research (Venkatesh and Morris 2000 in Venkatesh et al. 2003: 439), and age was coded as a continuous variable, consistent with previous research (Morris and Venkatesh 2000 in Venkatesh et al. 2003: 439). Experience was operationalised via a dummy variable that took ordinal values of 1, 2, 3, 4 and 5 to capture increasing levels of user experience with the system. Using an ordinal dummy variable, rather than categorical variables, is consistent with recent research (for example, Venkatesh and Davis 2000: 197).
Students
While conducting the moderation analysis in SmartPLS, a positive correlation between experience and use of e-learning resources increased R2 of UB in the students’ UTAUT model (0.29). Bootstrapping resulted in two of the moderating effects in the model being significant at the 95% confidence level, that of experience moderating social influence towards behavioural intention – SI*Exper (t = 2.33) – and of experience moderating facilitating conditions towards use – FC*Exper (t = 4.05). However, on close inspection, the convergent validity (AVE) and composite reliability values did not meet the required criterion to be included in the model.
Academic staff
While conducting the academic staff’s moderation analysis in SmartPLS, the PLS algorithm calculation also showed slightly different results when all the moderating effects were run together. The study observed a strong correlation between experience and use of e-learning resources, with UB’s R2
(0.69) almost doubling. Bootstrapping, however, indicated only one moderating effect to be significant within the constructs of the academic staff’s UTAUT model, which was that of experience on facilitating conditions of academic staff – FC*Exper (t = 1.98). However, on close inspection, the convergent validity (AVE) values did not meet the required criterion to be included in the model.
7 Discussion of findings
The results of the study demonstrate the acceptance of e-learning resources by both students and academic staff in a blended teaching and learning environment. The extent of this acceptance requires the promotion of positive relationships that will influence both behavioural intentions to use these e-learning resources, and usage behaviour. The empirical findings show that resources that were perceived to improve student academic performances and that were easy to use were the most significant variables. For academic staff, the most significant relationship was using resources that were perceived to improve their performances in teaching, research and administration.
Another aim of the study was to investigate UTAUT’s efficiency in predicting the behavioural intentions as well as use behaviour of primary users of the resources. Empirical results demonstrated moderate predictive accuracies (adjusted R2) for student (0.39) and academic staff’s (0.41) behavioural intentions and that both structural equation models had some predictive relevance (Q2) in this respect. While UTAUT had a low predictive accuracy (adjusted R2) for student usage behaviours (0.16), the theory was twice as accurate in predicting academic staff’s usage behaviour (0.31) towards e-learning resources, which suggests almost a moderate accuracy.
A further aim was to validate the individual relationships between UTAUT’s four exogenous and two endogenous LVs, while also investigating under what conditions these LVs are moderated by the primary user’s gender, age, and experience of using e-learning resources.
7.1 Performance expectancy (PE)
Gender and age were found not to influence the students or academic staff’s performance expectancy effect on their behavioural intentions to use e-learning resources.
7.2 Effort expectancy (EE)
The ease of use (or the amount of effort) that students associated with using e-learning resources proved to be significant and the second-strongest positive relationship towards their behavioural intentions to use these resources. For academic staff, the path coefficient between effort expectancy and behavioural intentions showed a weak relationship that was non-significant. The latter finding possibly demonstrates the theory that individuals’ behavioural intentions become insignificant with increased experience or sustained usage (Agarwal and Prasad 1997: 570, Thompson, Higgins and Howell 1991: 140). The moderating effect of gender provided the first inconclusive result in the student sample, with a significant interaction found through Hayes’ (2013) PROCESS analysis, and an insignificant effect observed through bootstrapping in SmartPLS. In academic staff, the moderating effect of gender did not support the UTAUT theory and was non-significant. Age and experience were both found to be insignificant influences in students and academic staff’s relationship between effort expectancy and their behavioural intentions to use e-learning resources.
7.3 Social influence (SI)
Social influences on students proved to be the weakest positive relationship (but still significant) towards their behavioural intentions to use e-learning resources. For academic staff, SI also proved to be the weakest effect (and non-significant) on their intentions to use these resources. The social influences of students on their behavioural intentions to use e-learning was found to be greater in females than males, as hypothesised by Venkatesh et al. (2003: 452), however it was non-significant. Age and experience were found to be non-significant in moderating social influences of both primary users. In academic staff, the social influence effects on females’ behavioural intentions to use e-learning are slightly higher than those of males, however the moderating effect was non-significant.
7.4 Facilitating conditions (FC)
The relationship between the facilitating conditions and usage behaviour proved to be the strongest direct effect on students’ use of e-learning resources, as well as the most significant. For academic staff, this relationship proved to have a less-salient effect on their usage behaviour and was just significant at the 95% confidence interval. The moderating effects of age and experience had virtually no effect on students’ usage behaviour and were both non-significant. The age of academic staff shows virtually no effect on the relationship between the facilitating conditions and their usage behaviour and was non-significant. However, the experience of academic staff showed a small negative effect between the facilitating conditions and their usage behaviour and was not significant in Hayes’ (2013) PROCESS analysis. However, the same negative relationship was found to be significant (t = 1.97) when bootstrapping in SmartPLS, leading to the study’s second inconclusive result.
7.5 Behavioural intentions (BI)
The behavioural intentions of students to use e-learning resources had a moderately weak, but significant, positive relationship. The LV’s performance expectancy and effort expectancy had the greatest effects on students’ behavioural intentions to use e-learning resources, while facilitating conditions had a greater direct effect on students’ usage behaviour than their behavioural intentions. For academic staff, the significant relationship between their behavioural intentions and use behaviour was almost twice as strong as that found in students. Performance expectancy had the greatest effect on academic staff’s behavioural intentions to use e-learning resources. Academic staff’s behavioural intentions influenced their use behaviour the most.
7.6 Usage behaviour (UB)
The students’ use behaviour towards e-learning resources was more strongly influenced by the facilitating conditions than by their behavioural intentions. For academic staff, their behavioural intentions to use e-learning resources were the most influential.
8 Conclusion
Benchmarked tertiary education has integrated e-learning with face-to-face teaching, research, experiential learning and community outreach to form a blended learning ecology. In this ecology, the learner can interact with different conduits of information (language, media or technologies) to attain knowledge, meaning and understanding in relation to a programme’s exit level outcomes. Before institutions of higher education implement e-learning technologies, it is recommended that they identify, understand and support variables that facilitate the acceptance and use of these technologies so that these resources are employed for their intended purposes and provide a good return on investment.
At the University of Zululand there were various e-learning resources that required specific investigations to fully support their use in teaching and learning, research and administration. Many tools, including the Unified Theory of Acceptance and Use of Technology (UTAUT), can be used to gauge the needs, perceptions and expectations of users in a requirements analysis, which forms the first phase of the e-learning strategy and implementation plan at the university.
those using these resources at the University of Zululand. Although the results of the study cannot be generalised to all institutions of higher education, the conclusions may be applied to similar learning environments. UTAUT proved more successful in its predictive accuracy and relevance towards academic staff’s usage behaviour than that of students. However, few members of faculty integrated e-learning resources into their formal teaching. This finding suggests both a need for teaching and learning resources like the LMS to be accessible during timetabled classes, and appropriate skills development and support for these resources.
While UTAUT is not the most parsimonious SEM, it does attempt to achieve larger predictive accuracies by including a moderation analysis of its exogenous LVs (PE, EE, SI and FC). The moderating effects hypothesised by Venkatesh et al. (2003) were found not to have any significant effects in this university and the paper postulates that the acceptance of technologies in different sectors of the economy (industrial, financial and educational) requires uniquely contextualised socio-economic moderators for these to be significant.
The relationship between the expected academic performance gains in primary users and their behavioural intentions to use e-learning proved to be significant and the strongest direct effect. There was thus general agreement among both students and academic staff that e-learning was perceived to improve their performances in the blended teaching and learning environment, with this relationship being twice as strong in academic staff as in students. The result possibly indicates that performance is more salient for adults. The study’s results question the hypothesis of Venkatesh et al. (2003), that the relationship between users’ performance expectancies and their behavioural intentions will be moderated by gender and age so that the effect is stronger for males, and particularly younger males, especially within the tertiary education sector. Thus, the acquisition of quality e-learning resources, combined with relevant skills development and support, should improve the behavioural intentions of both students and staff to use e-learning technologies.
The relationship between effort expectancy and individuals’ behavioural intentions to make use of e-learning only proved significant for students. These results are consistent with previous findings that the effect of this construct diminishes with increased experience (Agarwal and Prasad 1997: 570; Thompson, Higgins and Howell 1991: 140; Venkatesh et al. 2003: 450). The results could also indicate that many first-year students, who made up almost half the student sample, found the two computer literacy modules relatively easy. The paper takes cognisance of the finding that, although the majority of students and academic staff agree that they find it easy to use e-learning resources, there was a minority who said they do not – and recommends that these users should be flagged using a similar instrument in the ongoing quality promotion mechanisms at the university.
The effect of social influences on the primary users’ behavioural intentions to make use of e-learning was found to be more significant in situations where use of the resources was mandatory. For example, the relationship between social influences of academic staff on students’ behavioural intentions to use these resources was significant for the students who had classes that were compulsory to attend. For most academic staff, who considered the use of these resources voluntary, the relationship was insignificant. The introduction of policies to make the use of these resources by academic staff mandatory might strengthen this effect as relationships between management, academic and support staff become more significant. Although the study found that gender moderated the relationships between social influences and their behavioural intentions in both primary users, such that social influences were greater in females than males, both were found to be insignificant.
Facilitating conditions had the strongest and most significant direct effect on students’ use of e-learning resources; for academic staff, behavioural intentions had twice the effect that facilitating conditions had on their use behaviour. These results indicate the importance of creating conducive facilitating conditions for students and positive behavioural intentions in academic staff to facilitate the use of e-learning. These conditions should include improving student access to these resources by, for example, providing first-year students with portable devices that can be utilised on the wireless campus area network. The moderation analysis of experience of academic staff on the relationship between facilitating conditions and use behaviour showed a negative value and significance was inconclusive, possibly indicating that the more experienced academic staff become at using e-learning resources, the less satisfied they are with the facilities and support at the university.
Recommendations for future research include:
extending the scope of UTAUT for predicting the acceptance and use of specific e-learning resources, for example, the Moodle LMS;
incorporating the instrument and data analysis methods of the study into quality assurance and support of e-learning resources at a departmental and modular level;
extending and improving the static, one-shot cross-sectional measurement method of primary users by using dynamic longitudinal and multiple time period measurements that do not rely on self-reporting methods, if possible; and
undertaking a broad mediation and moderation analysis of the UTAUT to identify some significant contextual socio-economic moderators and mediators on relationships between the theory’s four exogenous LVs (PE, EE, SI and FC) and the two endogenous LVs (BI and UB).
References
Agyei, V. 2007. From libraries to e-learning centres: a South African library experience. World Library and Information Congress: 73rd IFLA General Conference and Council. 19-23 August 2007. Durban, South Africa.
Ajzen, I. 2008. Icek Ajzen: Homepage. [Online]. http://people.umass.edu/aizen/f&a1975.html (3 July 2015).
Backhouse, J. 2013. What makes lecturers in higher education use emerging technologies in their teaching? Knowledge Management & E-learning, 5(3): 345-358.
Boere, I. and Kruger, M. 2008. Developmental study towards effective practices in technology-assisted learning: third combined report from fifteen participating South African universities. Johannesburg: University of Johannesburg. Brown, J.D. 2011. Likert items and scales of measurement? SHIKEN: JALT Testing & Evaluation SIG Newsletter. (15)1:
10-14. [Online]. http://jalt.org/test/PDF/Brown34.pdf (24 November 2015).
Council on Higher Education. 2014. Framework for institutional quality enhancement in the second period of quality assurance. [Online]. http://www.che.ac.za/sites/default/files/publications/QEP%20Framework%20Feb%202014.pdf (31 January 2016).
Davis, F.D., Bagozzi, R.P. and Warshaw, P.R. 1989. User acceptance of computer technology: a comparison of two theoretical models. Management Science, (35)8: 982-1003. [Online].
http://home.business.utah.edu/actme/7410/DavisBagozzi.pdf (31 January 2016).
Dillon, A. 2001. User acceptance of information technology. In Encyclopedia of Human Factors and Ergonomics. W. Karwowski, Ed. London: Taylor and Francis.
Dillon, A. and Morris, M. 1996. User acceptance of new information technology: theories and models. In Annual Review of Information Science and Technology. V. 31. M. Williams, Ed. Medford NJ: Information Today. 3-32. [Online].
http://www.ischool.utexas.edu/~adillon/BookChapters/User%20acceptance.htm (8 November 2015).
E-learning Africa. 2012. E-learning Africa Report. [Online]. http://www.elearning-africa.com/pdf/report/ela_report_2012.pdf (23 January 2016).
E-learning Africa. 2013. E-learning Africa Report. [Online]. http://www.icwe-secretariat.com/elearning-africa/elearning_africa_report_2013.php (30 January 2016).
Evans, N.D. 2013. Predicting user acceptance of electronic learning at the University of Zululand. [Online]. http://uzspace.uzulu.ac.za/handle/10530/1317 (10 November 2015).
Hair, J.F., Black W.C., Babin, B.J. and Anderson, R.E. 2010. Multivariate data analysis: a global perspective. 7th ed. New Jersey: Pearson.
Hair, J.F., Ringle, C.M. and Sarstedt, M. 2011. PLS-SEM: indeed a silver bullet. Journal of Marketing Theory and Practice, 19: 139-151. [Online]. https://sem-n-r.wistia.com (13 November 2015).
Hair, J.F., Hult, G.T.M., Ringle, C.M. and Sarstedt, M. 2014. A primer on Partial Least Squares Structural Equation Modeling (PLS-SEM). London: Sage Publications.
Hayes, A.F. 2013. Introduction to mediation, moderation, and conditional process analysis: a regression-based approach. New York: Guilford.
Mansell, R. and Tremblay, G. 2013. Renewing the Knowledge Societies vision: towards knowledge societies for peace and sustainable development. [Online]. http://en.unesco.org/post2015/sites/post2015/files/UNESCOKnowledge-Society-Report-Draft--11-February-2013.pdf (15 November 2015).
Moses, J.W. and Knutsen, T.L. 2012. Ways of knowing. 2nd ed. New York: Palgrave Macmillan.
Muller, W. and Evans, N.D. 2009. University of Zululand E-Learning Implementation Strategy and Plan. [Online].
http://elearn.uzulu.ac.za/docs/e-Learning%20implementation%20strategy%20and%20plan%20of%20Unizulu.pdf (20 November 2015).
Ravjee, N. 2007. The politics of e-learning in South African higher education. International Journal of Education and Development using Information and Communication Technology, 3(4): 27-41. [Online].
http://ijedict.dec.uwi.edu/include/getdoc.php?id=2541&article=424&mode=pdf (23 January 2016).
Ringle, C., Wende, S. and Will, A. 2004. SmartPLS Software Version 2.0.M3. [Online]. http://www.smartpls.de (9 August 2013).
Siemens, G. 2004. Connectivism: A learning theory for the digital age. [Online]. http://www.elearnspace.org/Articles/connectivism.htm (22 January 2016).
Sturges, P. 2006. Finding new ways of serving real needs: the future of information services. (Lecture presented at University of Zululand). [Online]. http://www.lis.uzulu.ac.za/lectures/paulsturges2006.pdf (15 December 2015). Taiwo, A.A. and Downe, A.G. 2013. The theory of User Acceptance and Use Of Technology (UTAUT): a meta-analytic
review of empirical findings. Journal of Theoretical and Applied Information Technology, 49(1).
Thompson, R. L., Higgins, C. A., and Howell, J. M. 1991. Personal computing: toward a conceptual model of utilization. MIS Quarterly, 15(1): 124-143.
University of Zululand. 2004. Teaching and Learning Policy. (Unpublished). University of Zululand. 2013. Teaching Development Proposal. (Unpublished).
Urbach, N. and Ahlemann, F. 2010. Structural equation modeling in information systems research using Partial Least Squares. Journal of Information Technology Theory and Application (JITTA), 11(2). [Online].
https://www.researchgate.net/publication/228467554_Structural_equation_modeling_in_information_systems_resear ch_using_partial_least_squares (18 September 2013).