Economic Evaluation of Different Methods of Screening for
Amblyopia in Kindergarten
Hans-Helmut Ko¨nig, MD, MPH*, and Jean-Cyriaque Barry, MD‡
ABSTRACT. Objective. To compare the cost-effec-tiveness of 5 methods of screening for untreated ambly-opia in kindergarten from a third-party-payer perspec-tive: A) uncorrected monocular visual acuity testing with pass threshold >0.5 (20/40) and <1 line difference be-tween eyes; B) same as A, but pass threshold>0.6 (20/32); C) same as A, plus cover tests and examination of eye motility and head posture; D) same as C, but pass thresh-old>0.6 (20/32); and E) refractive screening without cy-cloplegia using the Nikon Retinomax autorefractor.
Methods. A decision-analytic model was used with a time horizon until diagnostic examination. According to the model, all 3-year-old children were screened in kin-dergarten with 1 of the screening methods. Children with positive screening results were referred to an ophthal-mologist for diagnostic examination. Children with in-conclusive screening results were either referred to an ophthalmologist directly (option 1) or rescreened by the same method after 1 year and referred to an ophthalmol-ogist if rescreening was positive or inconclusive (option 2). Screening test characteristics and costs were estimated on the basis of a field study in which 1180 3-year-old children were examined by orthoptists in 121 German kindergartens.
Results. Compared with methods A option 1 (A-1), B-1, C-1, C-2, E-1, and E-2, there was at least 1 other method that was both less costly and more effective. The average costs per detected case were lowest for method A-2 (878 Euro), followed by methods B-2 (886 Euro), D-2 (908 Euro), and D-1 (965 Euro). When these methods were compared with each other, the additional costs per extra case detected were 1058 Euro (B-2 vs A-2), 1359 Euro (D-2 vs B-2), and 13 448 Euro (D-1 vs D-2).
Conclusions. Monocular visual acuity screening with rescreening of inconclusive results had a favorable cost-effectiveness. By adding additional test items, few more cases could be detected. Because of a great proportion of false-negative, false-positive, and inconclusive results, refractive screening was less effective with an unfavor-able cost-effectiveness. Pediatrics 2002;109(4). URL: http://www.pediatrics.org/cgi/content/full/109/4/e59;
screening, amblyopia, kindergarten, cost-effectiveness.
ABBREVIATIONS. ICER, incremental cost-effectiveness ratio; CER, cost-effectiveness ratio.
P
reschool vision screening is aimed mainly at detecting amblyopia early enough for treat-ment to be effective.1,2 However, there hasbeen concern about the lack of evidence for the ef-fectiveness of preschool vision screening programs, and, consequently, rigorous evaluation of such pro-grams has been called for.3– 6 Furthermore, because
scarcity of resources for health care is increasing, there is a growing interest among decision makers in the cost-effectiveness of health care interventions,7
yet little is known about the cost-effectiveness of preschool vision screening programs.3,8,9
In Germany, vision assessment is part of general preventive care examinations performed by general practitioners and pediatricians on children at 21 to 24 months and 42 to 48 months of age. These voluntary examinations are paid for by the social health insur-ance, which covers approximately 90% of the Ger-man population, as well as by private health insur-ance, which covers almost 10%. Although 71% to 95% of all eligible children participate in these exam-inations,10 the effectiveness of vision assessment in
detecting amblyopia is considered poor11,12 because
general practitioners and pediatricians lack experi-ence with ophthalmologic tests necessary in these age groups.13
Screening by orthoptists has been proposed as one option to improve vision screening.14,15 Orthoptists
are specialized medical aides with a thorough train-ing in infant and child vision assessment, ocular motility disorders examinations, and amblyopia management. In most children, monocular visual acuity can be assessed reliably by simple screening methods from age 3 onward.16 Therefore and
be-cause clinical experience holds that treatment is most effective when administered as early as possible, the fourth year of life is considered best for vision screening programs.17,18 From this age, children in
Germany are entitled by law to be admitted to kin-dergarten on parents’ request. As⬎50% of children enter kindergarten at age 3 and⬎80% attend kinder-garten at age 4,19screening programs conducted in
kindergarten provide easy access to children without inconveniencing parents.20,21
The purpose of this study was to compare the effectiveness and cost-effectiveness of different methods of screening for amblyopia conducted by orthoptists in kindergarten. The screening methods analyzed were visual acuity testing with and without cover tests and examination of eye motility and head posture, as well as refractive screening using the
From the *Department of Health Economics, University of Ulm, Ulm, Germany, and ‡Department of Ophthalmology II, University Eye Hospital Tu¨bingen, Tu¨bingen, Germany.
Received for publication Sep 14, 2001; accepted Dec 7, 2001.
Reprint requests to (H.-H.K.) University of Ulm, Department of Health Economics, Helmholtzstr 22, D-89081 Ulm, Germany. E-mail: [email protected]
Nikon Retinomax autorefractor (Nikon GmbH, Du¨s-seldorf, Germany). The Retinomax is a portable, hand-held, monocular autorefractor that uses a fog-ging technique (which eases relaxation of accommo-dation) to measure the objective refraction.22
METHODS Decision-Analytic Model
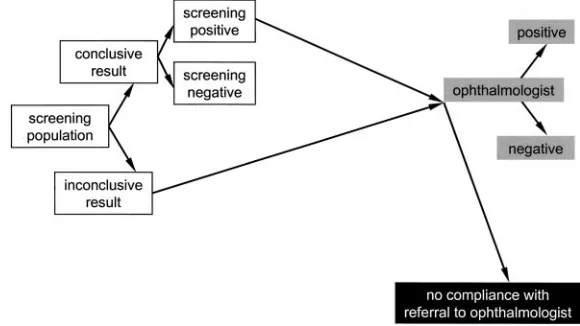
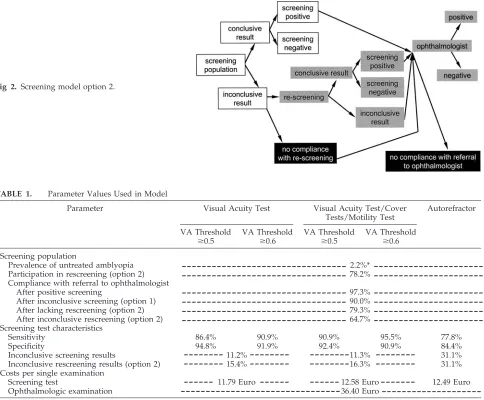
A decision-analytic model was used (Microsoft Excel spread-sheet download available as freeware for scientists at www. medizin.uni-tuebingen.de/⬃jcbarry/goe.html). According to the model, all 3-year-old children were screened for untreated ambly-opia in kindergarten by 1 of the screening methods to be com-pared. Children with positive screening results were referred to an ophthalmologist for diagnosis. With respect to children with in-conclusive screening results, 2 model options were distinguished: in option 1, children with inconclusive screening results were referred to an ophthalmologist directly (Fig 1); in option 2, chil-dren with inconclusive results were rescreened by the same method after 1 year and referred to an ophthalmologist if rescreen-ing was positive or inconclusive (Fig 2).
The effects of screening were defined as the number of newly detected cases of untreated amblyopia. The costs of the screening program were defined as labor and material costs of screening examinations as well as costs of diagnostic ophthalmologic exam-inations resulting from referral. They were estimated from the perspective of a third-party payer in Euro for the year 2000. In that year, the average Euro to US dollar exchange rate was 0.92 US dollar per 1 Euro, and the average purchasing power adjusted conversion rate was 0.99 US dollar per 1 Euro, ie, close to parity.23
Screening Methods
Five different screening methods were compared (visual acuity thresholds are reported in usual 20/X notation; however, the test distance used in the study was 10 ft, not 20 ft):
A. Uncorrected monocular visual acuity testing using the Lea single optotype test (required test distance 10 ft [3 m]; Precision Vision, Villa Park, IL) with pass threshold set atⱖ0.8 (20/25) monocular visual acuity in both eyes, orⱖ0.5 (20/40) in both eyes andⱕ1 line difference between the visual acuity of the right and left eye (L. Hyva¨rinen, Lea-Test Ltd, Helsinki, Fin-land, personal communication, 1998).
B. Uncorrected monocular visual acuity testing as described in A with pass threshold set atⱖ0.8 (20/25) monocular visual acuity in both eyes, orⱖ0.6 (20/32) in both eyes andⱕ1 line differ-ence between the visual acuity of the right and left eye. C. Uncorrected monocular visual acuity testing as described in A
plus cover tests and examination of eye motility and head posture.
D. Uncorrected monocular visual acuity testing as described in B plus cover tests and examination of eye motility and head posture.
E. Refractive screening without cycloplegia using the Nikon Reti-nomax autorefractor operated in the normal mode with pass
threshold as follows: spherical equivalentⱖ⫺1D and ⱕ3D, cylindric powerⱕ1.5D, and spherical equivalent anisometro-piaⱕ1D.
Screening results were classified as positive (when any screen-ing item was abnormal), negative (when all screenscreen-ing items were within normal limits), or inconclusive (when cooperation was insufficient).
For each screening method, the 2 model options were analyzed, resulting in 10 method-option combinations labeled A-1 (for vi-sual acuity screening A in model option 1) through E-2 (for re-fractive screening E in model option 2).
Model Parameters
The parameter values used in the decision-analytic model are shown in Table 1.
Prevalence and Test Characteristics
Data on screening test characteristics (sensitivity, specificity, proportion of inconclusive results), on the prevalence of untreated amblyopia, on the participation in rescreening, and on the com-pliance with ophthalmologic examinations were obtained from a field study in which 1180 3-year-old children were examined by orthoptists in 121 German kindergartens.24Of these children, 427
were also screened with the Nikon Retinomax autorefractor.22In
the field study, a gold standard was established for 1114 children. The ophthalmologic criteria for a positive gold standard were any newly administered patching therapy or any newly administered spectacle therapy, if the visual acuity wasⱕ0.4 (20/50) in either eye, or if the difference of visual acuity between the right and the left eye wasⱖ3 lines.
Costs of Screening Examinations
The costs of screening examinations were estimated on the basis of results of the field study in which the costs of orthoptic screening and device-based screening were calculated on the basis of comprehensive and detailed measurement of working time, material costs, and travel costs.25Working time was divided into
office time for organizing the screening program (organization time) and time for visiting the kindergartens. The latter was sub-divided into travel time, time for preparing the examination site in the kindergarten, and examination time. Material costs included costs for orthoptic materials, stationery, parent information leaf-lets, postage, and telephone. Estimates of the costs of the screening methods analyzed in this study were derived as follows: costs of methods C and D were assumed to be equal to the costs of the orthoptic examination calculated in the field study. For visual acuity testing (methods A and B), it was assumed that examina-tion time would be 25% less than for the orthoptic examinaexamina-tion, all other working times being equal. For the autorefractor (method D), it was assumed that examination time was equal to what was measured for device-based screening, all other working times being equal to the other screening methods analyzed. Further-more, investment costs and maintenance costs of the Nikon Reti-nomax autorefractor were included in the cost calculation. For calculating labor costs, working time was valued at 23.31 Euro/h
(0.39 Euro/min). This amount corresponds to the tariff class Vb of the German Federal Employee Tariff (Bundesangestelltentarif), which applies to salaried orthoptists working in the public health sector in the year 2000 and includes all ancillary wage costs.
Costs of Ophthalmologic Examinations
Costs of ophthalmologic examinations were calculated to be 36.40 Euro, based on the German social health insurance’s relative value scale for outpatient physician services (Einheitlicher Bewertungsmastab fu¨r A¨ rzte26), which states point volumes for
each service. A conversion factor (point value) of 0.041 Euro was used. For those covered by the social health insurance, there is no copayment for physician services.
Effectiveness and Cost-Effectiveness Ratios
Effectiveness was defined as the proportion of detected cases of untreated amblyopia in all cases of untreated amblyopia among the participating children. Average cost-effectiveness ratios were calculated for each screening method by dividing the total costs (for screening tests and ophthalmologic examinations) of the re-spective screening program by the number of newly detected cases of untreated amblyopia. Incremental cost-effectiveness ratios (ICER) were calculated by dividing the additional costs of a screening method compared with another screening method by the additional units of effects of this screening method
com-pared with the other screening method: ICER⫽(costsmethod X⫺
costsmethod Y)/(effectsmethod X⫺effectsmethod Y).
Sensitivity Analysis
Sensitivity analysis was performed to test the influence of un-certainty in screening method–specific model parameters on the cost-effectiveness. For this purpose, screening method–specific parameter values for sensitivity and specificity were varied ac-cording to their 95% confidence intervals found in the field study. For the parameter “costs per single screening test,” the baseline value was decreased and increased by 25% each.
RESULTS Costs of Screening Examinations
The costs per single screening examination were similar for the screening methods analyzed ranging from 11.79 Euro for visual acuity testing (methods A and B) to 12.58 Euro for visual acuity testing plus cover tests and examination of eye motility and head posture (methods C and D; Table 2). Labor was the most important resource used, accounting for ap-proximately 80% of total costs. Time spent on orga-nization accounted for approximately 50% of labor
Fig 2. Screening model option 2.
TABLE 1. Parameter Values Used in Model
Parameter Visual Acuity Test Visual Acuity Test/Cover
Tests/Motility Test
Autorefractor
VA Threshold
ⱖ0.5
VA Threshold
ⱖ0.6
VA Threshold
ⱖ0.5
VA Threshold
ⱖ0.6 Screening population
Prevalence of untreated amblyopia 2.2%*
Participation in rescreening (option 2) 78.2%
Compliance with referral to ophthalmologist
After positive screening 97.3%
After inconclusive screening (option 1) 90.0%
After lacking rescreening (option 2) 79.3%
After inconclusive rescreening (option 2) 64.7%
Screening test characteristics
Sensitivity 86.4% 90.9% 90.9% 95.5% 77.8%
Specificity 94.8% 91.9% 92.4% 90.9% 84.4%
Inconclusive screening results 11.2% 11.3% 31.1%
Inconclusive rescreening results (option 2) 15.4% 16.3% 31.1%
Costs per single examination
Screening test 11.79 Euro 12.58 Euro 12.49 Euro
Ophthalmologic examination 36.40 Euro
VA indicates visual acuity; dashed line indicates that number applies to all respective columns.
* The prevalence measured in the field study among 1114 children with gold standard was 26/1114⫽2.3%. For a conservative estimate, a prevalence of 2.2% was used, assuming that there were no additional cases among those children for whom no gold standard could be obtained.
---
---
--
---
--
---
--
---
-
---time. Only approximately one quarter of labor costs was caused by the examination itself, which on av-erage lasted between 6 minutes (methods A and B) and 8 minutes (methods C and D) per child.
Effectiveness
The effectiveness of screening ranged from 75.1% (autorefractor in model option 2) to 92.5% (visual acuity testing plus cover tests and examination of eye motility and head posture in model option 1; Table 3).
Cost-Effectiveness
The average costs per newly detected case of un-treated amblyopia ranged from 878 Euro for visual acuity testing in model option 2 (A-2) to 1514 Euro for refractive screening in model option 1 (E-1). Be-cause of the comparatively low specificity and high rate of inconclusive results of the autorefractor, a large proportion of children were referred to an oph-thalmologist after refractive screening, causing addi-tional costs: 39.4% in option 1 and 24.4% in option 2. For the other screening methods, the respective pro-portion ranged between 9.4% (visual acuity testing in option 2 [A-2]) and 19.7% (visual acuity testing plus cover tests and examination of eye motility and head posture in model option 1 [D-1]).
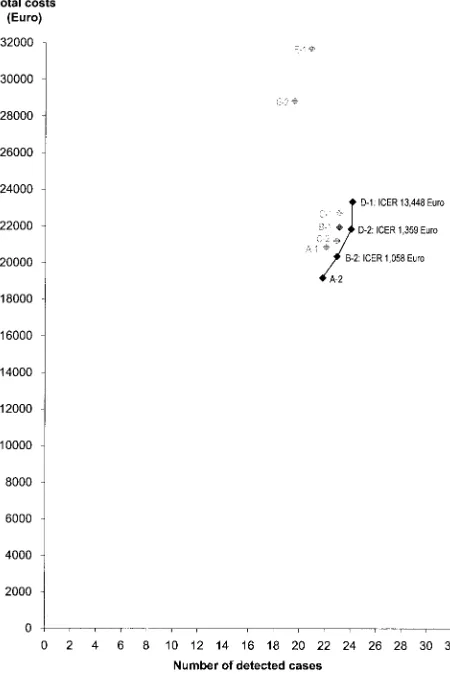
Figure 3 illustrates for a screening population of 1180 children that for 6 of the analyzed method-option combinations (A-1, B-1, C-1, C-2, E-1, E-2), there was at least 1 other option associated with both lower costs and greater effects. Thus, these 6 method-option combinations were so-called “dominated” and could be excluded from additional analysis. Among the remaining method-option combinations, visual acuity testing in option 2 (A-2) had the best average cost-effectiveness ratio of 876 Euro per de-tected case. By increasing the pass threshold for monocular visual acuity to ⱖ0.6 (20/32) in method B-2, additional costs of 1176 Euro would arise and 1.11 calculated additional cases would be detected. The ICER of B-2 versus A-2 would be 1058 Euro per additional case detected (1176 Euro/1.11), which is reflected by the slope of the line between A-2 and B-2 in Fig 3. Analogously, the ICER of D-2 versus B-2 and of D-1 versus D-2 would be 1359 Euro and 13 448 Euro, respectively.
Sensitivity Analysis
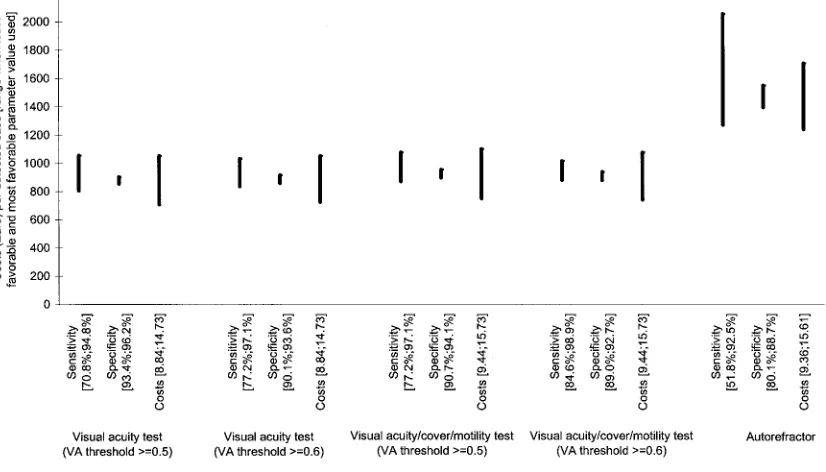
Variation of screening method–specific model pa-rameters for visual acuity testing with and without cover tests and examination of eye motility and head posture had moderate influence on cost-effectiveness ratios (CERs). The resulting intervals for average CERs were similar for these screening methods, ranging from 705 Euro to 1100 Euro per detected case in model option 2 (Fig 4). For refractive screening (method D), the respective intervals ranged from 1237 Euro to 2053 Euro. Thus, the costs per detected case were always higher for refractive screening than for the other screening methods analyzed. Because of the wide confidence interval of the sensitivity of refractive screening, which was based on gold
stan-TABLE 2. Costs of Screening Tests Resource Costs per Unit (a) Visual Acuity Test Visual Acuity Test/Cover Tests/Motility Test Autorefractor Quantity per Kindergarten (b) Quantity per
Examination (c⫽
b/9.88) Costs per Examination (a*c) Quantity per Kindergarten (d) Quantity per
Examination (e⫽
dards in 404 children, the uncertainty with respect to sensitivity had substantial influence on the CER.
DISCUSSION
The decision-analytic model showed similar CERs of visual acuity testing with and without cover tests and examination of eye motility and head posture and for both pass thresholds for visual acuity ana-lyzed. The average CER was approximately 900 Euro per detected case when children with inconclusive screening results were rescreened after 1 year (option 2). The effectiveness of screening could be increased slightly by using the more demanding pass threshold for visual acuity of ⱖ0.6 (20/32) instead of ⱖ0.5 (20/40) and by adding the cover tests and examina-tion of eye motility and head posture. Both changes caused more children to screen positive, among whom were both true positives (which increased sensitivity) and false positives (which decreased specificity). The increase in effectiveness resulting from these changes was approximately 4% each.
Refractive screening led to many false-positive and inconclusive results, thus inducing additional oph-thalmologic examinations that resulted in an unfa-vorable cost-effectiveness. Furthermore, the compar-atively low sensitivity of refractive screening brought about the lowest effectiveness of the screen-ing methods compared.
For all screening methods, it was more cost-effec-tive to rescreen children with inconclusive results than to refer them to an ophthalmologist directly. It may be sufficient to perform rescreening after 1 year because treatment started in the fifth year of life still is considered to be effective.27
Incremental analysis showed that only 4 method-option combinations were not dominated by other combinations, which means that compared with these 4 combinations, no other combinations were both less costly and more effective and thus clearly preferable. When these 4 combinations were com-pared, ICERs ranged from 1058 Euro to more than 13 000 Euro per additional case detected. On the basis of this information, a decision maker may
Fig 3. Cost-effectiveness of screening methods. VA, visual acuity. Results refer to a screening population of 1180 3-year-old children. A-1, visual acuity test (VA thresholdⱖ0.5) model option 1; A-2, visual acuity test (VA thresholdⱖ0.5) model option 2; B-1, visual acuity test (VA thresholdⱖ0.6) model option 1; B-2, visual acuity test (VA thresholdⱖ0.6) model option 2; C-1, visual acuity test/ cover tests/motility test (VA thresholdⱖ0.5) model option 1; C-2, visual acuity test/cover tests/motility test (VA thresholdⱖ0.5) model option 2; D-1, visual acuity test/cover tests/motility test (VA thresholdⱖ0.6) model option 1; D-2, visual acuity test/cover tests/motility test (VA thresholdⱖ0.6) model option 2; E-1, au-torefractor model option 1; E-2, auau-torefractor model option 2. Screening methods in gray are dominated by other screening methods. Slope of lines reflects ICER.
TABLE 3. Effectiveness and Average CER
Screening Test Model
Option
Effectiveness* Proportion of Children Receiving Ophthalmologic
Examination After Screening
Average CER (Euro/Case)
A. Visual acuity test 1 84.7% 16.2% 943
(VA thresholdⱖ0.5) 2 83.6% 9.4% 878
B. Visual acuity test 1 88.6% 18.7% 948
(VA thresholdⱖ0.6) 2 87.9% 12.1% 886
C. Visual acuity test/cover tests/motility test
1 88.6% 18.3% 982
(VA thresholdⱖ0.5)
2 87.8% 11.7% 924
D. Visual acuity test/cover tests/motility test
1 92.5% 19.7% 965
(VA thresholdⱖ0.6)
2 92.1% 13.2% 908
E. Autorefractor 1 80.1% 39.4% 1514
2 75.1% 24.4% 1471
VA indicates visual acuity.
choose the most suitable method-option combination taking into account the maximum limit he or she is willing to spend to detect an additional case.
Sensitivity analysis of screening method–specific parameters showed reasonably stable results. Only uncertainty with respect to the sensitivity of refrac-tive screening had substantial influence on the CER, yet even when the most favorable parameter value was used, refractive screening was less cost-effective than all other methods analyzed.
It is important to point out that the average CER is almost inversely proportional to the prevalence rate of untreated amblyopia in the screening population. If, for example, in a different population the preva-lence were twice as high as assumed in the model, then the average CERs for all screening methods would approximately be cut by half. Interested read-ers may test the influence of the prevalence rate as well as other model parameters on the CER by using a Microsoft Excel spreadsheet provided as free-ware by the authors (download available as freefree-ware for scientists at www.medizin.uni-tuebingen.de/ ⬃jcbarry/goe.html).
The data on screening test characteristics used in the decision-analytic model were obtained from a field study in which screening was performed by orthoptists. The most important screening test item was visual acuity testing. The high sensitivity and specificity of visual acuity testing was most likely attributable to the orthoptists’ training and experi-ence in vision assessment of children. In many Eu-ropean countries, such as Germany and Great Brit-ain, orthoptists are trained in sufficient numbers, and thus an orthoptic screening program could probably be implemented easily. In other countries, such as the United States, orthoptists may not be available, which raises the question of whether screening per-sonnel without orthoptic training could achieve
sim-ilar results. In Sweden, visual acuity screening has been performed successfully by nurses specialized in screening children,27and similar screening test
char-acteristics have been reported.2,28The authors know
from experience that nurses and other medical aides can perform visual acuity testing according to oph-thalmologic standards in preschool children pro-vided that they have received adequate training and perform visual acuity testing routinely and fre-quently. Thus, it can be expected that visual acuity testing performed by trained personnel other than orthoptists may be similarly effective and cost-effec-tive.
Other visual acuity tests with standardized opto-types suitable for children5are likely to yield similar
results if used strictly according to their manuals. The authors chose the Lea single optotype test be-cause it combines high testability, high sensitivity for amblyopia, and reduced test time compared with line tests.29However, if other tests are used, then the
thresholds may have to be adjusted to achieve simi-lar test characteristics.
In this study, costs were calculated from a third-party-payer perspective on the basis of resource prices from the German health care system. Because there was no copayment by the parents, neither for the screening nor for the diagnostic ophthalmologic examinations, calculated costs include all medical costs. Obviously, resource prices may be different in other countries, such as the United States. The use of gross domestic product purchasing power parities for currency conversion adjusts for differences in the general price level of different economies. In 2000, the purchasing power of 1 Euro in Germany was almost equal to the purchasing power of 1 US dollar in the United States. However, gross domestic prod-uct purchasing power parities do not account for differences in relative prices of health care compared
with the prices of all goods and services. According to the most recent data available for 1996,23relative
prices of health care in the United States were ap-proximately one third higher than in Germany, which could cause cost figures for the United States to be higher in this order of magnitude.
The CER of visual acuity screening in kindergarten with and without cover tests and examination of eye motility and head posture found in the study falls within a range likely to be acceptable for decision makers. Because visual acuity testing is a simple and accurate screening method, comparable results can be expected in other health care systems provided that access to children is easy and that the prevalence of untreated amblyopia is not fundamentally differ-ent.
Like many published cost-effectiveness analyses of screening programs and diagnostic tests in other ar-eas of medicine, this study considered only costs and effects that occurred up the clinical endpoint “diag-nosis.” It provides information on how efficient dif-ferent methods are in achieving the target of early detection of amblyopia. However, diagnosis of am-blyopia is only an intermediate target. A more com-prehensive evaluation of vision screening would also take into account the cost-effectiveness of subsequent treatment. Such an analysis would have to compare the costs and long-term effects, including the impact on quality of life, associated with treated and un-treated amblyopia. At this time, such a comprehen-sive evaluation is not possible because sufficient data on the effectiveness of treatment and on the disabil-ity caused by amblyopia are not available.30
ACKNOWLEDGMENTS
This study was supported by the Medical Faculty of the Uni-versity of Tu¨bingen (grant 447) and by the Ernst und Berta Grim-mke Stiftung, Du¨sseldorf, Germany.
REFERENCES
1. Sjo¨strand J, Abrahamsson M. Prevention of amblyopia and the concept of cure.Eur J Ophthalmol. 1997;7:121–129
2. Lennerstrand G, Jakobsson P, Kvarnstro¨m G. Screening for ocular dys-function in children: approaching a common program. Acta Ophthalmol
Scand. 1995;73(suppl 214):26 –38
3. Snowdon SK, Stewart-Brown SL. Preschool vision screening. Health
Technol Assess. 1997;1:1– 85
4. Wright MC, Colville DJ, Oberklaid F. Is community screening possible, or appropriate?Arch Dis Child. 1995;73:192–195
5. Hartmann EE, Dobson V, Hainline L, et al. Preschool vision screening: summary of a task force report.Pediatrics. 2000;106:1105–1112 6. Kemper AR, Margolis PA, Downs SM, Bordley WC. A systematic
review of vision screening tests for the detection of amblyopia. Pediat-rics. 1999;104:1220 –1222
7. Russell LB, Gold MR, Siegel JE, et al. The role of cost-effectiveness analysis in health and medicine.JAMA. 1996;276:1172–1177
8. Ko¨nig HH, Barry JC, Leidl R, Zrenner E. Cost-effectiveness of orthoptic screening in kindergarten: a decision-analytic model.Strabismus. 2000; 8:79 –90
9. Barry JC, Hartmann A, Pongs UM, Jo¨ckel M. Modell fu¨r das Nutzen-Kosten-Verha¨ltnis des Amblyopie-Screenings.Ophthalmologe. 1998;95: 19 –27
10. Bundesministerium fu¨r Gesundheit. Daten des Gesundheitswesens. Baden-Baden: Nomos; 2001
11. Bode CP, Kries R von, Gro¨ning A, Straaten S, Schmidt E. Welchen Beitrag zur Auffindung von Sehsto¨rungen leistet die Fru¨herkennungs-untersuchung U7.Monatsschr Kinderheilkd. 1994;142:901–904
12. Hohmann A, Ru¨ssmann W, Kaszli FA. Qualita¨t des Sehscreenings im Kindesalter.Klin Monatsbl Augenheilkd. 1997;211:41– 47
13. Beraterkreis fu¨r Krankheitsfru¨herkennung im Kindesalter des Zentral-instituts fu¨r die kassena¨rztliche Versorgung in der BRD.Hinweise zur Durchfu¨hrung der Fru¨herkennungsuntersuchung im Kindesalter.
Diagnose-Therapie. Vol. 10. Ko¨ln: Deutscher A¨ rzte-Verlag; 1991
14. Jarvis SN, Tamhne RC, Thompson L, Francis PM, Anderson J, Colver AF. Preschool vision screening.Arch Dis Child. 1990;65:288 –294 15. Bolger PG, Stewart-Brown SL, Newcombe E, Starbuck A. Vision
screen-ing in preschool children: comparison of orthoptists and clinical med-ical officers as primary screeners.BMJ. 1991;303:1291–1294
16. Egan DF, Brown R. Vision testing of young children in the age range of 18 months to 4 1/2 years.Child Care Health Dev. 1984;10:381–390 17. Newman DK, Hitchcock A, McCarthy H, Keast-Butler J, Moore AT.
Preschool vision screening: outcome of children referred to the eye service.Br J Ophthalmol. 1996;80:1077–1082
18. American Academy of Pediatrics, Committee on Practice and Ambula-tory Medicine. Vision screening and eye examination in children.
Pedi-atrics. 1986;77:918 –919
19. Statistisches Bundesamt.Statistisches Jahrbuch 2000 fu¨r die Bundesrepublik
Deutschland. Stuttgart: Metzler-Poeschel; 2000
20. Ka¨smann-Kellner B, Heine M, Pfau B, Singer A, Ruprecht KW. Screen-ing-Untersuchung auf Amblyopie, Strabismus und Refraktionsanoma-lie bei 1030 Kindergartenkindern.Klin Monatsbl Augenheilkd. 1998;213: 166 –173
21. Schro¨pfer HD, Meinert K. 15 Jahre Schielprophylaxe in den Kinderga¨r-ten des Kreises Zittau.Folia Ophthalmol. 1986;11:61– 63
22. Barry JC, Ko¨nig HH. Non-cycloplegic screening for amblyopia via refractive findings with the Nikon Retinomax handheld autorefractor in 3 year old kindergarten children.Br J Ophthalmol. 2001;85:1179 –1182 23. OECD Health Data 2001. A comparative analysis of 29 countries.
CD-Rom. Paris, France: OECD; 2001
24. Barry JC, Leidl R, Hartmann B, Zrenner E, Koenig HH. Orthoptic kindergarten screening for amblyopia in 1,180 three year olds: optimi-zation with a recall strategy entails high specificity and sensitivity [abstract].Invest Ophthalmol Vis Sci. 2001;42:S395
25. Koenig HH, Barry JC, Leidl R, Zrenner E. Cost-effectiveness of orthoptic screening in kindergarten: comparison of various options based on a study in 1,180 three year olds [abstract].Invest Ophthalmol Vis Sci. 2001;42:S395
26. Kassena¨rztliche Bundesvereinigung. Einheitlicher Bewertungsmastab
(EBM).Stand: 1. Juli. 1999. Ko¨ln: Deutscher A¨ rzte-Verlag; 1999
27. Kvarnstro¨m G, Jakobsson P, Lennerstrand G. Visual screening of Swed-ish children: an ophthalmological evaluation.Acta Ophthalmol Scand. 2001;79:240 –244
28. Kvarnstro¨m G, Jakobsson P, Lennerstrand G. Screening for visual and ocular disorders in children, evaluation of the system in Sweden.Acta
Paediatr. 1998;87:1173–1179
29. Gra¨f M, Becker R. Sehscha¨rfenbestimmung mit LH Symbolen und Landoltringen.Klin Monatsbl Augenheilk. 1999;215:86 –90
DOI: 10.1542/peds.109.4.e59
2002;109;e59
Pediatrics
Hans-Helmut König and Jean-Cyriaque Barry
Kindergarten
Economic Evaluation of Different Methods of Screening for Amblyopia in
Services
Updated Information &
http://pediatrics.aappublications.org/content/109/4/e59
including high resolution figures, can be found at:
References
http://pediatrics.aappublications.org/content/109/4/e59#BIBL
This article cites 25 articles, 6 of which you can access for free at:
Subspecialty Collections
http://www.aappublications.org/cgi/collection/ophthalmology_sub
Ophthalmology
following collection(s):
This article, along with others on similar topics, appears in the
Permissions & Licensing
http://www.aappublications.org/site/misc/Permissions.xhtml
in its entirety can be found online at:
Information about reproducing this article in parts (figures, tables) or
Reprints
http://www.aappublications.org/site/misc/reprints.xhtml
DOI: 10.1542/peds.109.4.e59
2002;109;e59
Pediatrics
Hans-Helmut König and Jean-Cyriaque Barry
Kindergarten
Economic Evaluation of Different Methods of Screening for Amblyopia in
http://pediatrics.aappublications.org/content/109/4/e59
located on the World Wide Web at:
The online version of this article, along with updated information and services, is
by the American Academy of Pediatrics. All rights reserved. Print ISSN: 1073-0397.