FEATURE EXTRACTION TECHNIQUES FOR IMAGE
RETRIEVAL USING HAAR AND GLCM
Neha
1, Tanvi Jain
21,2
Senior Research Fellow (SRF), SAM-C, Defence R & D Organization, (India)
ABSTRACT
Content Based Image Retrieval (CBIR) approach which provides efficient and effective means to extract most
similar images stored in the database based on image contents. It aims at retrieving images which are
perceptually meaningful by making the best use of a single or combination of visual content descriptors. The
major steps are feature extraction and similarity comparison. This paper expands along the two techniques
“Haar and GLCM” on Texture based image retrieval. Texture analysis is one of the widely used operations for
feature extraction. The first method explores texture features extraction of the image by applying Haar Wavelet
Transform (HWT) and then applying Gradient Operator Concept on LH and HL bands of HWT. The
implemented second method computes the texture features by applying popular gray level co-occurrence matrix
(GLCM) approach. The texture features thus extracted are subjected to similarity comparison and few images
with higher similarity value are retrieved. The Brodatz image database that utilizes texture features forms the
basis of the comparison and retrieval.It is concluded that the implemented GLCM provides much better results
when compared with the popular Haar.
Keywords:
CBIR, GLCM, Haar discrete transform
I. INTRODUCTION
The term “Feature Extraction” deals with extracting feature such as energy (energy measures texture uniformity.
If an image is completely homogeneous its energy will be maximum), entropy (it measures randomness of an
image), randomness, correlation (measure of how correlated a pixel is to its neighbor over the entire image),
homogeneity (it measures the spatial closeness of the distribution of elements in co-occurrence matrix to the
diagonal. If an image will be completely homogeneous, its energy will be maximum)etc. from an image, then
store these feature in an offline database for further use and use these feature for image retrieval. Image
retrieval is the process searching images from an offline database which are most similar to a query image
specified by the user. The matching of images is done by extracting their features (texture, color & shape) and
Figure1. CBIR System
Texture can be defined by certain constant, slowly varying or periodic local statistical properties computed over
different regions of an image.
Texture analysis is used in many applications such as CBIR, biomedical image processing, automated visual
inspection, and remote sensing. Much research work has been done on texture analysis for the last few decades.
Despite these efforts, texture analysis is still considered an interesting but difficult problem of image processing.
A good approach to study texture is the use of multi resolution analysis specially the Haar Wavelet Transforms.
The Gray Level Co-occurrence Matrix (GLCM) method is a way of extracting second order statistical texture
features. Using this statistical approach will help to provide valuable information about the relative position of
the neighboring pixels in an image.
This paper is organized as follows: This section gives a brief introduction on CBIR. Section 2 explain the image
decomposition and feature extraction using Haar discrete wavelet transform, Section 3 covers relative position
of the neighboring pixels in an image and feature extraction using Gray Level Co-occurrence Matrix (GLCM)
Section 4 covers similarity Measures. Section 5 describes experimental results. Finally conclusions are offered
in section 6.
II. HAAR DISCRETE WAVELET TRANSFORM
Discrete Wavelet Transform (DWT) is the combination of pyramid coding, sub band coding and Haar
transform. These are under the category of Multi-resolution analysis. Multi-resolution analysis (MRA)
concerned with the representation and analysis of signals at more than one resolution. Features that might go
undetected at one resolution may be easy to detect at another.
The Haar function hk(z) is defined on a continuous interval, z belongs to[0,1]
h0 (z) =h00 (z) =1/√N, z € [0, 1]
hpq (z) =1/√N*2
p/2
if (q-1)/2p ≤ z < (q-0.5)/2p
h
k (z) = hpq (z) =1/√N*(-2p/2) if (q-0.5)/2p ≤ z < q/2p
hpq (z) =0 otherwise, z € [0, 1]
where, k=0, 1, 2, N-1, N=2n , z=0/N,1/N,2/N,…,(N-1)/N . k is defined as k=2p+q-1, where 0≤p≤n-1, and q=0 or
1 for p=0, and 1≤q≤2p for p≠0.
Each step in the Haar Wavelet Transform [1], [2] calculates a set of scaling coefficients and a set of wavelet
image, HL – horizontal edges, LH –vertical edges, HH – diagonal edges. An L-level discrete wavelet transform
decomposes an image into 3*L+1 sub bands. A 2-level DWT decomposes an image into 3*2+1=7 bands as
shown in Fig 2.
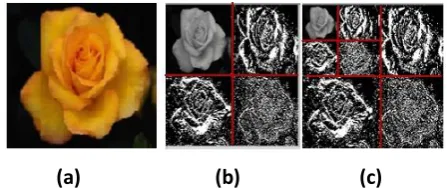
(a) (b) (c)
Figure 2 (a) The original image (b) Image obtained using 1-level Haar DWT. The levels are distinguished by
colored lines. (c) obtained using 2-level Haar DWT. The levels are distinguished by colored lines.
2.1
Texture Feature from Haar
For computing 1- level Haar Gradient operator is applied on HL (channel represents horizontal edges) and LH
(channel represents vertical edges) band of 1-Level haar wavelet. Thus with the given horizontal and vertical
gradient magnitudes we can calculate gradient direction for each pixel of the sub image by the formula:
where gx, gy are the convolved image of gradient magnitude in horizontal (from HL data) and vertical direction
(from LH data), respectively.
After calculating gradient direction for every pixel, number of regions is calculated as 360/D where D represents
the direction range. In other words, D is nothing but size of a bin while plotting graph of number of pixels versus
direction. Since the decision of direction range is crucial in affecting retrieval performance, the value of D should
be fine tuned to achieve greatest performance. Based on a series of experiments, the value of D was set to 40◦
which has the greatest retrieval performance. [3] Hence we get 9 bins, each of size 40 degrees, and we calculate
number of pixels in each bin. After this, for each bin three features, mean, standard deviation and entropy are
calculated as shown in equations:
(1)
(2)
(3)
III. GRAY LEVEL CO-OCCURRENCE MATRIX
The Gray Level Co-occurrence Matrix (GLCM) [4], [5] method is a way of extracting second order statistical
texture features. Using only histograms in calculation will result in measures of texture that carry only
information about distribution of intensities, but not about the relative position of pixels with respect to each
other in that texture. Using this statistical approach will help to provide valuable information about the relative
GLCM is a spatial domain technique. It is a tabulation of how often different combinations of pixel brightness
values (Gray Levels) occur in an image. The texture features are calculated by following the underlined steps in
order:
1. Four co occurrence matrices are computed from the gray scale image by considering distance between
pixels to be 1 and the four directions as 0o, 45o, 90o and 135o. Computation of co-occurrence matrix at 00 is
shown in Fig 3.
2. For each co-occurrence matrix so obtained, four features namely; contrast, correlation, energy and
homogeneity are calculated, thus resulting in a feature vector of size 16.
Figure3. Formation of Co-Occurrence Matrix for 0º Direction and a Single Gap Between the
Pixels
3.1. Texture Features from GLCM
After calculating GLCM in all four directions 0, 45, 90, 135 degrees features energy, Contrast, Homogeneity
and Correlation are calculated as shown in equations:
Energy= (4)
Contrast= (5)
Homogeneity= (6)
Correlation= (7)
Here, N is the number of rows/columns of image matrix Q, Pij is the probability that a pair of points in Q will
have values ( Ni, Nj ) , and are the mean of rows and columns respectively, and are the standard
deviation of rows and columns respectively.
IV. SIMILARITY MEASURE
In general, the accuracy of the retrieved results is directly proportional to the accuracy of the similarity
measurement. A comparison of feature vectors of two different images gives the degree of similarity between
them. Instead of exact matching of descriptors, content-based image retrieval calculates visual similarities of a
ranked by their similarities with the query image.In both the approaches (described in Section 2 and section 3)
we use an as Euclideandistance.
(8)
The process of identifying similar images to query image is shown in Fig 4, using Euclidean distance and
various features of image.
Figure4. Method for Identifying Similar Images
V. EXPERIMENTAL RESULT
The experiments were performed with Java as front end and MySQL as back end. The experiments were
performed using the Brodatz [6] Texture Album.18 different textures were taken. The image of each texture
type was divided into 16 non overlapping images of size 256X256, resulting in a database of 288 images.
Therefore, there are 16 relevant images belonging to each texture type. Samples are shown in Fig 5.
Figure5. Brodatz Database Sample
As an input query image shown in Fig 6 is provided
Figure6. Query Image
Offline Feature
Database Distance according to Compute Euclidean feature
Normalize according to
feature
Compute avg. of normalized
value
Apply sorting
Retrieved values for retrieving similar images Online feature
Haar transformation is applied on Brodatz database sample images. Then on these Haar transformed images
Sobel Gradient operator is applied on HL & LH band. Output obtained after applying Sobel Gradient operator
is shown in Fig7.
Figure7. Output after Sobel Gradient operator
After applying GLCM on Brodatz database sample images, following output is obtained. This is shown in Fig 8.
Figure8. Output after GLCM
The precision of the retrieval image is defined as the fraction of the retrieved images that are indeed relevant for
the query:
Performance analysis = |X(q)∩Y(q)| ÷ |X(q)| (9)
Where, total number of images of the texture type in offline database is denoted as Y(q), the total number of
images retrieved after computation is denoted as X(q).
By applying the performance analysis on Sobel Gradient operator on Haar transformed and GLCM transformed
Table1. Precision Table of Sobel Gradient Operator on Haar Transformed and GLCM images
VI. CONCLUSION
This paper presented efficient image retrieval techniques. It is concluded that the implemented GLCM provides
much better results when compared with the popular Haar, shown in Fig 9.
Figure9. Comparison Between Sobel Gradient Operator on Haar and GLCM
REFERENCES
[1] Dr. Fuhui Long, Dr. Hongjiang , and Prof. David Dagan Feng , Fundamentals of Content Based Image
Retrieval.
[2] Y.M. Latha, B.C. Jinaga, and V.S.K. Reddy, A Precise Content-based Image Retrieval: Lifting Scheme, Texture
Image
Sobel Gradient operator
applied on HL & LH and
features on HL & LH
GLCM
Precision Precision
50 60
100 80
50 90
70 100
ICGST-GVIP Journal, ISSN: 1687-398X, Vol. 8, 1, 6, June 2008.
[3] Kuo-An Wang, Hsuan-Hung Lin, Po-Chou Chan, Chuen-Horng Lin, Shih-Hsu Chang, and Yung-Fu Chen,
Implementation of an Image Retrieval System Using Wavelet Decomposition and Gradient Variation,
ISSN: 1109 2750, Issue 6, Volume 7, June 2008.
[4] Mehran Yazdi, Kazem Gheysari, A New Approach for Fingerprint Classification based on Gray-Level
Co-occurrence Matrix, World Academy of Science, Engineering and Technology 47, 2008.
[5] Priti Maheshwary, Namita Sricastava, Prototype System for Retrieval of Remote Sensing Images on Color
Moment and Gray Level Co-occurrence Matrix,IJCSI International Journal of Computer Science Issues,
Vol 3, 2009.
[6] P. Brodatz, Textures, A photographic album for artists and designers, New York, Dover, NY, 1996.
[7] Rafael C. Gonzalez, Richard E. Woods, Digital Image Processing,3rd ed, Pearson Education, 2008.
[8] Herbert Schildt, Java: The Complete Reference, 5th ed., Tata McGraw Hill,2005.