University of Pennsylvania University of Pennsylvania
ScholarlyCommons
ScholarlyCommons
Publicly Accessible Penn Dissertations
2019
Fairness And Feedback In Learning And Games
Fairness And Feedback In Learning And Games
Shahin Jabbari
University of Pennsylvania, [email protected]
Follow this and additional works at: https://repository.upenn.edu/edissertations Part of the Computer Sciences Commons
Recommended Citation Recommended Citation
Jabbari, Shahin, "Fairness And Feedback In Learning And Games" (2019). Publicly Accessible Penn Dissertations. 3410.
Fairness And Feedback In Learning And Games
Fairness And Feedback In Learning And Games
Abstract Abstract
In this thesis, we study fairness and feedback effects in game theory and machine learning. In game theory and economics, financial or technological networks are analyzed for feedback effects. These studies analyze how the connectivity benefits or risk of contagious shocks affect the individual agents or the structure of the network formed by these rational agents. Towards this direction, in the first part of this thesis, we study a series of novel network formation games and analyze the structural properties of the equilibrium networks.
Feedback effects can also occur in machine learning problems such as reinforcement learning or sequential allocation problems where the decisions of an algorithm over time can change the resources or actions available to the algorithm in the future as well as the environment in which the algorithm is operating. In the second part of this thesis, we study the effect of these feedback loops and ways to prevent them while also ensuring that the algorithm's actions and allocations satisfy natural notions of fairness. In particular we are interested in quantifying the cost of imposing fairness on learning algorithms.
Degree Type Degree Type Dissertation
Degree Name Degree Name
Doctor of Philosophy (PhD)
Graduate Group Graduate Group
Computer and Information Science
First Advisor First Advisor Michael Kearns
Keywords Keywords
Algorithmic Fairness, Feedback Loops, Game Theory, Machine Learning, Network Formation Games
FAIRNESS AND FEEDBACK IN LEARNING AND GAMES
Shahin Jabbari
A DISSERTATION in
Computer and Information Science
Presented to the Faculties of the University of Pennsylvania in
Partial Fulfillment of the Requirements for the Degree of Doctor of Philosophy
2019
Supervisor of Dissertation
Michael Kearns
Professor and National Center Chair Computer and Information Science
Graduate Group Chairperson
Rajeev Alur, Professor
Computer and Information Science
Dissertation Committee
Aaron Roth, Class of 1940 Bicentennial Term Associate Professor, Computer and Information Science
Acknowledgement
ABSTRACT
FAIRNESS AND FEEDBACK IN LEARNING AND GAMES
Shahin Jabbari
Michael Kearns
In this thesis, we study fairness and feedback effects in game theory and machine learning. In game theory and economics, financial or technological networks are analyzed for feedback effects. These studies analyze how the connectivity benefits or risk of contagious shocks affect the individual agents or the structure of the network formed by these rational agents. Towards this direction, in the first part of this thesis, we study a series of novel network formation games and analyze the structural properties of the equilibrium networks.
Table of Contents
Acknowledgement . . . ii
Abstract . . . iii
List of Tables . . . vi
List of Illustrations . . . viii
Chapter 1 : Introduction . . . 1
Chapter 2 : Network Formation Games with Attack and Deterministic Spread . . . 7
2.1 Introduction. . . 7
2.2 Model . . . 10
2.3 Diversity of Equilibrium Networks . . . 16
2.4 Sparsity . . . 17
2.5 Connectivity and Social Welfare in Equilibria . . . 19
2.6 Simulations . . . 22
2.7 A Behavioral Experiment . . . 26
2.8 Conclusion and Discussion . . . 30
Chapter 3 : Network Formation Games with Attack and Stochastic Spread. . . 32
3.1 Introduction. . . 32
3.2 Model . . . 35
3.3 Examples of Equilibrium Networks . . . 38
3.4 Edge Density . . . 39
3.5 Social Welfare . . . 41
Chapter 4 : Fairness in Reinforcement Learning . . . 44
4.1 Introduction. . . 44
4.2 Preliminaries . . . 48
4.3 Lower Bounds . . . 53
4.4 A Fair and Efficient Learning Algorithm . . . 55
4.5 Discussion and Future Work. . . 61
Chapter 5 : Fairness in Regression . . . 62
5.1 Introduction. . . 62
5.2 The Regression Setting. . . 64
5.3 Related Work . . . 68
5.4 A Comparative Empirical Case Study . . . 69
5.5 Conclusions . . . 75
Chapter 6 : Fairness in Allocations Problems . . . 77
6.1 Introduction. . . 77
6.2 Setting . . . 82
6.3 The Precision Discovery Model . . . 84
6.4 Experiments. . . 91
6.5 The Random Discovery Model . . . 98
6.6 Conclusion and Future Directions . . . 100
List of Tables
TABLE 1 : Summary of datasets. Type indicates whether regression is
List of Illustrations
FIGURE 1 : Blue and red vertices denoteIandU, respectively. The probability
of attack to the vulnerable regions V1,V2 and V3 (in that order) for each adversary are as follows. maximum carnage: 0.5, 0, 0.5;
random attack: 0.4, 0.2, 0.4; maximum disruption: 0, 1, 0. . . 12 FIGURE 2 : Examples of equilibria with respect to the maximum carnage
ad-versary: (2a) forest, (2b) cycle, (2c) 4-petal flower, (2d) complete
bipartite. . . 17 FIGURE 3 : Blue: immunized vertices in both networks. Red: vulnerable
ver-tices and regions in the original and abstract networks, respectively.
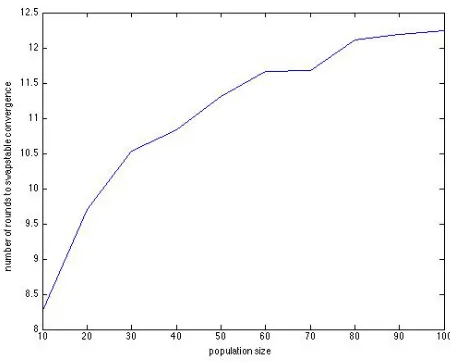
. . . 19 FIGURE 4 : Average number of rounds for swapstable convergence vs. n, for
CE=CI= 2. . . 23
FIGURE 5 : Sample equilibria reached by swapstable best response dynamics
for n = 50. Left: CE = 0.5, CI = 2. Middle: CE = 2, CI = 2.
Right: CE= 0.5,CI= 20. . . 24
FIGURE 6 : Number of edges (left panel), number of immunizations (middle
panel), and average welfare (right panel) vs. number of rounds, for
N = 50 and varying values for CIand CE. See text for discussion. 25
FIGURE 7 : Left: the final undirected network formed by the edge purchases
and immunization decisions (blue for immunized, red for
vulnera-ble). Right: a “nearby” Nash network. . . 28
FIGURE 8 : From left to right: hub-spoke, cycle and linear-paths network. A
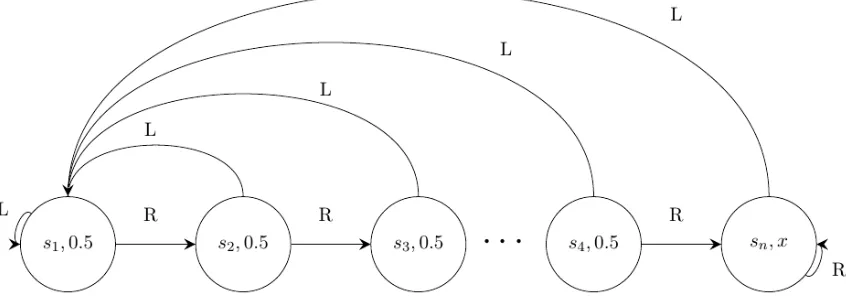
FIGURE 9 : MDP(x): Circles represent states (labels denote the state name and deterministic reward). Arrows represent actions. . . 54 FIGURE 10 : Left: An MDPM with actionsL and R and deterministic
transi-tion functransi-tions and rewards. Green denotes the set of known states
Γ. Middle: MΓ. Right: M[n]\Γ. . . 58
FIGURE 11 : Efficient frontiers of accuracy vs. fairness for each dataset. For
datasets with binary-valued targets (logistic regression), we
con-sider three fairness notions (group, individual and hybrid), and for
each examine building a single model or separate models for each
group, yielding a total of six curves. For real-valued targets (linear
regression), we consider two fairness notions (group and
individ-ual), and again single or separate models, yielding a total of four
curves. . . 73 FIGURE 12 : The PoF across data sets, for each type of fairness regularizer, in
both the single and separate model case. . . 76
FIGURE 13 : Frequencies of the number of reported crimes in each district in the
Philadelphia Crime Incidents dataset. The red curves display the
best Poisson fit to the data. . . 92 FIGURE 14 : Inverse PoF plots for the Philadelphia Crime Incidents dataset.
Smaller values indicate greater sacrifice in utility to meet the
fair-ness constraint. . . 94 FIGURE 15 : Pareto frontier of expected crimes discovered versus fairness
viola-tion. . . 96 FIGURE 16 : The per round expected number of crimes discovered and fairness
Chapter 1
Introduction
This thesis is devoted to the study of feedback effects both in game theory and machine learning. In the game theory chapters, we revisit classic network formation games modified to incorporate feedback effects by introducing an adversarial attack that can spread through the collectively formed network. In the machine learning chapters, we focus on classic learning settings where the learning is sequential and feedback loops might occur as a result of the interactive nature of the learning process. These feedback effects can in turn impose fairness concerns and we study these effects both in theory and practice.
In the first part of this thesis (Chapters2and 3) we study network formation games where strategic agents (or vertices) benefit from connectivity to other agents but also incur a cost for forming these connections. Most of the previous work on network formation games only focus on the case where the cost to an agent is direct (e.g. via purchasing a link). Motivated by scenarios as diverse as technological vulnerability or biological contagion we consider a game which incorporates indirect costs i.e. in our model an agent’s connection might also expose her to the negative contagious shocks the network might endure after the formation.
In our first model of network formation games, in Chapter2, we begin with the well-studied reachability network formation game [9] and modify this game by introducing an adversary that is allowed to examine the network and choose a single vertex to attack. The attack then spreads throughout the network destroying all the vertices in the connected component of the originally attacked vertex. The agents crucially have the option of purchasing immu-nization against the attack for a fixed cost. Thus the attack can only spread to the vertices that are reachable solely by unimmunized vertices from the originally attacked vertex.
than randomly selects a vertex to attack. Our focus is to understand the properties of the formed networks in equilibria. In particular, we are interested in understanding the tension between the connectivity benefits and indirect risks of contagious shocks with questions such as “Would the introduction of attack and immunization result in over-building or erode in welfare in equilibrium networks compared to the attack-free game?”
Our first result shows that the edge density of the networks formed in the equilibria of the new game overnvertices is bounded by 2n−4 and this upper bound is tight. This is less than twice as the number of edges in the equilibria of the original reachability network formation game. So the amount of overbuilding is sharply limited. In our second result, we show that in any non-trivial equilibrium network, the social welfare is at least n2−o(n5/3), which is
asymptotically the maximum welfare possible with a polynomial rate of convergence.
The model analyzed in Chapter 2 relies on the assumption that the attack spreads deter-ministically to adjacent vertices. However, in most real-world scenarios the spread of the attack is non-deterministic (e.g. the spread of a contagions disease over a biological net-work). This rather simple modification makes the game drastically complex as now even computing the utility of vertices becomes #P-complete. Regardless of this difficulty, in Chapter3, we show that the results of Chapter2 are robust to this modification. We focus on the regime where the cost of immunization is high and an adversary that selects a ver-tex uniformly at random to start the attack. We show that when the attack spreads with constant probability (independent of size of the network) and according to the independent cascade model [61], the edge density in the equilibrium networks overnvertices is bounded by O(nlog(n)), so again the amount of overbuilding compared to the original reachability game is limited. We also show that the in any non-trivial equilibrium network the social welfare is Ω(n2) as long as the network is nottoo dense. Therefore, many of the properties of the game with deterministic spread are preserved in the new variant.
decisions in seemingly low impact tasks like email spam filtering for a long time. With the advance of machine learning and the invention of sophisticated and accurate learning algorithms, machine learning has been recently applied to make high impact decisions like hiring [76], sentencing [10] and lending [18] which has been traditionally made by humans.
In addition to improving the accuracy of the decisions over a human decision maker it is tempting to think that the learning algorithms would not inherit the biases that are usually exhibited in human decision makers towards specific subgroups characterized e.g. by race or gender. However, recent empirical evidence suggests that this is not the case [85]. There are several ways to explain why the algorithms exhibit bias or behave unfairly. First, usually the learning algorithm is trained on historic data which itself can contain bias. It is then inevitable that the algorithm inherits these biases from the data. This feedback effect can be amplified with continuous utilization of the algorithm over time in a scenario where the data from the past interactions are repeatedly used to fine tune the algorithm’s decisions for future. To make matters worse and more complicated, it has also been observed that the algorithm can exhibit unfairness even when the historic data is unbiased or when the process of learning starts with no initial data (e.g. in online learning [52]). In addition, the successes of machine learning algorithms are highly dependent on the amount of training data available to them. Lack of sufficient amount of training data forminority groups has also been credited as another reason behind the unfair behavior of the algorithms.
between fairness and utility is an important direction in the algorithmic fairness literature.
The approaches used in the algorithmic fairness literature can be roughly divided into three categories. In pre-processing [44, 53], before any learning is done, the training data itself would be modified so that the desired fairness notion is satisfied. After the pre-processing step, a black-box learning algorithm can be used to learn a predictor hoping that fairness would continue to hold when using this learned predictor on the modified data. In-processing [19,55] can refer to two types of approaches. In the first type, initially a predictor is learned ignoring fairness altogether. Then the predictor is modified to account for fairness (e.g. by shifting the decision boundary in favor of the minority group). In the second type, fairness is usually written as a constraint in the optimization problem used to derive a predictor. Then the constrained optimization problem is solved either directly or using a heuristic. In post-processing [45, 88], first a prediction model is learned, again ignoring fairness altogether. Then the outcome of the predictor will be distorted only as a function of the group the data point belongs to and the prediction of the algorithm. Crucially, the modification in post-processing cannot depend on the group-agnostic attributes of the input and this is the essential difference between in-processing and post-processing.
Finally, most of the current body work on algorithmic fairness is on classification which is the most well-understood task in machine learning aiming to predict binary outcomes. We consider three different machine learning settings, introduce new notions of fairness for each setting, design algorithmic frameworks to satisfy these notions of fairness and finally quantify the trade-off between fairness and utility in each of these settings.
an algorithm cannot favor an action with a lowertruelong-term potential to an action with a highertrue long-term potential. Since the true long-term potential of an action is unknown to the algorithm, the constraint of fairness mandates the learning algorithm to explore extensively. Given this observation, we show that imposing such a fairness constraint to an algorithm makes efficient learning impossible. We further design an efficient in-processing learning algorithm for a slightly relaxed version of this fairness notion.
In Chapter 5 we consider the regression setting where the goal is to predict a real valued number using a linear model. We introduce a rich family of fairness metrics for regression models that take the form of a fairness regularizer and apply them to the standard loss functions for linear and logistic regression. Our family of fairness metrics covers the spec-trum from the type of group fairness that are common in the classification setting to much stronger notions of individual fairness. Our framework allows for computationally efficient in-processing algorithms and we empirically study the trade-off between fairness and the prediction utility of our learning algorithm across several real-world datasets where fairness is a concern. Our analysis reveals that the trade-off between fairness and utility can vary significantly when considering different notions of fairness or different learning domains.
utility of the allocation both in theory and empirically over a real-world dataset.
Chapter 2
Network Formation Games with Attack and
Deter-ministic Spread
2.1. Introduction
In network formation games, distributed and strategic agents receive some benefit from their connectedness to others, but also incur some cost for forming these links. Much research in this area [9,16,34] studies the structure of equilibrium networks formed as the result of various choices for the network benefit function, as well as the social welfare in equilibria. In many network formation games, the costs incurred from forming links are direct: each edge costsCE>0 for an agent to purchase. Recently, motivated by scenarios as diverse as
financial crises, terrorism and technological vulnerability, games with indirect connectivity costs have been considered: an agent’s connections expose her to negative, contagious shocks the network might endure.
name a few. A player’s overall payoff is thus the expected size of her post-attack component, minus her edge and immunization expenditures.
Our game can be viewed as a stylized model for settings where reachability rather than centrality is the primary interest in joining a network vulnerable to adversarial attack. Examples include technological networks such as the Internet, where packet transmission times are sufficiently low that being “central” [34] or a “hub” [16] is less of a concern, but in the presence of attacks such as viruses or DDoS, mere reachability may be compromised. Parties may reduce risks via costly measures such as anti-virus. In a financial setting, vertices might represent banks and edges credit/debt agreements. The introduction of an attractive but extremely risky asset is a threat or attack on the network that naturally seeks its largest accessible market, but can be mitigated by individual institutions adopting balance sheet requirements or leverage restrictions. In a biological setting, vertices could represent humans, and edges physical proximity or contact. The attack could be an actual biological virus that randomly infects an individual and spreads by physical contact through the network; again, individuals may have the option of immunization. While our simplified model is obviously not directly applicable to any of these examples in detail, we do believe our results provide some high-level insights about the strategic tensions in such scenarios. See Section2.8 for discussion of some variants of our model.
Immunization against attack has recently been studied in games played on a network where risk of contagious shocks are present [21] but only in the setting in which the network is first designed by a centralized party, after which agents make individual immunization decisions. We endogenize both these aspects, which leads to a model incomparable to this earlier work.
questions of interest: How dense can equilibria become? In particular, does the presence of the attacker encourage the creation of massive redundancy of connectivity? Moreover, does the introduction of attack and immunization result in dramatically lower social welfare compared to the original game?
Our Results and Techniques The main theoretical contributions of this work are to show that our game still exhibits edge sparsity at equilibrium, and has high social welfare properties despite the presence of attacks. First we show that under a very mild assumption on the adversary’s attack model, the equilibrium networks withn≥4 players have at most 2n−4 edges, fewer than twice as many edges as any nonempty equilibria of the original reachability game without attack. We prove this by introducing an abstract representation of the network and use tools from extremal graph theory to upper bound the resources globally invested by the players to mitigate connectivity disruptions due to any attack, obtaining our sparsity result.
We complement our theory with simulations demonstrating fast and general convergence of swapstable best response, a type of limited best response which generalizes linkstable best response but is much more powerful in our game. The simulations provide a dynamic counterpart to our static equilibrium characterizations and illustrate a number of interesting further features of equilibria, such as heavy-tailed degree distributions.
OrganizationWe formally present our model and review some related work in Section2.2. In Section 2.3we describe some interesting topologies that arise as equilibria in our model illustrating the richness of the solution space. We present our sparsity result and lower bound on welfare in Sections 2.4 and 2.5, respectively. Sections 2.6 and 2.7 describe our simulations and behavioral experiment, respectively. We conclude with some directions for future work in Section2.8.
2.2. Model
We assume thenvertices of a graph (network) correspond to individual players. Each player has the choice to purchase edges to other players at a cost of CE>0 per edge. Each player
additionally decides whether to immunize herself at a cost ofCI>0 or remainvulnerable.
A (pure) strategy for player i (denoted by si) is a pair consisting of the subset of players i purchased an edge to and her immunization choice. Formally, we denote the subset of edges which i buys an edge to as xi ⊆ {1, . . . , n}, and the binary variable yi ∈ {0,1} as her immunization choice (yi = 1 when i immunizes). Then si = (xi, yi). We assume that edge purchases are unilateral i.e. players do not need approval or reciprocation in order to purchase an edge to another but that the connectivity benefits and risks are bilateral. Furthermore, we restrict our attention to pure strategy equilibria and our results show they exist and are structurally diverse.
Let s = (s1, . . . , sn) denote the strategy profile for all the players. Fixing s, the set of
decisions forms a bipartition of the vertices. We denote a gamestate as a pair (G,I), where G= (V, E) is the graph induced by the edges purchased by the players and I ⊆ V is the set of players who decide to immunize. We useU =V \ I to denote the vulnerable vertices i.e. the players who decide not to immunize. We refer to a subset of vertices of U as a
vulnerable region if they form a maximally connected component. We denote the set of
vulnerable regions by V ={V1, . . . , Vk} where eachVi is a vulnerable region.
Fixing a game state (G,I), the adversary inspects the formed network and the immunization pattern and chooses to attack some vertex. If the adversary attacks a vulnerable vertex v ∈ U, then the attack starts at v and spreads, killingv and any other vulnerable vertices reachable from v. Immunized vertices act as “firewalls” through which the attack cannot spread. In this work we restrict the adversary to only pick one seed to start the attack.
More precisely, the adversary is specified by a function that defines a probability distribution over vulnerable regions. We refer to a vulnerable region with non-zero probability of attack as a targeted region and the vulnerable vertices inside of a targeted region as targeted vertices. We denote the targeted regions by T ={T1, . . . ,Tk0} where each T0 ∈ T denotes
a targeted region andk0 ≤k.
T = ∅ corresponds to the adversary making no attack, so player i’s utility (or payoff) is equal to the size of her connected component minus her expenses (edge purchases and immunization). When |T | > 0, then player’s i expected utility (fixing a game state) is equal to the expected size of her connected component less her expenditures, where the expectation is taken over the adversary’s choice of attack (a distribution on T) and the size of the connected component of a vertex is defined to be zero in the event she is killed. Formally, let Pr[T0] denote the probability of attack to targeted regionT0 and CCi(T0) the
iin strategy profile sdenoted byui(s) is precisely
ui(s) = X
T0∈T
PrT0
CCi T0
− |xi|CE−yiCI.
We refer to the sum of expected utilities of all players playingsas the (social) welfare ofs.
Examples of AdversariesWe highlight several natural adversaries that fit into our frame-work. We begin with an adversary whose goal is to maximize the number of agents killed. Definition 1. The maximum carnage adversary attacks the vulnerable region of maximum size. If there are multiple such regions, the adversary picks one of them uniformly at random.
Once a targeted region is selected for the attack, the adversary selects a vertex inside of that
region uniformly at random to start the attack.
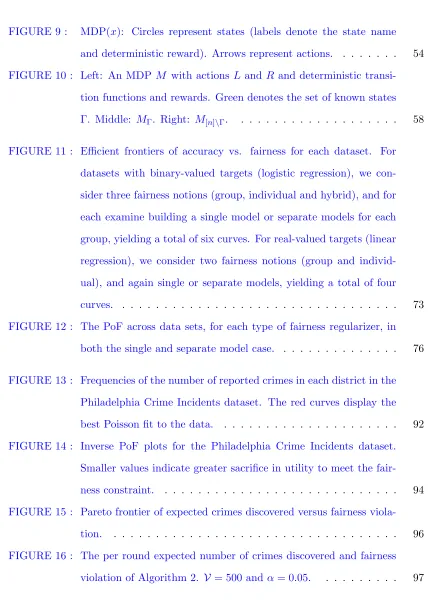
Then a targeted region with respect to a maximum carnage adversary is a vulnerable region of maximum size and the adversary defines a uniform distribution over such regions (see Figure1). We now introduce another natural but less sophisticated adversary which starts an attack by picking a vulnerable vertex at random.
V3 V2 V1
Figure 1: Blue and red vertices denote I and U, respectively. The probability of attack to the vulnerable regions V1,V2 and V3 (in that order) for each adversary are as follows. maximum carnage: 0.5, 0, 0.5; random attack: 0.4, 0.2, 0.4; maximum disruption: 0, 1, 0.
Definition 2. The random attackadversary attacks a vulnerable vertex uniformly at ran-dom.
Definition 3. The maximum disruptionadversary attacks the vulnerable region which min-imizes the post-attack social welfare. If there are multiple such regions, the adversary picks
one of them uniformly at random. Once a targeted region is selected for the attack, the
adversary selects a vertex inside of that region uniformly at random to start the attack.
This adversary only attacks those vulnerable regions which minimize the post-attack welfare and the adversary defines a uniform distribution over such regions (again see Figure 1).
Equilibrium ConceptsWe analyze the networks formed in our game under two types of equilibria. We model each of thenplayers as strategic agents who choose deterministically which edges to purchase and whether or not to immunize, knowing the exogenous behavior of the adversary defined as above. A strategy profile s is a pure-strategy Nash equilibrium
(Nash equilibrium for short) if, for any player i, fixing the behavior of the other players to bes−i, the expected utility foricannot strictly increase playing any action s0i oversi.
In addition to Nash, we study another equilibrium concept that is closely related to linkstable equilibrium (see e.g. [15]), a bounded-rationality generalization of Nash. We refer to this concept asswapstable equilibrium. This equilibrium concept was first introduced by Lenzner [68] under the name greedy equilibrium. A strategy profile is a swapstable equilibrium if no individual agent’s expected utility (fixing other agent’s strategies) can strictly improve under any of the following swap deviations: (1) Dropping any single purchased edge, (2) Purchasing any single unpurchased edge, (3) Dropping any single purchased edge and pur-chasing any single unpurchased edge, (4) Making any one of the deviations above, and also changing the immunization status.
rationality concept that moves us closer to full Nash. Intuitively, in our game (and in many of our proofs), we exploit the fact that if a player is connected to some other set of vertices via an edge to a targeted vertex, and that set also contains an immune vertex, the player would prefer to connect to the immune vertex instead. This deviation involves a swap not just a single addition or deletion. It is worth mentioning explicitly that by definition every Nash equilibrium is a swapstable equilibrium and every swapstable equilibrium is a linkstable equilibrium. The reverse of none of these statements are true in our game. We also point out that the set of equilibrium networks with respect to adversaries defined in Definitions 1,2and 3 are disjoint.
2.2.1. Related Work
The problem of strategic network design and defense has been extensively studied in eco-nomics, electrical engineering, and computer science (see e.g. [4, 5, 41, 81]). Most of the existing work takes the network as given and examines optimal security choices (see e.g. [7,26,43,58,67]). To the best of our knowledge, our we offer the first model in which both links and defense (immunization) are chosen by the players.
Combining linking and immunization within a common framework yields new insights. We start with a discussion of the network formation literature. In a setting with no attack, our model reduces to the original model of one-sided reachability network formation of Bala and Goyal [9]. They showed that a Nash equilibrium network is either a tree or an empty network. By contrast, we show that in the presence of a security threat, Nash networks exhibit very different properties: both networks containing cycles and partially connected networks can emerge in equilibrium. Moreover, we show that while networks may contain cycles, they are sparse (we provide a tight upper bound on the number of links in any equilibrium network of our game).
design is given. A vertex v is defined to be k-critical in a connected network if the size of the largest connected component after removing v is k. Cerdeiro et al. [21] show that an optimal network is either a hub-spoke or a network containing k-critical vertices or a partially connected network (observe that a k-critical vertex can secure n−k vertices by immunization). We extend this work by showing that there is a pressure toward the emer-gence of k-critical vertices even when linking is decentralized. We also contribute to the study of welfare costs of decentralization. Cerdeiro et al. [21] show that the Price of Anarchy (PoA) is bounded, when the network is centrally designed while immunization is decentral-ized (their welfare measure includes the edge expenditures of the planner). By contrast, we show that the PoA is unbounded when both decisions are decentralized. Although we also show that non-trivial equilibrium networks with respect to various adversaries have a PoA very near 1. This highlights the key role of linking and resonates with the original results on the PoA in for pure network formation games (see e.g. [40]).
Blume et al. [16] study network formation where new links generate direct (but not reach-ability) benefits, infection can flow through these links and immunization is not a choice. They demonstrate a fundamental tension between socially optimal and stable networks: the former lie just below a linking threshold that keeps contagion under check, while the latter admit linking just above this threshold, leading to extensive contagion and very low payoffs.
vertices. So if there were two edge-disjoint paths between any pairs of vertices, they will certainly remain connected after any attack. In our model the adversary attacks a vertex and the attack can spread and delete many links. This leads to a more delicate analysis. The welfare analysis is also quite different, since the deletion of an edge can cause a network to have at most two connected components, while the deletion of (one or more) vertices might lead to many connected components.
Finally, in a follow up work, Friedrich et al. [38] study the complexity of computing Nash best response for our game with respect to the maximum carnage and random adversaries.
2.3. Diversity of Equilibrium Networks
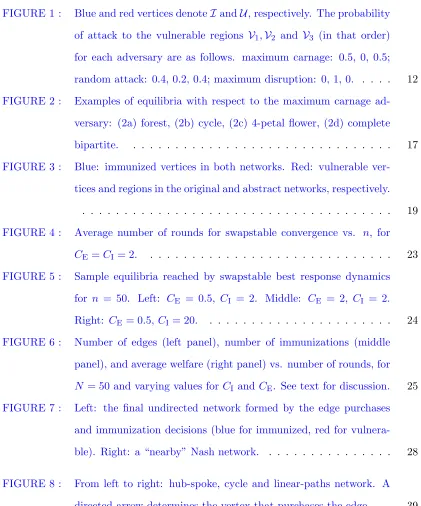
In contrast to the original reachability network formation game [9], our game exhibits equi-librium networks which contain cycles, as well as non-empty graphs which are not connected. Figure 2 gives several examples of specific Nash equilibrium networks with respect to the maximum carnage adversary for small populations, each of which is representative of a broad family of equilibria for large populations and a range of values for CE and CI. In
this chapter, we represent immunized and vulnerable vertices as blue and red, respectively. Although we treat the networks as undirected graphs (since the connectivity benefits and risks are bilateral), we use directed edges in some of the figures to denote which player purchased the edge e.g. i→ j means that i has purchased an edge to j. Finally, we use the maximum carnage adversary in many of our illustrations throughout this chapter be-cause both the adversary’s choice of attack and verifying certain properties are the easiest in this model compared to other natural models of Section 2.2. The examples in Figure 2 show that the tight characterization of the reachability game, where equilibrium networks are either empty graph or trees, fails to hold for our more general game (though such graphs can also form at equilibrium in our game). However, in the following sections, we show that an approximate version of this characterization continues to hold for several adversaries.
(a) (b) (c) (d)
Figure 2: Examples of equilibria with respect to the maximum carnage adversary: (2a) forest, (2b) cycle, (2c) 4-petal flower, (2d) complete bipartite.
game compared to the non-attack reachability game. It is thus natural to ask just how dense they can be. In Section2.4, we prove that (under a mild assumption on the adversary) the equilibria of our game cannot contain more than 2n−4 edges whenn≥4. So while these networks can be denser than trees, they remain quite sparse, and thus the threat of attack does not result in too much “over-building” or redundancy of connectivity at equilibrium. Our density upper bound is tight, as the generalized complete bipartite graph in Figure2d has exactly 2n−4 edges.
On the other hand, the examples also show that equilibrium networks can be disconnected (even before the attack) and this might raise concerns regarding the welfare compared to the reachability game. In Section2.5, we show that for several adversarial attacks, all equilibria which contain at least one edge and at least one immunized vertex (and are thusnon-trivial
as they are different than any equilibrium of the reachability game without attack) are connected and have immunization patterns such that even after the attack the network remains highly connected. Hence such equilibria in fact enjoy very good welfare.
2.4. Sparsity
We start by defining a natural restriction on the adversary. We then propose an abstract view of the networks in our game and proceed to show that the abstract network is chord-free in equilibria with respect to the restricted adversary. We finally derive the edge density of the original network by connecting its edge density to the density of the abstract network. We start by defining equivalence classes for networks.
Definition 4. Let G1 = (V, E1) and G2 = (V, E2) be two networks. G1 and G2 are
equivalent if for all vertices v ∈ V, the connected component of v is the same in both G1
and G2 for every possible choice of initial attack vertex inV.
Based on equivalence, we make the following natural restriction on the adversary.
Assumption 1. An adversary is well-behaved if on any pair of equivalent networks G1=
(V, E1) and G2 = (V, E1), the probability that a vertex v∈V is chosen for attack, is equal.
Note that the adversaries in Definitions 1-3 are all well-behaved. We proceed to abstract the network formed by the agents and argue about the edge density in this abstraction.
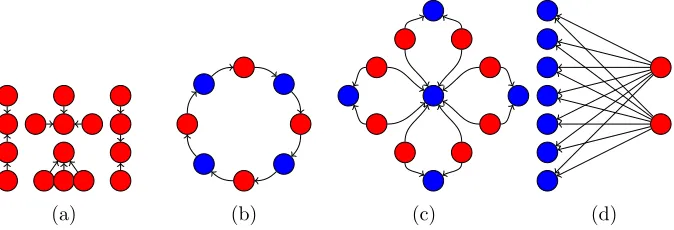
Let G = (V, E) be any network, I ⊆ V the immunized vertices in G and V1, . . . ,Vk the vulnerable regions inG. In the abstract network every vulnerable region inGis contracted to a single vertex. More formally, let G0 = (V0, E0) be the abstract network. Define V0 =I ∪{u1, . . . uk}where eachuirepresents a contracted vulnerable region ofG. Moreover, E0 is constructed fromE as follows. For any edge (v1, v2)∈E such thatv1, v2∈ I there is
an edge (v1, v2) ∈ E0. For any edge (v1, v2) ∈ E such that v1 ∈ Vi for some i and v2 ∈ I
there is an edge (ui, v2) ∈E0 whereui denotes the contracted vulnerable region ofG that v1 belongs to. For any edge (v1, v2) such thatv1, v2∈ Vi for someithere is no edge in G0. We illustrate an example of the original network and the abstract network in Figure3.
We next show that ifGis an equilibrium network then G0 is a chord-free graph.
Lemma 1. Let G = (V, E) be a Nash, swapstable or linkstable equilibrium network and
G0 = (V0, E0) the abstraction of G. Then G0 is chord-free if the adversary is well-behaved.
V3
V2
V1
(a) original network (b) abstract network
Figure 3: Blue: immunized vertices in both networks. Red: vulnerable vertices and regions in the original and abstract networks, respectively.
Theorem1 from the graph theory literature.
Theorem 1 (Mader [74]). Let G= (V, E) be an undirected graph with minimum degree d. Then there is an edge(u, v)∈E such that there are d vertex-disjoint paths from u to v.
Theorem 2. Let G= (V, E) be a chord-free graph on n≥4 vertices. Then|E| ≤2n−4.
Theorem2implies the edge density of the abstract networkG0 = (V0, E0) is at most 2|V0|−4. To derive the edge density of the original network, we first show that any vulnerable region inG(contracted vertices in G0) is a tree whenGis an equilibrium network.
Lemma 2. Let G= (V, E) be a Nash, swapstable or linkstable equilibrium network. Then all the vulnerable regions in G are trees if the adversary is well-behaved.
We use Lemmas1,2and Theorem2to prove a density bound on the equilibrium networks. Theorem 3. Let G = (V, E) be a Nash, swapstable or linkstable equilibrium network on
n≥4 vertices. Then|E| ≤2n−4 for any well-behaved adversary.
2.5. Connectivity and Social Welfare in Equilibria
The results of Section2.4show that despite the potential presence of cycles at equilibrium, there are still sharp limits on collective expenditure on edges in our game. However, they do not directly lower bound the welfare, due to connectivity concerns: if the graph could become highly fragmented after the attack, or is sufficiently fragmented prior to the attack, the reachability benefits to players could be sharply lower than in the attack-free reachability game. In this section we show that when CI and CE >1 are both constants with respect
In the original reachability game [9], themaximum welfare achievable in any equilibrium is n2−O(n). Here we will show that the welfare achievable in any “non-trivial” equilibrium is n2−O(n5/3). Obviously with no restrictions on the adversary and the parameters this cannot be true. Just as in the original game, forCE>1, the empty graph remains an equilibrium in
our game with respect to all the natural adversaries in Section 2.2. The empty graph has a social welfare of onlyO(n) (each vertex has an expected payoff of 1−1/n). We thus assume the equilibrium network contains at leastone edge and at leastone immunized vertex. We refer to all equilibrium networks that satisfy the above assumption asnon-trivial equilibria. They capture the equilibria that are new to our game compared to the original attack-free setting — the network is not empty, and at least one player has chosen immunization.
Limiting attention to non-trivial equilibria is necessary if we hope to guarantee that the welfare at equilibrium is Ω(n2) when CE > 1. Without the edge assumption, the empty
graph is an equilibrium with respect to several natural adversaries. Furthermore, without the immunization assumption, n/3 disjoint components where each component consists of 3 vulnerable vertices is an equilibrium (for carefully chosenCEand CI) with respect to e.g.
the maximum carnage adversary. In both cases, the social welfare is only O(n).
Similar to Section 2.4, to get any meaningful results for the welfare we need to restrict the adversary’s power. To simplify presentation, for the most of this section we state and analyze our results for the maximum carnage adversary. At the end of this section, we show how these results (or their slight modifications) can be extended to several other adversaries.
Consider any connected component that contains an immunized vertex and an edge in a non-trivial equilibrium network with respect to the maximum carnage adversary. We first show that any targeted region in such component (if exists) has size one whenCE>1.
Lemma 3. Let G be a non-trivial Nash or swapstable equilibrium network with respect to
the maximum carnage adversary. Then in any component ofGwith at least one immunized
We then show that non-trivial equilibrium networks with respect to the maximum car-nage adversary are connected when CE>1.
Theorem 4. Let Gbe a non-trivial Nash, swapstable or linkstable equilibrium network with
respect to the maximum carnage adversary. Then, G is a connected graph when CE>1.
Together, Lemma 3 and Theorem 4 imply that any non-trivial equilibrium network with respect to maximum carnage adversary is a connected network with targeted regions of size 1. Finally, we state our main result regarding the welfare in such non-trivial equilibria. Theorem 5. Let G be a non-trivial Nash or swapstable equilibrium network on n vertices
with respect to the maximum carnage adversary. If CE and CI are constants (independent
of n) and CE>1 then the welfare of Gis n2−O(n5/3).
Lastly, although non-trivial linkstable equilibrium networks with respect to the maximum carnage adversary are connected whenCE>1, the size of targeted regions in such networks
can be bigger than 1. So Theorem5 might not extend to such networks.
Remarks We proved our sparsity result with a rather mild restriction on the adversary. However, we presented our welfare results with respect to a very specific adversary – the maximum carnage adversary. The reader might have noticed that our proofs in this section essentially relied only on the following two properties of the maximum carnage adversary: (1) Adding an edge between any 2 vertices (at least 1 of which is immunized) does not change the distribution of the attack and (2) Breaking a link inside of a targeted region does not increase the probability of attack to the targeted region while at the same time does not decrease the probability of attack to any other vulnerable regions. These same properties hold for the random attack adversary and other adversaries that set the probability of attack to a vulnerable region directly proportional to an increasing function of the size of the vulnerable region. Thus our welfare results extend to random attack adversary and other such adversaries without any modifications.
wel-fare proofs are not directly applicable to such adversaries, it is still possible to reason about the welfare with respect to such adversaries using different techniques e.g. we can show that in any non-trivial and connected equilibrium with respect to the maximum disrup-tion adversary, when CE and CI are constants (independent of n) and CE > 1, then the
welfare isn2−O(n5/3). Note that this is slightly weaker than the statement with respect to the maximum carnage adversary, because we cannot show any non-trivial Nash equilibrium network with respect to the maximum disruption adversary is connected whenCE>1. We
leave the question of whether arguing about welfare is possible using unified techniques for a wide class of adversaries as future work.
2.6. Simulations
We complement our theory with simulations investigating various properties of swapstable best response dynamics. Again we focused on the maximum carnage adversary and im-plemented a simulation allowing the specification of the following parameters: number of players n; edge cost CE; immunization cost CI; and initial edge density. The first three of
these parameters are as discussed before but the last is new and specific to the simulations. Note that for any CE ≥ 1, empty graph is a Nash equilibrium. Thus to sensibly study
any type of best response dynamics, it is necessary to “seed” the process with at least some initial connectivity. As for motivation, one could view the initial edge purchases as occurred prior to the introduction of attack and immunization. We examine simulations starting both from very sparse initial connectivity and rather dense initial connectivity, for varying combinations of the other parameters. In all cases the initial connectivity was chosen randomly via the Erd˝os-Renyi model.
full Nash best response dynamics from a bounded rationality perspective. The phenomena we report on here appear to be qualitatively robust to a variety of natural modifications of the dynamics, such as restriction to linkstable best response, changes to the ordering of updates, and so on. Recall that all of our formal results hold for swapstable as well as Nash equilibria, so the theory remains relevant for the simulations.
Figure 4: Average number of rounds for swapstable convergence vs. n, forCE=CI= 2.
The first question that arises in the consideration of any kind of best response dynamic is whether and how quickly it will converge to the corresponding equilibrium notion. Inter-estingly, empirically it appears that swapstable best response dynamics always converges rather rapidly. In Figure 4 we show the average number of rounds to convergence over many trials, starting from dense initial connectivity (average degree 5), for varying values of n. The growth in rounds appears to be strongly sublinear in n (recall that each round updates allnplayers, so the overall amount of computation is still superlinear in n). Thus we conjecture the general and fast convergence of swapstable dynamics.
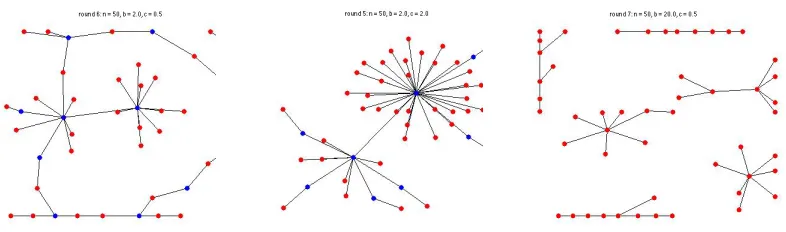
that need to be considered in the proofs. Figure 5shows a sampling of “typical” equilibria found via simulation forn= 50 and initial edge density of 1/(2n), which exhibit interesting asymmetries and illustrate the effects of the parameters.
Figure 5: Sample equilibria reached by swapstable best response dynamics forn= 50. Left: CE= 0.5,CI= 2. Middle: CE= 2,CI= 2. Right: CE= 0.5,CI= 20.
In the left panel of Figure 5, CE = 0.5 and CI = 2. Thus players have an incentive to
buy edges even to isolated vertices as long as they do not increase their vulnerability to the attack. In this regime, despite the initial disconnectedness of the graph, we often see equilibria with a long cycle (as shown), with various tree-like structures attached. In the middle panel we leftCI= 2 but increasedCEto 2. In this regime cycles are less common due
to the higher CE. The equilibrium illustrated is a tree formed by a connected “backbone”
of immunized players, each with varying numbers of vulnerable children. Finally, in the right panel we return to inexpensive edges (CE= 0.5), but greatly increased CI to 20. In
this regime, we see fragmented equilibria with no immunizations. We note that unlike the right example which istrivial, the examples in the left and middle are non-trivial equilibria with high social welfare as predicted by theory.
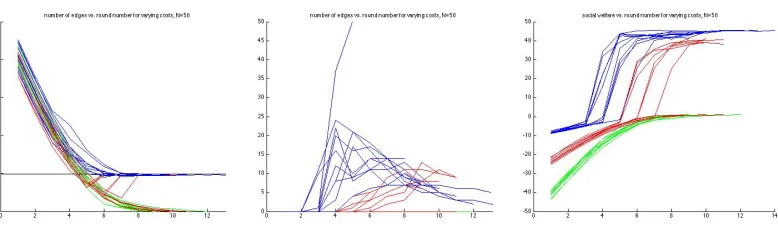
Figure 5 provides snapshots only at the conclusion of swapstable dynamics while Figure 6 examines entire paths, again at n = 50. We started from denser initial graphs (average degree 5), and each panel visualizes a different quantity per number of rounds, for 3 cost regimes: inexpensive cost CE = CI = 2 (blue); moderate cost CE = CI = 6 (red); and
Figure 6: Number of edges (left panel), number of immunizations (middle panel), and average welfare (right panel) vs. number of rounds, for N = 50 and varying values for CI
and CE. See text for discussion.
In the left panel, we show the evolution of the total number of edges (y axis) in the graph over successive rounds (x axis). In all regimes, there is initially a precipitous decline in connectivity, as the overly dense initial graph cannot be supported at equilibrium. So in the early rounds all players are dropping edges. The ultimate connectivity, however, depends on the cost regime. In the inexpensive regime, connectivity falls monotonically until it levels out very near the threshold for global connectivity at n−1 (horizontal black line), resulting in trees or perhaps just one cycle. In the moderate regime, we see a bifurcation; in some trials, connectivity fall all the way to the empty graph at equilibrium, while in others fall well below the n−1 tree threshold, but then “recover” back to that threshold (which we discuss shortly). In the expensive regime, all trials again result in a monotonic fall of connectivity all the way to the empty graph.
occurred (these remain at y = 0). In the expensive regime, no trials are visible because immunizations are never purchased.
Finally, the right panel shows the evolution of the average social welfare per player over successive rounds. In the inexpensive regime, welfare increase slowly and modestly from negative values in the initial graph, then increase dramatically as the benefits of immuniza-tion are realized. In the moderate regime, we see a bifurcaimmuniza-tion of welfare corresponding directly to the bifurcation of connectivity. In the expensive regime, all trials converge from below to the minimum (1-1/n) welfare of the empty graph. Again as theory suggested, the relationship between CE, CI and n is determining whether convergence is to a
non-trivial equilibrium and thus high social welfare, or to a highly fragmented network with no immunizations and low social welfare.
We conclude by noting that for many parameters, the dynamics above result in heavy-tailed degree distributions — a property commonly observed in large-scale social networks that is easy to capture in stochastic generative models (such as preferential attachment), but more rare in strategic network formation. Across 200 simulations for n = 100, CE = 0.5 and
CI= 2, we computed the ratio of the maximum to the average degree in each equilibrium
found. The lowest, average and maximum ratio observed were 6, 15.8, and 41, respectively (so the highest degree is consistently an order of magnitude greater than the average or more). Moreover, in all 200 trials the highest-degree vertex chose immunization, despite the average rate of immunization of 23% across the population. Thus an amplification process seems to be at work, where vertices that immunize early become the recipients of many edge purchases, since they provide other vertices connectivity benefits that are relatively secure against attack without the cost of immunization.
2.7. A Behavioral Experiment
science at the University of Pennsylvania. As training, participants were given a detailed document and lecture on the game, with simple examples of payoffs for players on small graphs under various edge purchase and immunization decisions. Participation was a course requirement, and students were instructed that their grade on the assignment would be exactly equal to their payoffs according to the rules of the game.
The payoffs used the maximum carnage adversary, with costs of CE = 5 and CI = 20.
With n= 118 participants (so a maximum connectivity benefit of 118 points), it felt that these values made edge purchases and immunization significant expenses and thus worth careful deliberation. Second, running swapstable best response simulations using these values generally resulted in non-trivial equilibria with high welfare, whereas raisingCE and
CIsignificantly generally resulted in empty or fragmented graphs with low welfare.
In a game of such complexity, with so many participants, it is unreasonable and uninteresting to formulate the experiment as a one-shot simultaneous move game. Rather, some form of communication must be allowed. We chose to conduct the experiment in a courtyard with the single ground rule thatall conversations be quiet and local i.e. in order to hear what a participant was saying to others, one should have to stand next to them.
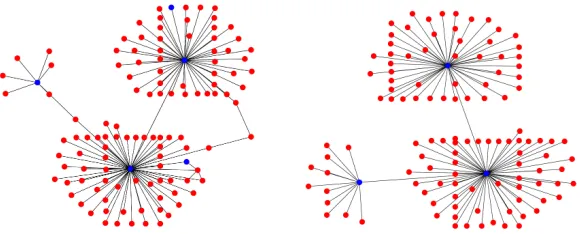
Figure 7: Left: the final undirected network formed by the edge purchases and immunization decisions (blue for immunized, red for vulnerable). Right: a “nearby” Nash network.
gather quickly in small discussion groups that reformed frequently, with subjects moving freely from group to group. It is clear from the outcome that despite adherence to the quiet rule, the subjects engaged in widespread coordination via this rapid mixing.
In the left panel of Figure 7, we show the final undirected network formed by the edge purchases and immunization decisions. The graph is clearly anchored by two main immu-nized hub vertices, each with many spokes who purchased their single edge to the respective hub. These two large hubs are both directly connected, as well as by a longer “bridge” of three vulnerable vertices. There is also a smaller hub with just a handful of spokes, again connected to one of the larger hubs via a chain of two vulnerable vertices.
For the payoffs, inspection of the network reveals that there are 2 groups of 3 vertices that are the largest vulnerable connected components, and thus are the targets of the attack. These 6 players are each killed with probability 1/2 for a payoff that is only half that of the wealthiest players (the vulnerable spokes of degree 1). In between are the players who purchased immunization including the 3 hubs and 2 immunized spokes. The immunized spoke of the upper hub is unnecessarily so, while the immunized spoke in the lower hub is best responding — had they not purchased immunization, they would have formed a unique largest vulnerable component of size 4 and thus been killed with certainty.
heavy-tailed degree distribution; a couple of cycles. To quantify how far the behavioral network is from equilibrium we use it as the starting point for swapstable best response dynamics and run it until convergence. In the right panel of Figure 7, we show the resulting network reached from the behavioral network in only 4 rounds of swapstable dynamics, and with only 15 of 118 vertices updating their choices. The dynamics clean up suboptimal behavioral decisions e.g. the vulnerable bridges between hubs are replaced by direct edges, the other targeted group of 3 spokes drops their fatal edges, and immunizing spokes no longer do so.
Participants were required to complete a survey after the experiment: they were asked to comment on any strategies they contemplated prior to the experiment; whether and how those strategies changed during the experiment; and what strategies or behaviors they observed in other participants.
Many subjects reported entering the experiment with not just a strategy for themselves, but also a “master plan” they hoped to convince others to join. One frequently reported plan involved variations on cycles. Though little thought seems to have been given to coordinating a global ordering in a cycle via only the quiet rule. Another frequently cited plan involved the hub-spoke. Although most strategies are based on abstractions, others reported planning to use social relationships e.g. connecting to students they know.
Of course, of particular interest are the surveys of the hubs. One seems to report an altruistic motivation for purchasing immunization, hoping to maximize welfare. In contrast, the other displays a Machiavellian attitude, willing to immunize in the hopes of creating 3 distinct groups of participants: the “winners” who would connect to the hub; the hub with slightly lower payoff; a large group of “losers” deliberately left out of the hub-spoke structure.
2.8. Conclusion and Discussion
We mention some areas for further study. Within our model, the question of whether swapstable best response provably converges (as seen empirically) is open. The benefit function considered here is one of many possible natural choices. It would be interesting to consider other functions. Another extension includesimperfect immunization which fails with some probability e.g. as a function of the amount of investment.
We mention two natural variants. The first is the combination of our original model with a standard diffusion model for the spread of attack. For example, combining with the in-dependent cascade model [61], when a targeted vertex is attacked, the infection spreads with probability p along the edges from the attacked point for which both endpoints are unimmunized. This spread then continues until we reach immunized vertices which again act as firewalls. Again different adversaries can have different objectives e.g. the maximum carnage adversary will pick an attack point which maximizes the expected spread. Wang et al. [87] showed that computing the spread in the independent cascade model is #P-complete. This suggests that even before considering the complexity of analysis, agents’ reasoning about the choice of attack by the adversary can become quite complicated. Fur-thermore, due to the probabilistic nature of the spread, it is nontrivial to establish any sparsity properties of the equilibria, because additional overbuilding might occur to hedge against uncertainty of how the infection will spread. Welfare is yet more difficult to an-alyze; unlike the deterministic spread, it is no longer obvious that a vertex likely to end up in a small component post-attack has a single fixed edge purchase that would greatly improve her utility, since different spread patterns can disconnect her from different regions. Regardless of these hurdles, in Chapter 3, we study the variant of the probabilistic spread under the random attack adversary.
of pairwise stability (see e.g. [49]). As a majority of our results hinge upon the analysis of unilateral deviations, our current analysis cannot be easily modified to accommodate this change. As a first step towards this goal, the game we study could be modified by adding a
Chapter 3
Network Formation Games with Attack and
Stochas-tic Spread
3.1. Introduction
We study a network formation game where strategic agents (vertices on a graph) receive both benefits and costs from forming connections to other agents. While various benefit functions exist in the literature [9,34], we focus on thereachability network benefit. Here, the benefit of an agent is the size of her connected component in the collectively formed graph. This models settings where reachability (rather than centrality) motivates joining the network, e.g. when transmitting packets over technological networks such as the Internet.
Most previous works feature a direct edge cost CE>0 for forming a link. Goyal et al. [42]
(Chapter2) depart from this notion by studying a game where forming links introduces an additional indirect cost by exposing agents to contagious network shocks. These indirect costs can model scenarios such as virus spread through technological or biological networks.
Our work continues this investigation of direct and indirect connection costs. To model the indirect cost we assume that, after network formation, an adversary attacks a single vertex uniformly at random. The attack then kills the vertex and spreads through the network via the independent cascade model according to parameterp[61]. This random attack and probabilistic spread captures the epidemiological quality of virus spread in both biological and technological networks.
et al. [42] study a reachability network formation game where an adversary inspects the formed network and then deliberately attacks a single vertex in the network. The attack then spreads deterministically to neighboring vertices according to a known rule, while agents may immunize against the attack for a fixed cost. Our game is most similar to the latter setting under a random adversary and high immunization cost. However, in our setting attacks spread probabilistically (through independent cascades) rather than deterministically. This yields an arguably more realistic model of infection spread but incurs additional complexity: computing the expected connectivity benefit of an agent in a given network is now #P-complete [87].
Goyal et al. [42] show that while more diverse equilibrium networks, including ones with multiple cycles, can emerge in addition to trees and the empty graph, the equilibrium net-works withnagents will have at most 2n−4 edges; less than twice the number of edges that can form in the equilibria of the attack-free game. Furthermore, they show that the social welfare is at least n2 −o(n5/3) in non-trivial equilibrium networks. Asymptotically, this is the maximum welfare possible achieved in any nonempty equilibrium of the attack-free game. In the regime where the cost of immunization is high, the game of Goyal et al. [42] only admits disconnected and fragmented equilibrium networks due to deterministic spread of the attack, and the social welfare of the resulting networks may be as low as Θ(n).
Our Results and TechniquesIn our game, computing utilities or even verifying network equilibrium is computationally hard. We circumvent this difficulty by proving structural properties for equilibrium networks. First, we provide an upper bound on the edge density in equilibria and show that any equilibrium network onnvertices has O(nlogn/p) edges.
To prove the density result, we first show that any equilibrium network with more than Ω(nlog(n/p)) edges contains an induced subgraph with large minimum cut size. We then show that if a network has large minimum cut size, inevery attack (with high probability), either almost all vertices in the network will die or almost all vertices in the network will survive. As a result, any vertex in the induced subgraph can beneficially deviate by dropping an edge. Together, these observations allows us to prove the claimed edge density bound.
Next, we show that any equilibrium network that is nontrivial (i.e. contains at least one edge) also contains a large connected component. Moreover, as long as the network is not too dense, it achieves a constant approximation to the best welfare possible of the attack-free game. More formally, any non-trivial equilibrium network over n vertices contains a connected component of size at least n/3. Furthermore, if the number of edges in the network is O(n/p), then the social welfare is Ω(n2).
To prove the welfare result, we first show that any agent in a small connected component can increase her connectivity benefits by purchasing an edge to a larger component without significantly increasing her attack risk. This implies the existence of a large connected component. We then use the large component to argue that when the equilibrium network is sparse, the surviving network post-attack still contains a large connected component. This guarantees large social welfare.
While Goyal et al. [42] show robustness of the structural properties of the original reacha-bility game of Bala and Goyal [9] to a variation with attack, deterministic spread and the option of immunization for players, we show robustness in another variant that involves a cascading attack but disallows immunization. However, on the technical front, the tools that we use to prove these robustness results are very different from the previous games.
with directions for future work in Section3.6.
3.2. Model
We start by formalizing our model for completeness. We assume the n vertices of a graph (network) correspond to individual players. Each player has the choice to purchase edges to other players at a fixed cost of CE > 0 per edge. Throughout we assume that CE is
a constant independent of n. Furthermore, we use the term high probability to refer to probability at least 1−o(1/n) henceforth.
A (pure) strategy si ⊆ [n] for player i consists of a subset of players to whom player i purchased an edge. Similar to Chapter2, we assume that edge purchases are unilateral i.e. players do not need approval to purchase an edge to another player but that the connectivity benefits and risks are bilateral.
Lets= (s1, . . . , sn) denote the strategy profile for all the players. Fixings, the set of edges
purchased by all the players induces an undirected graph. A game graph GG = (V, E) is defined to be the undirected graph induced by the edge purchases of all players.
Fixing a game graph G, the adversary selects a single vertex v ∈V uniformly at random to start the attack. The attack kills v and then spreads according to the independent cascade model with probabilityp∈(0,1) [61]. (Throughout we assume thatpis a constant independent of the number of players n. We discuss the regime in which p decreases as the number of players increases in Section3.4.1.) In the independent cascade model, in the first round, the attack spreads independently killing each of the neighbors of the initially attacked vertex v with probability p. In the next round, the spread continues from all the neighbors ofvthat were killed in the previous round. The spread stops when no new vertex was killed in the last round or when all the vertices are killed.
probabilityp. The adversary picks a vertexvuniformly at random to start the attack. The attack killsv and all the vertices in the connected component of G[p] that containsv.
LetCCi(v) denote the expected size of the connected component of playeripost-attack to a vertex v and we define CCv(v) to be 0. Then the expected utility (utility for short) of player iin strategy profiles denoted by ui(s) is precisely
ui(s) = 1 |V|
X
v∈V
CCi(v)− |si|CE.
The sum of utilities of all the players playings is defined to be thesocial welfare ofs.
Wang et al. [87] show that computing the exact spread of the attack in the independent cascade model is #P-complete in general. This implies that, given a strategy profiles, com-puting the expected size of the connected component of all vertices (and hence the expected utility of all vertices) is #P-complete. However, an approximation of these quantities can be obtained by Monte Carlo simulation.
We model each of thenplayers as strategic agents who deterministically choose which edges to purchase. A strategy profile s is a pure strategy Nash equilibrium if, for any player i, fixing the behavior of the other players to be s−i, the expected utility for i, ui(s), cannot strictly increase when playing any strategy s0i over si. We focus our attention to pure strategy Nash equilibrium (or equilibrium) in this work. Since computing the expected utilities in our game is #P-complete, even verifying that a strategy profile is an equilibrium is #P-complete. Hence as our main contribution, we prove structural properties for the equilibrium networks regardless of this computational barrier.
3.2.1. Related Work
networks is asymptoticallyn2−o(n2).
Second, Goyal et al. [42] study a network formation game where players in addition to hav-ing the option of purchashav-ing edges can also purchase immunization from the attack. Since we do not study the effect of immunization purchases in our game, our game corresponds to the regime of parameters in their game where the cost of immunization is so high that no vertex would purchase immunization in equilibria. Moreover, they study several dif-ferent adversarial attack models and our attack model coincides with their random attack adversary. The main difference between our work and theirs is that they assume the attack spreads deterministically while we assume the attack spreads according to the independent cascade model [61]. In many real world scenarios e.g. the spread of contagious disease over the network of people, the spread isnot deterministic. Hence our work can be seen as a first attempt to make the model of Goyal et al. [42] closer to real world applications. However, the change in the spread of attack comes with a significant increase in the complexity of the game as even computing the utilities of the players in our game is #P-complete. While Friedrich et al. [38] have shown that best responses for players can be computed in poly-nomial time under various attack models, the question of whether best response dynamics converges to an equilibrium network is open in the model of Goyal et al. [42].
enjoys a social welfare of Θ(n2) as long as the network contains at least one edge.
Kliemann [64] introduced a network formation game with reachability benefits and an at-tack on the formed network that destroys exactly one link with no further spread. Their equilibrium networks are sparse and also admit high social welfare as removing an edge can create at most two connected components. Kliemann et al. [65] extend this to allow attacks on vertices while focusing on swapstable equilibria.
Blume et al. [16] introduce a game with bilateral edge formation. They assume both edge and link failures can happen simultaneously but independent of the failures so far in the network. These differences make it hard to directly compare the two models.
Finally, network formation games, with a variety of different connectivity benefit models, have been studied extensively in computer science see e.g. [9,16,64]. We refer the reader to the related work section in Chapter 2 for a comprehensive summary of other related work especially on the topic of optimal security choices for networks.
3.3. Examples of Equilibrium Networks
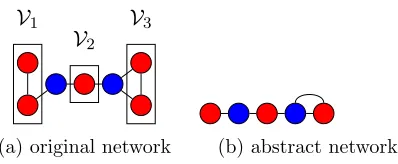
In this section we show that a diverse set of topologies can emerge in the equilibrium of our game. Similar to the models of Bala and Goyal [9] and Goyal et al. [42] the empty graph can form in the equilibrium of our game whenCE≥1. Moreover, similar to both models, trees
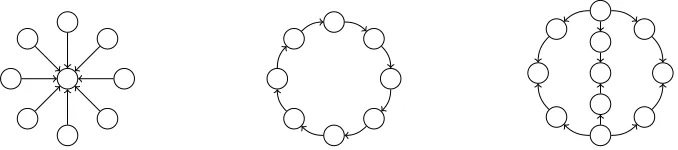
can form in equilibria (See the left panel of Figure 8). Finally, while Goyal et al. [42] show that in the regime of their game where the cost of immunization is high (so no vertex would immunize) no connected network can form in equilibria due to the deterministic spread of the attack, we show that connected networks indeed can form in our game (See Figure 8).
We remark that pure strategy equilibria exist in all parameter regimes of our game. When CE ≥1, the empty network can form in equilibria for allp. When CE <1 a cycle or two
Figure 8: From left to right: hub-spoke, cycle and linear-paths network. A directed arrow determines the vertex that purchases the edge.
Examples in Figure 8 show that denser networks can form in equilibria compared to the model of Bala and Goyal [9] and the high immunization cost regime of the model of Goyal et al. [42]. So we ask how dense equilibrium networks can be in Section 3.4 and show an upper bound ofO(nlogn) on the density of the equilibrium networks. Since the examples in Figure 8have Θ(n) edges, our upper bound is tight up to a logarithmic factor.
Moreover, while all the equilibrium networks in Figure 8 are connected, there might still exist equilibrium networks in our game that are highly disconnected. In Section3.5we show that any equilibrium network with at least one edge contains a large connected component. However, even with the guarantee of a large connected component, there might still be concerns that the equilibrium networks can become highly fragmented after the attack. We show that as long as the equilibrium network is not too dense, the social welfare is lower bounded by Θ(n2) i.e. a constant fraction of the social welfare of the attack-free game.
These structural results are obtained despite the computational hardness of equilibrium verification. We view these results as are our most significant technical contributions.
3.4. Edge Density
We now analyze the edge density of equilibrium networks.
Theorem 6. Any equilibrium network on nvertices has O(nlogn/p) edges.