Conceptual Design of a Dispersion Interferometer Using a Ratio of
Modulation Amplitudes
Tsuyoshi AKIYAMA, Kazuo KAWAHATA, Shigeki OKAJIMA
1)and Kazuya NAKAYAMA
1)National Institute for Fusion Science, 322-6 Oroshi-cho, Toki 509-5292, Japan
1)Chubu University, 1200, Matsumoto-cho,Kasugai 487-8501, Japan
(Received 5 January 2009/Accepted 11 May 2009)
Since a dispersion interferometer is free from mechanical vibrations, it does not need a vibration compensa-tion system even for a probe beam with a short wavelength. This paper describes a new signal processing of the dispersion interferometer using a ratio of modulation amplitudes with a photoelastic modulator. The proposed method is immune to changes in detected signal intensities, thus making the signal processing system simple. Designs of the optical system of the dispersion interferometer for proof of principle, especially specification of a nonlinear optical crystal, are also shown.
c
2010 The Japan Society of Plasma Science and Nuclear Fusion Research
Keywords: interferometer, dispersion interferometer, non-linear crystal, photoelastic modulator, CO2laser
DOI: 10.1585/pfr.5.S1041
1. Introduction
High reliability and resolutions are required for elec-tron density measurements in fusion devices in order to control plasmas and understand plasma physics.
Conventional heterodyne interferometry is widely used and has a high-density resolution. It, however, in a high-density range suffers from fringe jump errors, which degrade the interferometer’s reliability. Recently, the Large Helical Device (LHD) developed a high-density operation regime whose central electron density is up to several times 1020m−3[1], and the expected density range in ITER is about 1×10²⁰m−3[2]. Consequently, the prob-lem of fringe jump is becoming more significant. While a short-wavelength laser can reduce probabilities of fringe jumps, phase errors caused by mechanical vibrations be-come significant. They have to be suppressed with a vi-bration isolator or be compensated for by adopting two-color interferometry, which consists of two probe beams (light sources) with different wavelengths. Even then, it is difficult to eliminate the vibration components completely because of slight differences in the optical path and wave-fronts of the probe beams. Besides, an optical system be-comes complex and expensive.
One candidate for a solution is a density measurement with a polarimeter based on the Faraday effect [3–5] or the Cotton–Mouton effect [6–8]. Although density resolutions of polarimeters are less than those of interferometers, po-larimeters do not suffer from fringe jump errors and are in principle immune to mechanical vibrations.
Another candidate for a solution is a dispersion in-terferometer [9]. It is also insensitive to mechanical vi-brations, and hence does not need the vibration isolator
author’s e-mail: [email protected]
and the two-color interferometry system even if a short-wavelength laser, a CO2laser or a Nd:YAG laser, is used.
This paper describes a new signal processing of the dispersion interferometer using a ratio of modulation am-plitudes. The proposed method simplifies the signal processing and can remove measurement errors due to changes in the detected signal intensity. Section 2 briefly explains the principle of the dispersion interferometer and the new proposed signal processing. Section 3 shows a de-sign of the proposed dispersion interferometer for the proof of the principle. Section 4 contains a summary.
2. Principle of a Dispersion
Interfer-ometer
Dispersion interferometers were proposed in the early 1980s [10, 11] and were used for density measurements of laser-produced plasmas, contouring the surface of three-dimensional objects and so on. Physical quantities to be measured were evaluated from the interferogram. In the 1990s, dispersion interferometers were adopted for mea-surements of the line averaged electron density of fu-sion plasmas (the mirror device: the gas-dynamic trap de-vice) [9]. As described in Sec. 2.1, the density was ob-tained from the phase shift of the interference signal, which was almost the same as that of a homodyne interferome-ter. Later, the phase modulation technique [12] was intro-duced to the dispersion interferometer on TEXTOR in or-der to overcome the disadvantages of homodyne detection as shown in Sec. 2.2. The new signal processing method proposed in this paper is shown in Sec. 2.3. It is a simple technique to improve phase resolution for the above dis-persion interferometer with a phase modulation.
c
2010 The Japan Society of Plasma
Fig. 1 Basic dispersion interferometer.
2.1
Basic dispersion interferometer
Figure 1 demonstrates the principle of the basic dis-persion interferometer [9]. A probe beam with an angu-lar frequencyωpasses through a type-I nonlinear crystal to generate the second harmonic with a polarization an-gle perpendicular to that of the fundamental. The fun-damental and the second harmonic components propagate along almost the same optical path. Phase shifts due to changes in the optical path lengthΔd by mechanical vi-brations are ωΔd/c and 2ωΔd/c, respectively. The phase shifts due to a plasma arecpn¯eL/ωandcpn¯eL/(2ω), where
cp =e2/(2ε0mec), ¯neis the line averaged electron density, andLis the optical path length in the plasma. After pass-ing through the plasma, the second harmonic is generated from the fundamental again with the other nonlinear crys-tal. The remaining fundamental, which is not converted into the second harmonic, is cut by a following filter and only the second harmonics go into the detector. Phases of these second harmonicsϕ1 andϕ2 (second harmonics
which are generated by the first and the second nonlinear crystals are noted as 1 and 2, respectively) are given as fol-lows:
ϕ1 =2(ωt+ωΔd/c+cpn¯eL/ω+φ1),
ϕ2 =2ωt+2ωΔd/c+cpn¯eL/(2ω)+φ2,
(1) whereφ1 andφ2 are initial phases of second harmonics.
The detected interference signalI between these second harmonic components becomes
I=A+Bcos (ϕ1−ϕ2)=A+Bcos
⎛ ⎜⎜⎜⎜⎜
⎝32cpωn¯eL+φ ⎞ ⎟⎟⎟⎟⎟ ⎠,
A=I1+I2, B=2
I1I2, (2)
I1,I2: intensities of second harmonics,φ=2φ1−φ2.
As shown in Eq. (2), the phase shift due to vibrations is canceled out automatically. Therefore, the phase of the in-terference signal is determined by only the dispersion of the plasma and is free from vibrations even with short-wavelength lasers.
2.2
Dispersion interferometer with a phase
modulation
As Eq. (2) is almost the same as the interference sig-nal of a homodyne interferometer, the basic dispersion in-terferometer has the same disadvantages as the homodyne
ones: (i) restriction of phase where Eq. (2) is a monotonic function and (ii) the necessity for calibration experiments of the detected intensityAandBand their variations dur-ing discharges lead to phase errors. The phase modula-tion method [12] with an electro-optical modulator (EOM) can reduce the influence of the intensity variations. The EOM, operating with a drive signal ofπsinΩt, is inserted between the first nonlinear crystal and the plasma. It gives a phase modulation ofπsinΩtonly for the second harmon-ics. As a result, the detected modulated interference signal
Ipmcan be given by
Ipm=A+Bcos πsinΩt+ 3 2
cpn¯eL ω +φ
. (3)
Ipmis directly digitized with a higher sampling frequency thanΩ. Because of phase modulation, the amplitude of
Ipmchanges between the maximum (A+B) and the mini-mum (A−B).AandBare assumed to be constant during one modulation period and are evaluated from the digitized signal. ThenAis subtracted from the digitized signal and the amplitude ofIpmis normalized byB. The drive signal of the EOM is also digitized coincidently, and the timest0
when sinΩt0 = 0 are determined. Att0, the normalized
signalInorm
pm is given by
Inormpm =cos 3 2
cpn¯eL ω +φ
. (4)
¯
necan be calculated from the arccosine of Eq. (4).
2.3
Dispersion interferometer using a ratio
of modulation amplitudes
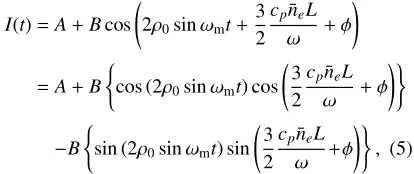
Figure 2 shows a schematic view. A photoelastic modulator (PEM) with a stable modulation frequency is adopted for the phase modulation instead of the EOM. The modulator axis of the PEM is arranged parallel to the po-larization direction of the fundamental to give phase mod-ulations to only the fundamental. In this configuration, an interference signalI(t), almost the same as Eq. (3), is given by,
I(t)=A+Bcos 2ρ0sinωmt+
3 2
cpn¯eL ω +φ
=A+B
cos (2ρ0sinωmt) cos
3 2
cpn¯eL ω +φ
−B
sin (2ρ0sinωmt) sin
3 2
cpn¯eL ω +φ
, (5) whereρ0 is the maximum retardation of the PEM,
deter-mined by the voltage applied to the PEM, andωm is the
modulation frequency of the PEM. Here, cos(2ρ0sinωmt)
and sin(2ρ0sinωmt) can be expanded with the Bessel
func-tion of order of nJn.
cos (2ρ0sinωmt)=J0(2ρ0)+2
∞
n=1
J2n(2ρ0) cos (2nωmt),
sin (2ρ0sinωmt)=2
∞
n=1
J2n−1(2ρ0) sin{(2n−1)ωmt}.
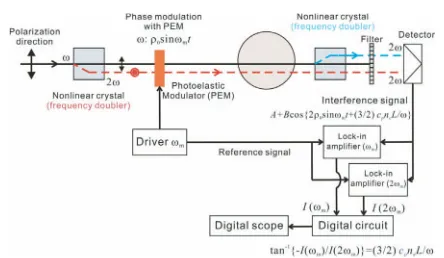
Fig. 2 Dispersion interferometer with a photoelastic modulator (PEM) and signal processing using a ratio of modulation amplitudes.
In this way, the detected interference signalI(t) can be ex-panded with harmonics ofωm. The following amplitudes
of fundamental and second harmonicsIωm andI2ωmof the
modulation frequencyωm can be measured with lock-in
amplifiers.
Iωm=−2BJ1(2ρ0) sin
⎛ ⎜⎜⎜⎜⎜
⎝32cpωn¯eL+φ ⎞ ⎟⎟⎟⎟⎟ ⎠,
I2ωm=2BJ2(2ρ0) cos
⎛ ⎜⎜⎜⎜⎜
⎝32cpωn¯eL+φ ⎞ ⎟⎟⎟⎟⎟ ⎠.
(7)
From the ratio of these amplitudes, ¯necan be obtained. ¯
ne= 2 3
ω
cpL
tan−1 Iωm
I2ωm
−φ
. (8)
Here,ρ0is set at 1.3 radians by applying adequate voltage
to the photoelastic material forJ1(2ρ0) = J2(2ρ0). Since
tangent diverges at±π/2, if necessary, the initial phase may be adjusted by inserting a phase object after the filter.
An ellipsometer similarly uses sinusoidal phase mod-ulation and harmonics for accurate measurement of the po-larization state. This new method of phase extraction is completely free from variations of detected intensitiesA
andB. In addition, the processing is simple and suited to real time measurements.
3. Conceptual Design of a Dispersion
Interferometer Using the Ratio of
Modulation Amplitude
To prove the principle, we are designing a disper-sion interferometer with a CO2laser whose wavelength is
10.6µm. The dispersion interferometer on TEXTOR also uses the CO2laser [12]. The CO2laser to be used is a
GN-802-GES (MPB Technology Inc.) with an output power of 7.5 W or an LC-25 (DEOS) with 25 W. Either one of them will be selected depending on its signal-to-noise ratio (SNR). An important component for a good SNR is a non-linear crystal for second-harmonic generation (SHG), be-cause the power of the second harmonics depends strongly on the specifications of the nonlinear crystal.
Table 1 Parameters of AgGaSe2for 10.6µm.
Transparency (µm) 0.8-18
Refractive index no(10.6µm) 2.5912
Refractive index ne(10.6µm) 2.5579
Refractive index no(5.3µm) 2.1634
Refractive index ne(5.3µm) 2.5808
deff(definition:P=dE2) 2.47×10⁻²²
Surface damage threshold Psd
(kW/cm2, CW) 33-45
Thermal-lensing threshold Pl
(kW/cm2) 2
Thermal conductivity (W/cm/K) 0.011
3.1
Design of a nonlinear crystal for SHG
Silver gallium selenide (AgGaSe2) is commonly used
for SHG of 10.6µm laser light. Table 1 [13–15] summa-rizes its properties. The conversion efficiencyη=P2ω/Pω,
whereP2ω andPωare the powers of the second harmonic
and the fundamental, respectively, is given by [15]
η=2 ⎛ ⎜⎜⎜⎜⎜ ⎝εμ
0
⎞ ⎟⎟⎟⎟⎟ ⎠
3/2
ω2d2 effl
2
n3
⎛ ⎜⎜⎜⎜⎜ ⎝πPwω2
0
⎞ ⎟⎟⎟⎟⎟
⎠⎧⎪⎪⎨⎪⎪⎩sin (ΔΔklkl/2/2)⎫⎪⎪⎬⎪⎪⎭
2
,
Δk≡k2ω−2kω,
(9)
wheredeff is the effective nonlinearity, l is the length of
the crystal, n is the refractive index of the fundamental,
w0is the beam waist (1/e2 power radius), andk2ωandkω
are wavenumbers of the second harmonics and the fun-damental, respectively. The last term that includes Δk
stands for the phase matching condition. As mentioned in Sec. 3.2, that condition is determined by the angle be-tween the beam path and the optic axis of the crystal. Here, the phase matching condition is assumed to be satisfied; the term is unity. It is noted that Eq. (9) presumes a plane wave for incident light. This is approximately valid when the length of the crystal is less than the confocal focusing lengthz0=πw20n/λof the Gaussian beam.
In general, η for continuous-wave (cw) laser light is small (on the order of 0.1%). To improve the SNR, it is favorable to increase the power of the second harmonic as much as possible. Eq. (9) indicates thatη increases with the power density of the incident beam. On the other hand, there are some limitations in the power density and the crystal length as follows.
The maximum power density P0 = 2Ptotal/(πw20) of
the focused Gaussian beam into the nonlinear crystal should be smaller than the surface damage thresholdPsdof
33 kW/cm2for a cw laser. Here,P
totalis the total incident
power. In the case of AgGaSe2, the thermal-lensing effect,
which decreases the SHG efficiency, should be considered because of the small thermal conductivity of AgGaSe2. A
thresholdPlfor the thermal-lensing effect of 2 kW/cm2is
reported in Ref. 13 and is smaller thanPsd. Thus,
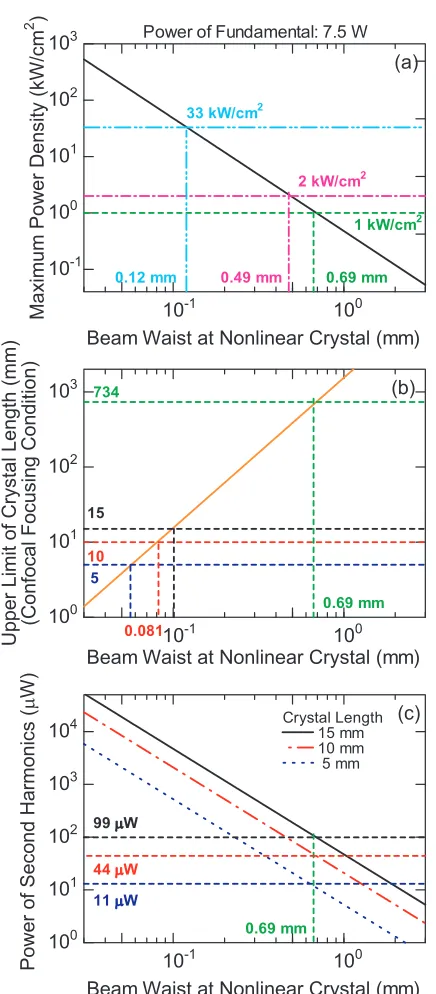
Fig. 3 Dependence of (a) maximum power density, (b) upper limit of crystal length, and (c) power of second harmonic component on a beam waist at a nonlinear crystal in the case of an incident beam with a power of 7.5 W. The non-linear crystal is AgGaSe2.
maximum power density is set at half ofPl, 1 kW/cm2, for
safety. The resultant beam waist is 0.69 mm, as shown in Fig. 3 (a), for a total incident power of 7.5 W.
The commercially available length of the AgGaSe2
crystal is less than about 20 mm at present. The upper limit of the crystal length, determined by the confocal focusing length, is much larger than the available length for a beam waist of 0.69 mm, as shown in Fig. 3 (b).
Figure 3 (c) shows the power of the generated
sec-ond harmonic calculated with Eq. (9). In the case of a 15 mm-long crystal, 99µW is generated from an incident beam with a power of 7.5 W and beam waist of 0.69 mm. The transmissivity at the second harmonic of zinc selenide (ZnSe) with anti-reflection coating at the fundamental, which is used for the PEM and two vacuum windows (not shown in Fig. 2), is about 0.65. The transmissivity of an IR filter made of sapphire that eliminates the fundamental (see Fig. 2) is about 0.7. As a result, the total transmissiv-ity of the second harmonics that are generated in the first nonlinear crystal is 0.653×0.7 = 0.19. When the
ther-moelectrically cooled IR photovoltaic detector PVI-3TE-5 (Vigo system, responsivity=2 (A/W)) and the preampli-fier STCC-04 (Vigo system, transimpedance=105(V/A))
are used, the output voltagesI1andI2become as follows.
I1=(99×10−6)×0.19×2×105=3.8V,
I2=(99×10−6)×0.7×2×105=14V.
Considering the efficiency of interference, the reflectivity of mirrors, and so on, the detected power will be slightly smaller. Nevertheless, these generated powers of the sec-ond harmonics are enough to be detected.
3.2
Phase matching condition
The second harmonic is continuously generated along the optical path in the nonlinear crystal. If phases of the second harmonics which are generated at the entrance and the central region in the crystal are different, they interfere with each other and the total power of the second harmonic decreases. In order to suppress that interference, the phase of the second harmonic should be matched (phase match-ing condition). For that purpose, the fundamental is in-jected into the crystal at a certain angleθmagainst the
op-tic axis of the crystal to satisfyn(2eω) = n (ω)
o based on the
birefringence. In the case of the type-I nonlinear crystal, the fundamental and the second harmonic are ordinary and extraordinary waves, respectively.θmis given by following
expression [15].
sin2θm=
n(oω)
−2
−n(2oω)
−2
n(2eω)
−2
−n(2oω)
−2 . (10)
Assigning refractive indexes, θm of AgGaSe2 becomes
55.4 deg.Δkis also given by
Δkl/2≈−ωl
c sin(2θm)
n(2eω)
−2
−n(2oω)
−2
2n(oω)
−3 (θ−θm),
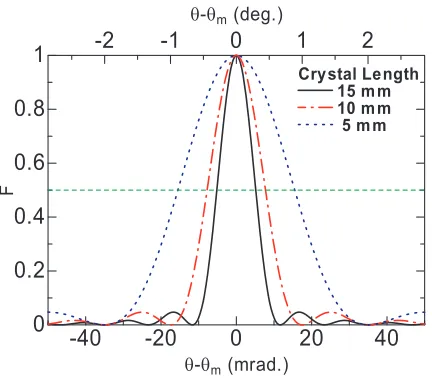
(11) andF={sin(Δkl/2)/(Δkl/2)}2is plotted in Fig. 4. The half
Fig. 4 Phase matching condition for AgGaSe2.
of 0.01 deg., in the case of a LHD plasma with a density profile of 1×10²⁰(1−ρ8) m−3. However, it may become
significant to the reduction of the SHG in higher-density range, where the beam bending angle becomes larger.
3.3
Potential problems
Because the power of the second harmonic is propor-tional to P2ω, beam dividing for multi-channel measure-ment strongly affects the SHG at the second nonlinear crys-tal. The possible number of channels will be determined by the laser power, efficiency of SHG, sensitivity of the detec-tor, and so on.
Displacement of the fundamental and the second har-monic beams decreases interference and the accuracy of vibration-cancelation. The displacement is caused by ef-fects of walk-offin the nonlinear crystal and differences in the beam refraction in plasmas. In our system, beam displacements are estimated to be less than about 0.2 mm, much smaller than an expected beam radius of about 10 mm for either effect. However, displacement may be-come significant in the case of a long beam transmission or a large wedge angle of vacuum windows.
4. Summary
A dispersion interferometer is a candidate for reliable electron density measurement. We propose the dispersion interferometer using a ratio of modulation amplitudes with
a PEM. This method removes measurement errors due to changes in the detected signal intensity and makes the sig-nal processing simple and easily applicable in real time feedback control. AgGaSe2 is selected for SHG of CO2
laser light. The power of the second harmonics is esti-mated for proof of the principle experiments.
Acknowledgements
This work was supported by Grant-in-Aid for Young Scientists (B) (20760584) and partly by Grant-in-Aid for Scientific Research on Priority Areas “Advanced Diagnos-tics for Burning Plasmas” (16082208).
[1] N. Ohyabu, T. Morisaki, S. Masuzaki, R. Sakamoto, M. Kobayashi, J. Miyazawa, M. Shoji, A. Komori, O. Motojimi and LHD Experimental Group, Phys. Rev. Lett.
97, 055002 (2006).
[2] Y. Shimomura, R. Aymar, V.A. Chuyanov, M. Huguet, H. Matsumoto, T. Mizoguchi, Y. Murakami, A.R. Polevoi and M. Shimada, Nucl. Fusion41, 309 (2001).
[3] Y. Kawano, S. Chiba and A. Inoue, Rev. Sci. Instrum.72, 1068 (2001).
[4] T. Akiyama, K. Kawahata, Y. Ito, S. Okajima, K. Nakayama, S. Okamura, K. Matsuoka, M. Isobe, S. Nishimura, C. Suzukiet al., Rev. Sci. Instrum.77, 10F118 (2006).
[5] M. A. Van Zeeland, R. L. Boivin, T. N. Carlstrom and T. M. Deterly, Rev. Sci. Instrum.79, 10E719 (2008). [6] Ch. Fuchs and H. J. Hartfuss, Phys. Rev. Lett.81, 1626
(1998).
[7] T. Akiyama, K. Kawahata, Y. Ito, S. Okajima, K. Nakayama, S. Okamura, K. Matsuoka, M. Isobe, S. Nishimura, C. Suzukiet al., Rev. Sci. Instrum.77, 10F118 (2006).
[8] A. Boboc, L. Zabeo and A. Murari, Rev. Sci. Instrum.77, 10F324 (2006).
[9] V. P. Drachev, Yu. I. Krasnikov and P. A. Bagryansky, Rev. Sci. Instrum.64, 1010 (1993).
[10] F. A. Hopf, A. Tomita and G. Al-Jumaily, Optics letters5, 386 (1980).
[11] Kh. P. Alum, Yu. V. Koval’chuk and G. V. Ostrovskaya, Sov. Tech. Phys. Lett.7, 581 (1981).
[12] P. A. Bagryansky, A. D. Khilchenko, A. N. Kvashninet al., Rev. Sci. Instrum.77, 053501 (2006).
[13] S. Ya Tochitsky, V. O. Petukhov, V. A. Gorobets, V. V. Chuakov and V. N. Jakimovich, Appl. Optics 36, 1882 (1997).
[14] Cleverland Crystals Inc.