Threat
Modeling
for
Cloud
Infrastructures
Nawaf
Alhebaishi
1,2,∗,
Lingyu
Wang
1,
Anoop
Singhal
31ConcordiaInstituteforInformationSystemsEngineering,ConcordiaUniversity,Montreal,H3G1M8,Canada 2FacultyofComputingandInformationTechnology,KingAbdulazizUniversity,Jeddah,SaudiArabia
3ComputerSecurityDivision,NationalInstituteofStandardsandTechnology,Gaithersburg,20899,USA
Abstract
Today’s businesses are increasingly relying on the cloud as an alternative IT solution due to its flexibility and lower cost. Compared to traditional enterprise networks, a cloud infrastructure is typically much larger and more complex. Understanding the potential security threats in such infrastructures is naturally more challenging than in traditional networks. This is evidenced by the fact that there are limited efforts on threat modeling for cloud infrastructures. In this paper, we conduct comprehensive threat modeling exercises based on two representative cloud infrastructures using several popular threat modeling methods, including attack surface,attacktrees,attackgraphs,andsecuritymetricsbasedonattacktreesandattackgraphs,respectively. Thosethreatmodelingeffortsmayprovidecloudprovidersusefullessonstowardbetterunderstandingand improvingthesecurityoftheircloudinfrastructures.Inaddition,weshow howhardeningsolutioncan be applied basedonthe threatmodelsand securitymetrics throughextendedexercises.Suchresults maynot onlybenefitthecloudproviderbutalsoembedmoreconfidenceincloudtenantsbyprovidingthemaclearer pictureofthepotentialthreatsandmitigationsolutions.
Receivedon27 November 2018;acceptedon19 December 2018;publishedon21 December 2018
Keywords: ThreatModeling,CloudInfrastructure,AttackSurface,AttackTree,AttackGraph,SecurityMetrics,Network Hardening
Copyright©2018NawafAlhebaishietal.,licensedtoEAI.Thisisanopenaccessarticledistributedunderthetermsof
theCreativeCommonsAttributionlicense(http://creativecommons.org/licenses/by/3.0/),whichpermitsunlimited
use,distributionandreproductioninanymediumsolongastheoriginalworkisproperlycited. doi:10.4108/eai.10-1-2019.156246
1. Introduction
Cloud computing has emerged as an alternative IT solu-tion for many enterprises, government agencies, and organizations due to its flexibility and reduced costs. The shifting to this new paradigm, however, might still be impeded by various security and privacy concerns of the cloud tenants, especially considering the lack of transparency in the underlying cloud infrastruc-tures. In contrast to traditional enterprise networks, the increased complexity of cloud infrastructures implies that security flaws may still be present and unde-tected despite all the security solutions deployed inside the cloud; moreover, the complexity may also lead to new challenges in systematically understanding the potential security threats. For instance, unlike tradi-tional enterprise networks, cloud data centers usually exhibit unique characteristics including the presence
∗Corresponding author. Email:[email protected]
of significant similarity in terms of hardware config-urations (e.g., server blades inside a rack), and the co-existence of both physical and virtual components. Such unique characteristics may imply novel challenges and opportunities in applying existing threat modeling techniques to cloud infrastructures, which motivates our study.
On the other hand, modeling security threats for cloud infrastructures also faces a practical challenge, i.e., there lack public accesses to detailed informa-tion regarding hardware and software configurainforma-tions deployed in real cloud data centers. Existing work mainly focuses on either high-level frameworks for risk and impact assessment [1] and general guidelines for cloud security metrics [2,3], or very specific vulnerabil-ities or threats in the cloud [4,5] (a more detailed review of related work will be given in Section7). To the best of our knowledge, there lacks a concrete study on threat modeling for cloud data centers using realistic cloud infrastructures and well-established models. Although there already exist a number of threat modeling models,
Research Article
such as attack surface, attack tree, attack graph, and various security metrics, a systematic application of those models to concrete cloud infrastructures is yet to be seen.
In this paper, we present a comprehensive study on applying threat modeling techniques to cloud infras-tructures. We first provide the basis of our study as two representative cloud infrastructures. Those infrastruc-tures are devised based on fictitious but realistic cloud data centers by integrating established technologies of several major players in the cloud market, e.g., Amazon, Microsoft, Google, Cisco, VMware, and OpenStack. We provide details on the hardware and software com-ponents used in the data center to manage the cloud services, such that the infrastructures may facilitate our later application of threat models at different abstrac-tion levels (e.g., while attack surface and trees focus on hardware and software components, attack graphs involve lower-level details including specific vulnera-bilities in those components). We then apply several popular threat modeling methods on such cloud infras-tructures, including attack surface, attack tree, attack graph, and security metrics based on attack trees and attack graphs. Furthermore, we discuss the application of network hardening solutions for improving the secu-rity based on the threat modeling results. During the application of those models, we discuss detailed results and challenges as well as general lessons that can be taken based on those exercises.
The main contribution of this paper is twofold. First, to the best of our knowledge, this is the first comprehensive study of threat modeling that not only covers many well-established models, but also is based on concrete cloud infrastructures incorporating technologies used by major cloud providers. Second, our study can provide insights to many practical questions, such as, What kind of information could be relevant to the security of cloud infrastructures? How can cloud providers model the security of a cloud data center
at different abstraction levels? How can cloud providers
measure the security of their cloud data center before and
after applying a hardening option? Such insights can
not only benefit cloud providers in understanding and improving the security of their cloud infrastructures but may also embed more confidence in cloud tenants by providing them a clearer picture of potential threats to cloud infrastructures.
The preliminary version of this paper has previously appeared in [6]. In this paper, we have substantially improved and extended the previous version. The most significant extensions are the following. First, in the new Section 6, we take the threat modeling results into action by demonstrating in three use cases how different hardening options can be applied to mitigate security threats in cloud infrastructures. Second, for the application of the attack surface model (Section 4.1),
we have elaborated on the three types of attack surface which can be potentially used by attackers with different roles and privileges. Third, in the application of attack trees and attack graphs (Section 4.2 and Section 4.3), we have introduced new cases that focus on the unique aspects of cloud infrastructures, such as virtualization and configuration similarity. In addition, we have extended our study to different types of attackers under different roles and initial privileges (insider attacks). Finally, we have now provided general lessons and guidelines based on the discussion of concrete examples throughout Sections4and5, which may benefit cloud providers even though the specific details of their cloud infrastructures may differ from ours.
The remainder of this paper is organized as follows. Section2provides the background knowledge on threat modeling and security metrics needed later in our work. In Section3, the cloud architectures are presented. In Section4, the threat modeling is explained in details. In Section5, security metrics are applied to quantitatively model the threats. In Section6, we discuss mitigation of the modeled threats through hardening options. Related work is reviewed in Section 7, and the paper is concluded in Section8.
2. Background
This section briefly reviews several popular threat models and existing security metrics that will be applied in this paper, including attack surface, attack tree, attack graph, attack tree-based metric (ATM), and Bayesian network (BN)-based metric.
– Attack surface: Originally proposed as a metric for software security, an attack surface captures software components that may lead to potential vulnerabilities, including entry and exit points (i.e., methods in a software program that either take user inputs or generate outputs), communication channels (e.g., TCP or UDP), and untrusted data items (e.g., configuration files or registry keys read by the software) [7]. Since the attack surface requires examining the source code of a software, due to the complexity of such a task, most existing work applies the concept in a high-level and intuitive manner. For example, six attack surfaces are said to exist between an end user, the cloud provider, and cloud services [8], although the exact meaning of such attack surface is not specified.
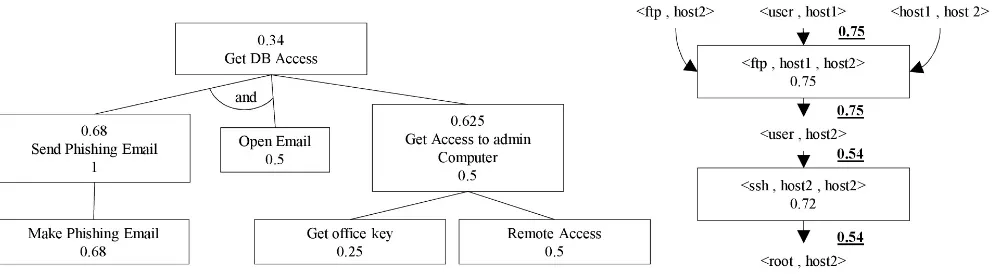
Figure 1. Examples of Attack Tree
Figure 1 shows an attack tree example in which the attacker’s goal is to get accesses to the database. In the example, there are two ways to reach the root node (the goal). First, the attacker can follow the left and middle paths at the same time (due to the and label), or the attacker can follow the right path for reaching the root node.
– Attack graph: As a more fine-grained model, an attack graph depicts all possible attack steps and their causal relationships [10]. In Figure 2, each triplet inside a rectangle indicates an exploit
<service vulnerability, source host, destination host>, and each pair in plaintext indicates a pre- or post-condition <condition, host> of the exploits. The logic relationships between the nodes are represented as edges, where an exploit can be executed if and only if all of its pre-conditions are already satisfied (e.g., In Figure2, the first exploit requires all three pre-conditions to be satisfied), whereas a condition may be satisfied by one exploit for which the former is a post-condition.
– While the above threat models are all qualitative in nature, they may be extended to quantitatively measure the level of security. The attack tree-based metric (ATM) quantifies the threat in an attack tree using the concept of probability of
success [11]. The probability of each node in
the attack tree is typically determined based on historical data, expert opinions, or both. In
Figure 2. Examples of Attack Graph
Figure 1, a number above the label represents the overall probability of success, and a number below the label represents the probability of each node alone. The probability on the root node indicates the riskiest path, i.e., the path with the highest probability. In Figure1, this corresponds to the conjunction (indicated by the “and”) of the left and middle paths, with a probability of 0.5×0.68 = 0.34 (a more detailed explanation will be given in Section 5.1), which should be prioritized in security hardening. The BN-based metric [12,13] can be applied to attack graphs to calculate the probability for an average attacker to compromise a critical asset. The conditional probabilities that an exploit can be executed given its pre-conditions are all satisfied can usually be estimated based on standard vulnerability scores (e.g., the CVSS scores [14]). In Figure 2, the probability inside a rectangle is the CVSS score divided by 10 (the domain size of those scores), and each underlined number represents the probability for successfully executing that exploit. In this example, the attack goal has a probability of 0.54. Suppose we harden thef tp service on host 2 which leads its probability to decrease to 0.4. We can then calculate the new probability of the goal as 0.228, indicating increased security.
of the cloud, administrators of the tenants, cloud operators, etc.), the existence of a large number of hardware components with similar configurations (e.g., server blades in a rack), and the multi-tenancy nature of the cloud. To understand how those characteristics may affect the application of existing threat modeling techniques when applied to cloud infrastructures, we will apply them to two representative cloud infrastructure in the remainder of the paper.
3. Devising Cloud Infrastructures
In this section, we devise two cloud data center infrastructures that will be used later for threat modeling.
3.1. Overview
As we have seen in Section2, threat modeling usually requires detailed information regarding hardware and software components and their configurations, e.g., attack graphs contain information about specific vulnerabilities on each host and the causal relationships between such vulnerabilities. However, there lack public accesses to such detailed information for real cloud data centers, which is understandable since cloud providers would be reluctant to disclose details about their infrastructures and especially the vulnerabilities. To address this challenge, we devise fictitious but realistic cloud infrastructures based on concepts and ideas borrowed from major players on the market, including Cisco, VMware, and OpenStack. The following provides some examples.
– Cisco presents a cloud data center design for both public and private clouds [15], which is divided into multiple layers with suggested hardware for the physical network and software used to virtual-ize the resources. Our infrastructures borrow the multi-layer concept and some hardware compo-nents, e.g., Carrier Routing System (CRS), Nexus (7000,5000,2000), Catalyst 6500, and MDS 9000.
– VMware vSphere provides recommendations for the hardware and software components required to run a private cloud data center [16]. They also tag the port numbers used to connect services together. Our infrastructures borrow the concepts of Authentication Server, Domain Name System(DNS), and Storage Area Network (SAN), which are synthesized to represent the main functionality of some hardware components in our cloud infrastructures.
– OpenStack is one of the most popular open source cloud operating systems [17]. Our infrastructures relies on OpenStack and particularly its follow-ing components: Dashboard, Nova, Neutron, Key-stone, Cinder, Swift, Glance, and Ceilometer [17].
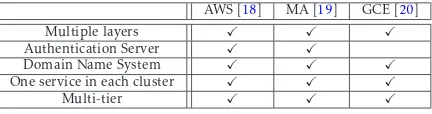
Table 1 relates some of the concepts used in our infrastructures to those found in the three major cloud providers[18–20] (some of those concepts will also be discussed later in this section). By incorporating those popular concepts and hardware/software components shared by major players in the market, we ensure our design is representative such that the threat modeling exercises later can bring out useful lessons for cloud providers even though their cloud infrastructures will certainly be different from ours. Also, we assume hardware and software components of specific versions, which are carefully designed in such a way that those components (and their specific versions) correspond to various real-world vulnerabilities that will later be used in our threat modeling exercises. In the following, we discuss two different infrastructures since OpenStack components can either run centrally on a single server or be distributed to multiple servers [17].
Table 1. Concepts Used by Major Cloud Providers such as
Amazon Web Services(AWS), Microsoft Azure (MA) and Google Compute Engine (GCE).
AWS [18] MA [19] GCE [20]
Multiple layers
Authentication Server
Domain Name System
One service in each cluster
Multi-tier
3.2. Infrastructure 1
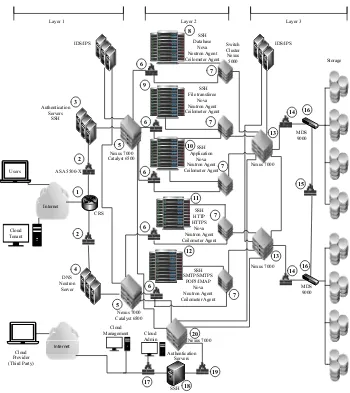
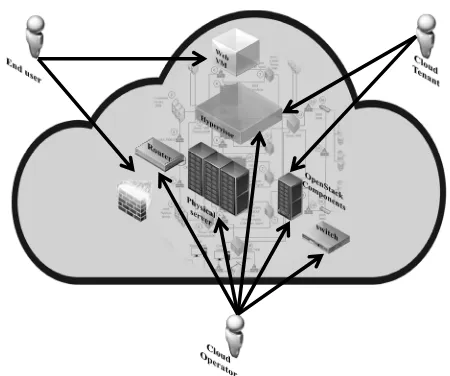
Figure3illustrates our first infrastructure. The physical network provides accesses to both cloud users and cloud administrators, e.g., cloud administrators can connect to the data center through firewalls (node 17) and (node 19), an authentication server (node 18), and a Nexus 7000 (node 20), which is connected to the other part of the network. For cloud users, Cisco’s multi-layer concept is used [15] as follows.
– In Layer 1, a CRS (node 1) is used to connect the cloud to the internet, which then connects to a firewall (node 2, ASA 5500-X Series) while simultaneously being connected to two different types of servers (authentication servers (node 3) as well as DNS and Neutron Servers (node 4)). Those servers provide services to the cloud tenants and end users. The servers then connect to Cisco Nexus 7000 with Catalyst 6500 (node 5) to route the requests to destination machines.
connect servers inside each rack at the computing level (nodes 8,9,10,11, and 12). The Nexus 5000 (node 7) then connects to the next layer.
– In Layer 3, another Nexus 7000 (node 13) connects the previous layer to the storage. A firewall (node 14, ASA 5500-X Series) connects the Nexus 7000 (node 13) and MDS 9000 (node 16).
The following outlines how the cloud works. OpenStack components run on the authentication servers among which one (node 3) is designated for cloud tenants, and another (node 18) for cloud administrators. The first runs following components: Dashboard, Nova, Neutron, Keystone, Cinder, Swift, Glance, and MySql. The second runs the same components, but additionally runs Ceilometer for a billing system. The DNS server (node 4) runs a Neutron component that provides the address of the machine running a requested service. At the computing level (nodes 8,9,10,11, and 12), all physical servers run four components: Hypervisor, Nova to host and manage VMs, Neutron agent to connect VMs to the network, and Ceilometer agent to calculate the usage. At the computing level, each physical server cluster runs the same VMs service [21], e.g., all http VMs run on the
httpserver cluster, and the same occurs for application VMs,f tp VMs, smtp VMs, and database VMs. Finally, all physical machines and VMs runsshfor maintenance.
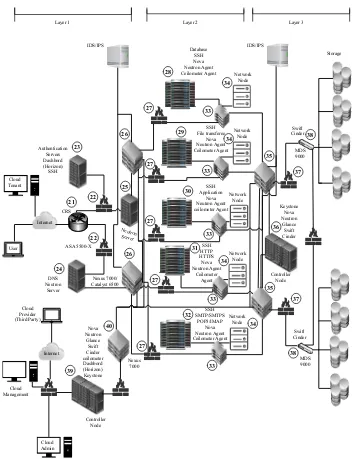
3.3. Infrastructure 2
The second infrastructure is illustrated in Figure 4. This infrastructure has a similar physical network as the previous, with the addition of new machines that separate OpenStack components, which are installed on the authentication servers for cloud tenants in the previous infrastructure, into different machines. These new machines are Neutron servers (node 25), controller servers (node 36), and network nodes (node 34). In addition, the authentication server (node 23) for cloud tenants will run a Dashboard component to access and manage the VMs related to the tenant user. Moreover, Neutron server (node 25) controls the virtual network and connects to the controller node (node 36), which runs Nova API, Neutron API, Keystone, Glance, Swift, Cinder, MySql, and any other components needed to manage and control the cloud. Finally, a network node (node 34) translates between the virtual IPs and the physical IPs to grant accesses to services running on VMs. For example, if a cloud tenant wishes to access their VMs, they will first need to connect to the Dashboard. Next, the Neutron server will send the authentication request to the Keystone service on the controller node. If the user possesses the privilege for accessing the VMs, the controller will send a request to the network node to obtain the address for the VMs,
and will then send the address to the Neutron server to connect the user to their VMs.
In the remainder of the paper, we will apply sev-eral threat modeling techniques to those cloud infras-tructures. In addition to the details about the hard-ware/software components and configurations pro-vided above, we will introduce additional assumptions, e.g., those about vulnerabilities, during the discussions of each model.
4. Threat Modeling
This section applies several popular threat models, including attack surface, attack tree, and attack graph, to the two cloud infrastructures introduced above.
4.1. Attack Surface
We apply the attack surface concept to our cloud infrastructures at the level of hardware and software resources. Gruschka and Jensen categorize attack surfaces into those between users, services, and the cloud provider [8]. The same classes are used in our discussions, with the addition of attack surfaces belonging to each class. Also, we consider the service class as the intermediate layer between users (either end users and cloud tenants) and the cloud provider (or cloud operators) in the sense that, if a user wishes to attack a cloud provider or another user, he/she must pass through an attack surface consisting of services. In addition, we focus on entry and exit points [7] which indicate the means through which the attack starts, and those through which data is leaked out, respectively.
In Figures3and4, it can be observed that there are three types of attack surfaces in a cloud data center. First, there are attack surfaces related to the physical network, involving hardware and software components, such as switches, routers, servers, applications, and operating systems. Second, there are virtualization-related attack surfaces, such as hypervisors and virtual switches. Third, there are attack surfaces related to the cloud operating systems, such as OpenStack components (Glance, Neutron, Nova, Ceilometer, and Keystone). The first type of attack surface is similar to those in traditional networks except that software components may exist both at the infrastructure level and in virtual machines or virtual networks. On the other hand, virtualization and cloud operating systems-related attack surfaces are unique to a cloud, and their analysis will pose new challenges. Figure 5 illustrates the entry points that can be used by end users, cloud tenants, and cloud operators, respectively.
Internet
SSH Database
Nova Neutron Agent Ceilometer Agent
SSH File transferee
Nova Neutron Agent Ceilometer Agent
SSH Application
Nova Neutron Agent Ceilometer Agent
SSH HTTP HTTPS
Nova Neutron Agent Ceilometer Agent
SSH SMTP/SMTPS
POP3/IMAP Nova Neutron Agent Ceilometer Agent Cloud
Tenant Users
Authentication Servers
SSH
ASA 5500-X
DNS Neutron
Server CRS
Nexus 7000 Catalyst 6500
Nexus 7000 Catalyst 6500
Switch Cluster Nexus
5000
Nexus 7000
Nexus 7000
Internet Cloud
Provider (Third Party)
Cloud Admin Cloud
Management
IDS/IPS IDS/IPS
Storage
MDS 9000
MDS 9000
Nexus 7000 Authentication
Servers
SSH
Layer 1 Layer 2 Layer 3
3
1
2 2
4
5
5 6 6 6 6 6
7
7
7
7
7 8
9
10
11
12
13
13 14
14 15
16
16
17 18
19 20
Figure 3. Cloud Data Center Infrastructure 1
to reach a database server and attack a hypervisor to control all VMs run on that machine. The following discusses two example scenarios to show which attack surfaces may be involved when the malicious user attempts to reach his/her goal.
Example 1. An example entry point for the end user
to start the attack is the http VM (node 11) running in thehttp tier which may have a vulnerability inside the services (httporssh), e.g., 2014-0226, or CVE-2007-4752 [22], (note attack surface is not directly concerned with specific vulnerabilities). After he/she gets access to thehttp VM, it becomes an exit point to attack the app VM (node 10) running in the app tier. By exploiting a vulnerability, e.g., CVE-2004-1370, in the Oracle application, the attacker can turn the app VM into an exit point to attack the database (node 8). By exploiting a vulnerability, e.g., CVE-2004-1338, in the DB VM, he/she can make it an exit point to reach the database hypervisor. Finally, by exploiting a
vulnerability in the hypervisor, e.g., CVE-2013-4344, the attacker can potentially obtain control over all VMs running on top of this hypervisor and turn the hypervisor into an exit point to reach data belonging to all those VMs. This example shows how different hardware/software components may become part of the attack surface (entry points and exit points) along a path followed by the attacker, which also motivates us to better capture such a path using other threat models later, such as attack trees or attack graphs.
Example 2. This example shows a slightly different
Internet Cloud Tenant
User
Authentication Servers Dashbord (Horizon) SSH
DNS Neutron
Server
Neutron Server
Database SSH Nova Neutron Agent Ceilometer Agent
SSH File transferee
Nova Neutron Agent Ceilometer Agent
SSH Application
Nova Neutron Agent ceilometer Agent
SSH HTTP HTTPS
Nova Neutron Agent
Ceilometer Agent
SSH SMTP/SMTPS
POP3/IMAP Nova Neutron Agent Ceilometer Agent
Network Node
Network Node
Network Node
Network Node
Network Node
Keystone Nova Neutron
Glance Swift Cinder
Controller Node
MDS 9000 Swift Cinder MDS 9000 Swift Cinder
IDS/IPS IDS/IPS
Internet
Controller Node Nova Neutron
Glance Swift Cinder ceilometer
Dashbord (Horizon) Keystone
Cloud Admin Cloud Management
Cloud Provider (Third Party)
Nexus 7000/ Catalyst 6500
Nexus 7000 ASA 5500-X
Storage
CRS
Layer 1 Layer 2 Layer 3
23
27
21 22
22
24
25
26 26
27
27
27
27 28
29
30
31
32
33 33
33
33 33
34
34
34
34 35 35
36 37
37
38 38
39
40
Figure 4. Cloud Data Center Infrastructure 2
same hypervisor, which will be similar to the previous example, or to attack the physical machine. After getting access to the physical server (node 11), the attacker can turn it into an exit point to attack other physical machines in the same tier, or to attack the next tier, e.g., theapp server (node 10) followed by attacks on the database server (node 8), and he/she can reach his/her goal in a similar fashion as above. Comparing this example to the previous one, we can see that the co-existence of physical and virtual components enlarges the attack surface in cloud infrastructures, which potentially gives attackers more choices in reaching a goal.
Attack Surface w.r.t. Cloud Tenants. We consider an adversary is taking the role of a legitimate cloud tenant who can use his/her own VMs to attack another tenant who resides in the same physical machines or in the same cloud data center. We will discuss two examples related to such a cloud tenant adversary. The first example shows the attack surface used to attack other tenants co-residing on the same physical machines. The second example shows the attack surface for attacking other tenants in the same cloud data center.
Example 3. Suppose a malicious cloud tenant wants
Figure 5. Entry Point for Attack Surface
dose not need to find an entry point among the cloud services to start his/her attack as he/she has access to VMs running inside the cloud. Assume the cloud tenant in this example has access to the f tp VM (node 9). The malicious tenant may use vulnerabilities related to the hypervisor as an entry point to gain access to the hypervisor. Once he/she gets such accesses, the hypervisor becomes an exit point to access any other tenants’ VMs running on top of the same hypervisor. This example clearly shows the tenant privilege gives attackers an edge over the end users in the previous examples.
Example 4. Now consider a slightly different scenario
where the malicious cloud tenant wants to attack another tenant not residing on the same hosts, but still inside the same cloud data center. Assume the malicious tenant has access to the f tp (node 9), so he/she can use that VM as an exit point to attack the hypervisor, and that compromised hypervisor then in turn becomes an existing entry point to attack the physical machine, e.g., CVE-2017-17564. Once in control of the physical machine, that machine becomes an exit point to attack the switches (e.g., node 7), which then becomes an exit point to attack other physical machine in the f tp tier (e.g., node 9) or the switches (node 13), and eventually leading to access to the storage (node 16). In those two examples, we can see that, for malicious tenants, the hypervisors are almost always the foremost and also the most important attack surface during cross-tenant attacks.
Attack Surface w.r.t. Cloud Operators. A cloud operator here refers to an employee of the cloud provider who has limited privileges to access specific components
(e.g., switches, firewall, and SAN) for maintenance and management purposes. An adversary taking the role of such a cloud operator may abuse his/her accesses to resources to attack the cloud data center. The cloud operators may further be divided into two categories, the local employees of the cloud provider, and those who are from a third party company under a contract with the cloud provider. We use two examples to show the attack surface corresponding to each category.
Example 5. Suppose the malicious operator wants
to steal data belonging to cloud tenants. Specifically, assume the operator has access to switch Nexus 5000 (node 7) to perform maintenance task and his/her goal is to steal data from storage (node 16). The malicious operator can use switch Nexus 5000 as an exit point to attack switch Nexus 7000 (node 13), which then becomes an exit point to reach the firewall (node 14). The firewall (node 14) then becomes an exit point to reach the MDS 9000 (node 16), which in turn becomes an exit point to access data stored in the cloud. Clearly, this example shows that a malicious operator would have a much larger attack surface than in all previous cases, which will enable him/her to simply bypass any cloud services or hypervisors and attack directly the critical hardware components.
Example 6. In this example, a third party operator is
given remote access to perform maintenance tasks on the compute node (in OpenStack, compute nodes are systems used to host virtual instances, whereas control nodes are used to control the OpenStack environment) (node 12), and the target is to get access to emails belonging to the tenants. The malicious operator can use his/her access to the compute node to attack its operating system, and hence he/she can make the compute node an exit point to attack the hypervisor and VMs running on the same machine, eventually leading him/her to access the email service. In contrast to the above example, although the third party operator in this case has slightly lower privileges (i.e., not directly accessing the hardware components), there is still a possibility he/she may abuse his/her initial privileges on an important attack surface (the compute node).
The increased privileges of cloud tenants and cloud operators give them a larger attack surface due to their legitimate access to VMs or hardware components. For cloud tenants, the hypervisor is generally the first attack surface, and also the isolation provided by hypervisors is the most important layer of defense. As to cloud operators, their attack surface include not only what are mentioned before but also important hardware components of the cloud infrastructure. In contrast to traditional enterprise networks, the attack surface of clouds is much more complex, involving physical components, software services, virtualization, cloud operating systems, etc., as demonstrated by our examples above.
4.2. Attack Tree
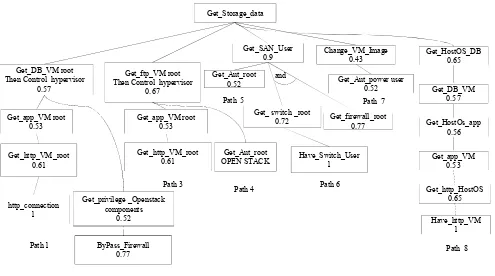
In the previous section, we have described each attack scenario through a series of attack steps involving different attack surfaces. To better capture what may happen once an attacker gains initial privileges, we now apply attack trees, which represent high-level attack paths leading attackers to their goals. Figure 6 shows an attack tree for our cloud data center infrastructures. It is assumed that the root node, or goal node, is a storage device in the cloud that is susceptible to attacks by either a malicious user, a cloud tenant, or a cloud operator. Eight paths in Figure6represent the possible ways to reach such a target. Each path represents a different capability level of attackers who can follow the path so not all paths are accessible to every attacker. For example, some paths can only be followed by the cloud operator but cannot be accessed by end users or cloud tenants. In what follows, we explain those paths and corresponding attack scenarios in further details.
– Path 1: This attack can be executed by an end
user to obtain data from the storage device (node 16). The user must first establish a connection to the http VM server (node 11) and must then acquire the root privilege on this VM. The attacker can then connect to the application VM server (node 10) provided that they have obtained root privilege on that VM. After the user acquires access to the application VM, he/she may create a connection to the database VM server (node 8). From this point, the user can attack the database VM to obtain root privilege on that VM. Finally, the attacker can launch an attack on the hypervisor to gain access to other database VMs (node 8) running on the same physical machine and obtain data related to all database VMs stored on the storage device (node 16).
– Path 2: The end user can use this path to attack
the cloud storage device (node 38). The attacker begins the attack by bypassing the firewall (node
22) to obtain privilege on OpenStack (node 36) in order to gain a direct connection to the database VM server (node 28). The remainder of this attack is similar to that of path 1, and serves to gain access to the hypervisor and the storage device.
– Path 3:This path can be used by a cloud tenant
user who has user access to thehttp VM server (node 11) and wishes to access f tp files stored on the storage device (node 16). First, the cloud tenant user must obtain root privilege on thehttp VM server (node 11). Then, he/she will need to obtain root privilege on the application VM server (node 10) to start a connection to the f tp VM server (node 9). After this, the user will obtain root privilege to this VM and get the f tp files related to this VM. In addition, the user can attack the hypervisor to obtain the f tp files related to other VMs running on top of this hypervisor.
– Path 4:Cloud tenants who do not already possess
f tp VM servers running on the cloud can use this path to obtain data from the storage device (node 16) through the f tp VM server (node 9). Cloud tenants on this path will use OpenStack components (node 3) to gain privileges to access thef tpVM (node 9) belonging to another cloud tenant. In this situation, the attacker can obtain all files belonging to this VM. Furthermore, the attacker may attack the hypervisor to gain access to otherf tp VMs running on the same physical machine.
– Path 5:Cloud operators with access to the admin
user authentication server (node 18) can use this path by obtaining root access to the authentication server. They can then use this device to obtain root access on the SAN device (node 16) to control the data stored on the storage device.
– Path 6:This path can be used by a cloud operator
who has access to a physical machine (e.g., a switch, firewall, or other type of machines) to attack the storage device. Suppose the attacker has user access to a switch device (node 13) for maintaining this device. The attacker can obtain root access to this device followed by root access to a firewall device (node 14) between the switch device and the SAN (node 16). These two accesses may allow him/her to create a connection to the SAN device and subsequently attack the SAN in order to access the stored data.
– Path 7: This path may be used by a third party
Get_Storage_data
Get_DB_VM root Then Control hypervisor
0.57
Get_SAN_User 0.9
Get_app_VM root 0.53
Get_ftp_VM root Then Control hypervisor
0.67
Get_http_VM_root 0.61
Get_Aut_root 0.52
Have_Switch_User 1 Get_ switch _root
0.72 Get_firewall_root0.77
and
Get_app_VM root 0.53
Get_http_VM_root 0.61
Change_VM_Image 0.43
Get_Aut_power user 0.52
Get_Aut_root OPEN STACK
ByPass_Firewall 0.77
Get_privilege _Openstack components
0.52
Get_HostOS_DB 0.65
Get_DB_VM 0.57
Get_HostOs_app 0.56
Get_app_VM 0.53
Get_http_HostOS 0.65
Have_http_VM 1 http_connection
1
Path 1
Path 2
Path 3
Path 4 Path 6
Path 7
Path 8 Path 5
Figure 6. Attack Tree
image storage (node 18) and (node 16). In this case, the attacker may use this privilege to modify or change the VM images stored on Glance such that the modified image will have a backdoor embedded which can later be used by the attacker to gain access to all VMs using this image.
– Path 8: This path can be used by either a cloud
tenant or an end user. The goal for these attackers is to control the data belonging to other tenants in the cloud. The attacker must first have access to the http VM server (node 31) and then gain access to the host operating system (node 31) and hence access to all VMs running on this machine. The attacker may then gain access to all the application VMs (node 30) that are connected to all http VMs to which they have access. Subsequently, the attacker gains access to the application VMs which may be running on different physical machines and acquire access over their host OS and VMs (node 30). The attacker can then gain root access to the database VM server (node 28) in order to obtain the data stored on the storage device. The attacker may also decide to gain access to all the host OSs running database VMs (node 28).
discuss quantitative models, such as security metrics, in Section5.1.
4.3. Attack Graph
The previous section shows how attack trees can capture the attack paths potentially followed by attackers to compromise critical assets. However, the attack tree is still a relatively high-level concept, without details about specific ways for exploiting a resource. We now apply attack graphs to represent specific exploits of vulnerabilities that can be used to compromise critical assets along each path of the attack tree. Although we can apply the standard attack graph concept designed for traditional networks, special consideration needs to be given to the unique aspects of clouds, such as virtualization and redundancy. First, traditional attack graphs do not distinguish between physical and virtual resources, which can be important for human inspection or certain analysis performed on attack graphs. Second, a cloud data center usually have racks of machines with similar or identical configurations, and the traditional way of modeling every one of those machines in an attack is obviously redundant and not scalable. Therefore, in our application of attack graphs, we introduce two new graphical notations, i.e., dashed line for representing virtualization (e.g., exploits on VMs), and stacked rectangles as a simplified representation for a collection of similar exploits on multiple hosts with similar configurations. Finally, like in the case of attack surface and attack tree, we also need to construct attack graphs for different types of attackers. Also, we construct our attack scenarios based on real vulnerabilities related to hardware and software components used in our infrastructures as listed in the National Vulnerability Database (NVD) [22].
Attack Graphs for End Users. Figure7shows two attack graphs for adversaries taking the role of end users. The left-hand side of the figure is based on infrastructure 1 and the right-hand side for infrastructure 2. In both cases it is assumed that the attacker has access to cloud services. The main goal for the attacker is to steal data from the storage. The attack graphs show how an attacker may gain access to thehttpVM, the application VM, and database VM, before reaching the goal due to the multi-tier infrastructure. The following services are assumed, i.e., Tectia Server version 5.2.3, for ssh running on all VMs, Apache http server running on thehttpVM, Oracle version 10.1.0.2 on the application VM, Oracle version 10.2.1 on the database VM, and Xen version 4.3.0 as a hypervisor to control VMs running on top of physical machines.
Example 7. The left-hand side in Figure 7 shows an
attack graph corresponding to path 1 in the aforemen-tioned attack tree. Between five to seven vulnerabilities
are required to reach the goal. Specifically, five vulner-abilities are required if we assume thesshvulnerability will be the same in the http server VM, application server VM, and database server VM, whereas seven vulnerabilities are required if the ssh vulnerability is not used to reach the goal. We divide the attack graph to four stages and in each stage the attacker will gain a different level of privileges.
– Stage 1: A vulnerability in the http server VM
(node 11) (CVE-2007-5156) is employed by the attacker to gain user access by uploading and executing arbitrary PHP code. Then, another vulnerability on the same VM (CVE-2007-1741) is used to gain root privilege by renaming the directory or performing symlink attacks. A ssh (node 11) vulnerability (CVE-2007-5156) can also be used to gain root privilege on the same VM. At this point, the attacker can use exploit VMs with similar configurations to compromise other copies of the VM to expand his/her attack and go through Stage 4 below to reach the hypervisor on each VM copy.
– Stage 2: The attacker now can connect to the
application server (node 10). By exploiting a vulnerability related to the application server VM (CVE-2006-0586), the attacker can gain the user privilege by executing arbitrary SQL commands via multiple parameters. To gain root privilege on this VM, the attacker can apply this vulnerability (CVE-2004-1774) or by using ssh (node 10) vulnerability (CVE-2007-5616), and at this point the attacker can establish a connection to the database server VM. Also, he/she can exploit the redundancy between VMs as mentioned in the previous stage.
– Stage 3: The attacker exploits a vulnerability
related to the database server (node 8) VM (CVE-2005-0297) to gain user access. Then, he/she can gain root access to this VM by using vulnerability (CVE-2007-1442) or ssh (node 8) vulnerability (CVE-2007-5616). The attacker can also exploit the redundancy here.
– Stage 4:The attacker can now obtain data related
to the database VM (node 8), and he/she may also, attempt to obtain more data from other VMs running on the same physical machine by attacking the hypervisor through a vulnerability such as the CVE-2013-4344 (buffer overflow in Xen).
Example 8. The right-hand side in Figure7is related to
<user, 10>
<ssh, 10>
<10, 10> <11, 10> <app, 10>
<ssh,11> <user, 11> <11, 11> <http, 11> <user, 0>
<0, 11>
<db, 8> <10, 8>
<user, 8> < ssh, 8>
<8, 8>
<Xen, 8, 8>
<Xen, 8>
Service CVE #
http1 2007-5156
http2 2007-1741
ssh 2007-5616
app1 2006-0586
app2 2004-1774
db1 2005-0297
db2 2007-1442
Xen 2013-4344
0 End User
<ssh, 10, 10> <app2, 10, 10>
< http2, 11, 11>
<app1, 11, 10> <ssh, 11, 11>
< http1, 0, 11>
< db2, 8, 8> <ssh, 8, 8>
< db1, 10, 8> <root, 11>
<root, 10>
<user, Xen> <root, 8>
RH-N Red Hat
OpenStack-Neutron
0 End User
<ASA5500, 22> <0, 22> <user,0>
<ASA5500, 0, 22>
<RH-N, 0, 25>
<0, 25> <RH-N, 25>
<user, 25>
<KeyStone , 25, 36>
<db, 28VM> <user, 28VM>
<25, 36> <KeyStone , 36>
<28VM, 28VM>
<Xen, 28VM, 28>
<Xen, 28> <28VM, 28>
Service CVE #
ASA5500 2011-3298
RH-N 2013-6433
KeyStone 2013-6391
db 2007-1442
Xen 2013-4344 <db, 28VM , 28VM >
<root, 28VM>
<user, Xen> Redundancy
VM
Physical Machine
Figure 7. Attack Graphs for End Users in Infrastructure 1 (Left) and Infrastructure 2 (Right)
to gain access to date storage in three stages. This attack graph corresponds to path 2 in the attack tree.
– Stage 1: A vulnerability in the firewall (node
22) (CVE-2011-3298) (which allows attackers to bypass authentication via a crafted TACACS+ reply) is employed by the attacker to bypass the firewall in order to connect to the Neutron server (node 25). The attacker can then use the Neutron vulnerability (CVE-2013-6433) (which allows remote attackers to gain privileges via a crafted configuration file) to gain privileges with which he/she can use vulnerability (CVE-2013-6391) in Keystone to gain privileges and access a database VM (node 28).
– Stage 2: After the attacker obtains access to the
database VM (node 28), he/she can exploit the vulnerability (CVE-2007-1442) (a vulnerability in Oracle to allow local users to gain privileges) to gain root privilege on the same VM. This privilege allows the attacker to obtain data related to this VM or to further exploit the redundancy to access other VMs run on the same physical machine.
– Stage 3: To obtain data from another database
on the same physical machine, the attacker can exploit the aforementioned vulnerability (CVE-2013-4344) to gain access to the hypervisor running on this physical machine.
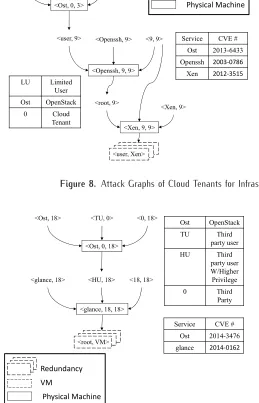
Attack Graphs for Cloud Tenants. Figure 8 shows two attack graphs for adversaries taking the role of cloud tenants. The left-hand side of the figure is based on infrastructure 1 and the right-hand side for infrastructure 2.
Example 9. The left-hand side of attack graph in
as a hypervisor on the f tp server’s physical machine. Three stages are required to reach the goal.
– Stage 1: A vulnerability in the f tp server VM
(node 9) (CVE-2013-6433 as mentioned above) is employed by the cloud tenant attacker to gain user access on thef tpserver VM.
– Stage 2: After the attacker obtains access to
the f tp VM (node 9), he/she uses another
f tp vulnerability (CVE-2003-0786, which allows remote attackers to gain privileges) to gain root privilege on the same VM.
– Stage 3: To obtain files belonging to another
tenant on the same physical machine, the attacker exploits the vulnerability (CVE-2012-3515, which allows local OS guest users to gain privileges) to gain access to Xen (node 9) running on this physical machine such that he/she can access all VMs running on this machine and obtain files related to these VMs. Also, the attacker may exploit redundancy to expand his/her attack to other VMs copies.
Example 10. The right-hand side attack graph in
Figure8is based on infrastructure 2 where OpenStack components are distributed to multiple hosts. The goal for a malicious cloud tenant is to gain access on a host OS on the physical machine of the database VM server (node 28) to control all VMs running on that physical machine. In this example, the cloud tenant has a VM running on thehttpserver (node 31) but does not have any VM on the application (node 30) or database (node 28) servers. This attack graph corresponds to path 8 in the attack tree. Three stages are required in this example to reach the goal.
– Stage 1: A vulnerability in thehttp VM (node 3)
(CVE-2015-5154, a buffer overflow vulnerability that allows local guest users to execute arbitrary code on the host via unspecified ATAPI com-mands) is employed by the attacker, who then has access to the host OS of the physical machine and hence the control of all VMs running on this machine. The attacker can exploit the redundancy to attack other physical machines running a copy of the same VM and expand his/her attack.
– Stage 2: The attacker now can connect to the
application server (node 30) by using one http VM, which is connected to the application VM server (assuming this application VM does not connects to a database VM server (node 28)). Then, by using a vulnerability related to the application VM server (CVE-2015-3247, a race condition vulnerability that allows a remote attacker to execute arbitrary code on the host
via unspecified vectors), the attacker is allowed to gain access to the host OS on the application server to control all its VMs. The redundancy can also be exploited here to control other VMs.
– Stage 3: The attacker can then use one of the
new application VM servers to get access to the database VM server (node 28) and obtain data related to this database. Also, he/she may attempt to obtain more data from other VMs running on the same physical machine by attacking the host OS through exploiting (CVE-2015-3456, a vulnerability that allows local guest users to execute arbitrary code). In this stage, the redundancy can also be exploited to expand the attack.
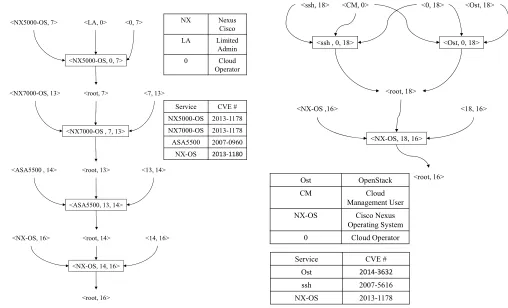
Attack Graphs for Cloud Operators. We first model third party cloud operators and then model internal cloud operators with more privileges. Figure 9 shows the attack graph of an adversary taking the role of a third party cloud operator who has the permission of changing VM images for cloud tenants. This attack graph is based on the infrastructure 1. The attack corresponds to path 7 in the attack tree, and is similar to real-world cases where unauthorized third parties gain access to cloud customers’ account information [23].
Example 11. A vulnerability in OpenStack Keystone
(node 18) (CVE-2014-3476) is employed by the attacker, which allows remote authenticated users to gain privileges they do not already possess. The attacker is then assumed to have access to the Glance storage from the previous exploit. The attacker now can exploit the vulnerability (CVE-2014-0162), which allows a user with permission to make changes (add, remove, and modify) to VM images. Subsequently, the attacker can attack any VM running modified image to gain control or information. The attacker can also exploit redundancy to access another physical machine running a copy of the same VM or exploit one of the previous vulnerabilities to attack the hypervisor.
Figure10demonstrates two attack graphs for internal cloud operators with more privileges. The left-hand attack graph illustrates an attacker who has access to the physical device and gains access to storage. The right-hand side attack graph illustrates a user who has access to the admin user authentication server to obtain data from the storage. These two attack graphs correspond to path 6 and path 5 in the attack tree, respectively. There also exist well known real-world incidents similar to those attacks, e.g., the case of Google dismissing employees due to breaching customers’ privacy [24].
Example 12. In the first attack graph, the attacker is
<Ost, 3>
LU Limited
User
Ost OpenStack
0 Cloud
Tenant
<LU, 0> <0, 3>
<Ost, 0, 3>
<Openssh, 9, 9> <Openssh, 9> <user, 9> <9, 9>
<Xen, 9, 9> <Xen, 9> <root, 9>
Service CVE #
Ost 2013-6433
Openssh 2003-0786 Xen 2012-3515
<user, Xen>
Redundancy VM
Physical Machine
0 Cloud Tenant
<Xen, 31VM1> <user, 0> <0, 31VM1>
<Xen, 0, 31VM1>
<user, 31Host-OS>
<KVM, 30VM2>
<KVM, 31VM2, 30VM2>
<31VM2, 30VM2>
<user, 30Host-OS>
<KVM, 28VM3> <30VM3, 28VM3>
<KVM, 30VM3, 28VM3>
<User, 28Host-OS>
Service CVE #
Xen 2015-5154
KVM 2015-3247
KVM 2015-3456
<user, 31VM2>
<user, 30VM3>
Figure 8. Attack Graphs of Cloud Tenants for Infrastructure 1 (Left) and for Infrastructure 2 (Right)
Ost OpenStack
TU Third
party user
HU Third
party user W/Higher Privilege
0 Third
Party
<Ost, 18> <TU, 0> <0, 18>
<Ost, 0, 18>
<glance, 18, 18> <HU, 18>
<glance, 18> <18, 18>
Service CVE #
Ost 2014-3476
glance 2014-0162
<root, VM>
Redundancy VM
Physical Machine
Figure 9. An Attack Graph of Third Party Cloud Operators for Infrastructure 1
device (Nexus 5000) (node 7) for maintenance. The goal for this attacker is to gain access to the storage device. In this example, three vulnerabilities are required to reach the goal in four stages.
– Stage 1:A vulnerability in the Nexus 5000 (node
7) (CVE-2013-1178, which are multiple buffer overflows in the Cisco Discovery Protocol (CDP) implementation that allow remote attackers to execute arbitrary code via malformed CDP packets) is employed by the attacker to gain root privilege on the Nexus 5000. Then, the attacker
can establish a connection to the Nexus 7000 (node 13).
– Stage 2:By exploiting the previous vulnerability
again, the attacker will gain root access to Nexus 7000 (node 13).
– Stage 3: The attacker now can connect to the
firewall (node 14). Then, by using a vulnerability related to the firewall (CVE-2007-0960), which allows the attacker to gain root privilege. Consequently, the attacker can change the firewall rules and allow connection to the MDS 9000 device (node 16).
– Stage 4: To obtain data from MDS 9000, The
attacker can use the vulnerability (CVE-2013-1180, a buffer overflow in the SNMP implemen-tation which allows remote authenticated users to execute arbitrary code) to gain root privilege and thereby gain access to storage.
Example 13. In the second attack graph, the attacker
has access to the billing system (node 18). The goal of the attacker is to obtain higher privileges on the cloud system and to access the cloud storage device (node 16). In this attack graph, Three vulnerabilities can be used to gain access to storage, and the attacker needs to exploit two vulnerabilities to reach his/her goal.
– Stage 1:The attacker can exploit one of the two
NX Nexus Cisco
LA Limited
Admin
0 Cloud
Operator
<NX5000-OS, 7> <LA, 0> <0, 7>
<NX5000-OS, 0, 7>
<root, 7>
<NX7000-OS, 13> <7, 13>
<NX7000-OS , 7, 13>
<root, 13>
<ASA5500 , 14> <13, 14>
<ASA5500, 13, 14>
<root, 14>
<NX-OS, 16> <14, 16>
<NX-OS, 14, 16>
<root, 16>
Service CVE #
NX5000-OS 2013-1178 NX7000-OS 2013-1178 ASA5500 2007-0960
NX-OS 2013-1180
Ost OpenStack
CM Cloud
Management User
NX-OS Cisco Nexus
Operating System
0 Cloud Operator
<ssh, 18> <CM, 0> <0, 18> <Ost, 18>
<ssh , 0, 18> <Ost, 0, 18>
<root, 18>
<18, 16> <NX-OS ,16>
<NX-OS, 18, 16>
<root, 16>
Service CVE #
Ost 2014-3632
ssh 2007-5616
NX-OS 2013-1178
Figure 10. Attack Graphs of Cloud Operators
which allows local user to gain root privilege, and a vulnerability related to OpenStack-Neutron (CVE-2014-3632) which allows attackers to gain root privilege.
– Stage 2: Then, the attacker can use one of the
previous vulnerabilities to get root privileges to open a connection to the MDS 9000 (node 16), and he/she can then exploit the vulnerability in the (CVE-2013-1178) MDS 9000 to obtain root access, thereby obtaining data from the storage.
Summary Unlike attack surface and attack tress, attack graphs provide more specific details about the vulnerabilities that may be exploited to compromise a critical asset. We have demonstrated how each path in an attack tree may be instantiated as an attack graph with concrete exploits of vulnerabilities. Our examples also demonstrate the new opportunities, in terms of concrete vulnerabilities, for attackers to exploit virtualization and redundancy in cloud infrastructures, and how such unique features of clouds may be easily handled in attack graphs through adding some simple graphical notations.
Finally, by constructing attack surface, attack trees, and attack graphs for our cloud infrastructures, we have demonstrated how each model may capture potential threats at a different abstraction level and how they could work together. Models at a higher level, such as attack surface or attack trees, may serve as a starting point to show the big picture and to guide further efforts spent on a more detailed, and certainly more expensive model, such as attack graphs. We have also focused on attack scenarios which are designed to employ the unique features of cloud infrastructures, such as the co-existence of different types of users, virtualization, and components with similar configurations, and those scenarios clearly show that cloud infrastructures may be subject to novel threats not present in traditional enterprise networks. Nonetheless, all those models are qualitative in nature, and we will apply security metrics to measure the threats in the coming section.
5. Security Metrics
5.1. Attack Tree Metric
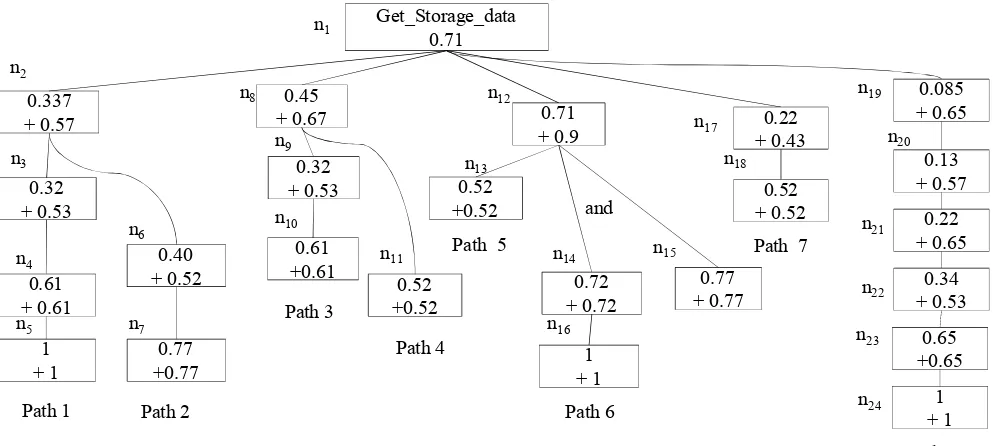
We first apply an attack tree metric (ATM) based on the attack tree described in Section 4.2. In Figure 11, all nodes inside the same path are considered as having AND relationships, whereas an OR relationship is assumed between different paths unless if an AND relationship is explicitly stated. Following such assumptions, the probabilities may be calculated based on the corresponding logic relationships. The highest probability is assigned to the root node after applying the metric. In Figure 11, between the two probabilities in each node, the probability with a preceding (+) symbol represents the average values of the Common Vulnerability Scoring System (CVSS) [14] scores divided by 10 (the domain size of CVSS scores), which represents the probability of realizing each individual node without considering the dependence on its parent node. The other probability represents the metric result calculated as above.
In Figure 11, it can be observed that path 5 and 6 are the least secure paths in the attack tree. This makes sense since those two paths represent the insider attacks launched by the most powerful attackers, i.e., cloud operators. In addition to weighing different paths, this metric can also be used to evaluate whether adding a new service or disabling existing services can increase security and by how much. As shown in Figure11, the probability to reach n8 is 0.45; as such, if the cloud operator wishes to decide whether to increase security levels in that node, he/she can use the metric before and after applying the desired changes. For example, suppose the cloud operator wishes to add new rules to a firewall to prevent attacks from n9 andn11 ton8. After re-applying the ATM metric, the probability onn8 becomes 0.348, showing increased security. Applying the metric on other potential changes may help the cloud operator to make the right decisions in hardening the cloud, and we will discuss such changes in more details in the coming section.
5.2. Attack Graph Metric
In this section, the attack graph-based security metric [12, 13] will be applied to the left-hand side attack graph shown in Figure 7. By annotating the attack graph with probabilities derived from CVSS [14] scores (retrieved from the NVD) as depicted inside each node, we convert the attack graph into a Bayesian network shown in Figure 12. The goal is to quantitatively model the threat, and also to evaluate the effect of certain changes made to the cloud infrastructure. In particular, we show how the level of redundancy and diversity may affect the security of the cloud infrastructure. For redundancy, the ssh service running on some of the servers will be disabled to see the effect on security. As to diversity, we assume
thesshservice may be diversified with other software, e.g., OpenSSH version 4.3, denoted asssh2, which has a vulnerability CVE-2009-290 with a CVSS score of 6.9 [22].
Table 2 shows how security is affected by reducing redundancy and increasing diversity through disabling or diversifying some of the ssh instances in the infrastructure. In the top table, the first row shows that the probability for an attacker to reach the goal is 0.174 in the original configuration, and the remaining rows show the same probability after disabling one or more
sshinstances on the three servers, e.g., the probability after disabling ssh on the http server is reduced to 0.121, which corresponds to the most secure option by disabling one sshinstance, and the lowest probability after disabling two and threesshinstances is 0.094 and 0.074, respectively.
The middle and bottom of Table2show the effect of diversifying thesshinstances. In the middle figure, we can observe that, after we replace thesshservice onapp andDB servers withssh2, the probability for reaching the goal decreases from 0.174 to 0.171, which indicates a slight improvement in security. The next three rows of the table show that the same effect remains when one of thesshinstances is disabled. The last three rows show the simple fact that, when there is only onesshinstance left, the diversification effort has not effect.
In the bottom of Table2, we change thesshinstance on the http server instead of the app server, as in the above case, in order to see whether different diversification options make any difference to security. We can see the probability decreases in most cases (except the fourth row), which indicates a slightly more effective option than the previous one. Overall, the best option in terms of diversification without disabling any service instance is given in the first row in the right-hand table, with a probability 0.17, and the best option for disabling one service instance is given in the fourth row of the middle table with a probability 0.119 (disabling two instances always yields 0.094). Obviously, considering more options may further harden the cloud infrastructure, which will be addressed in the coming section.
Get_Storage_data 0.71
0.337
+ 0.57 0.71
+ 0.9
0.32 + 0.53
0.45 + 0.67
0.61 + 0.61
0.52 +0.52
1 + 1 0.72 + 0.72
0.77 + 0.77 and
0.32 + 0.53
0.61 +0.61
0.22 + 0.43
0.52 + 0.52
0.52 +0.52 0.77
+0.77 0.40 + 0.52
0.085 + 0.65 0.13 + 0.57
0.22 + 0.65
0.34 + 0.53
0.65 +0.65
1 + 1 1
+ 1
Path 1 Path 2
Path 3
Path 4
Path 6
Path 7
Path 8 Path 5
n3
n4
n5 n7
n6 n10
n9
n8 n12
n13
n11
n16
n14 n15
n17 n18
n19
n20
n21
n22 n23
n24 n1
n2
Figure 11. Attack Tree Metric
a capability can significantly improve the effectiveness of cloud providers’ security hardening practice while reducing the cost in terms of time and effort needed for the hardening.
6. Hardening the Cloud Data Center Infrastructure
In this section, we discuss different hardening options that can be used in a cloud infrastructure to improve security. We will focus on the attack graph model (Sec-tion4.3) and the BN-based security metric (Section5.2) and apply them to examine the effectiveness of the hardening options applied to the cloud infrastructure. Specifically, we will evaluate the BN-based metric on the attack graph before and after applying hardening options to the infrastructure, and examine the diff er-ence in the metric results.
Based on our threat modeling results, we can observe many hardening options for improving the security of cloud infrastructures, as demonstrated in the following.
– Enforcing stricter access control to cloud services to make it harder for an end user type of adversaries to access such services, and ensuring minimum privileges and sufficient accountability for cloud operators.
– Deploying firewalls to block non-essential con-nections inside the cloud infrastructure to prevent an attack from expanding its scope.
– Increasing diversity by deploying different hard-ware and softhard-ware components in the cloud
infrastructure such that a vulnerability will less like affect multiple components.
– Enforcing stronger isolation between VMs run-ning on the same machine by improving hyper-visor security to prevent attackers from escaping the VMs and compromise the host.
– Disabling non-essential services and removing unnecessary components from the cloud infras-tructure to reduce the amount of attack surfaces available to an attacker.
– Patching known vulnerabilities in the cloud infrastructure to further reduce the attack sur-faces.
We will use the cloud data center infrastructure 1 and attack graph examples in Section 4.3 to demonstrate how different hardening options may help to improve the security. The nodes in gray color in Figures 13
0.49
0.68
0.422
0.608
0.456
0.456
0.328
0.328
<user, 10>
<ssh, 10>
<10, 10> <11, 10> <app, 10>
<ssh,11> <user, 11> <11, 11> <http, 11> <user, 0>
<0, 11>
0.42
0.315
0.315
<db, 8> <10, 8>
<user, 8> 0.227
< ssh, 8> <8, 8>
0.227
0.29
<Xen, 8, 8> 0.6
0.174
0.174
<Xen, 8>
Service CVE # http1 2007-5156
http2 2007-1741
ssh 2007-5616 app1 2006-0586
app2 2004-1774
db1 2005-0297
db2 2007-1442
Xen 2013-4344
0 End User
0.68
< http1, 0, 11>
0.68
< http2, 11, 11>
0.62 < ssh, 11, 11>
0.72
< app1, 11, 10>
0.75
< db2, 8, 8>
0.75 < ssh, 8, 8>
0.72
< db1, 10, 8>
0.75
< ssh, 10, 10> 0.72 < app2, 10, 10>
0.72 <root, 11>
<root, 10>
<root, 8>
<user, Xen>
Figure 12. Attack Graph Metric (End User on Infrastructure)
onlysshconnections coming from the new servers. Also, we add a new firewall between node 7 and node 13 which will drop all packets coming from node 7.
Hardening w.r.t. End Users Figure 13 shows the attack graphs for the end user type of attackers before and after the aforementioned hardening options are applied. The attack graph is similar to that in Figure7
with the key difference that, once the attacker gains root privilege in each VM, he/she needs to exploit a firewall vulnerability (CVE-2011-0379) on node 6, or an ssh vulnerability and the VM service vulnerability (e.g., inhttp). After applying the BN-based metric, we can see that the security level has increased from 0.174 in Figure7to 0.057 in Figure13. Thus, our hardening options have increased the level of security for end users by roughly 67%.
Hardening w.r.t. Cloud Tenant Figure14presents the case of cloud tenants. The key difference between this new attack graph and the attack graph in Figure 8
lies in the exploit of the sshvulnerability (CVE-2007-5616) on the newsshauthentication server. By applying
Table 2. The Metric Results of Making Changes to the Cloud Infrastructure
(user, Xen)
http app DB T
ssh T
T T T 0.174
T F T 0.136
T T F 0.136
F T T 0.121
T F F 0.106
F F T 0.094
F T F 0.094
F F F 0.074
(user, Xen)
http app DB T
ssh1 ssh2 ssh2 T
T T T 0.171
T F T 0.135
T T F 0.135
F T T 0.119
T F F 0.106
F F T 0.094
F T F 0.094
F F F 0.074
(user, Xen)
http app DB T
ssh2 ssh1 ssh2 T
T T T 0.17
T F T 0.133
T T F 0.134
F T T 0.12
T F F 0.105
F F T 0.094
F T F 0.094
F F F 0.074
the BN-based metric to Figures 8 and 14, we can see the probability to reach the goal are 0.547 and 0.394, respectively. This means the level of security after the hardening effort has increased by about 28% for cloud tenants.
<http, 11> <0, 11>
< user, 0> <0, 6>
<ASA550, 6>
<ASA5500, 0, 6> 0.79
<user, 11> <user, 6>
<11, 11> <Ost, 3>
<Ost, 3, 11> 0.76 <3, 11>
<ssh, S_ssh, 3> 0.72
<ssh, S_ssh> <S_ssh, 3><user, 3>
<user, S_ssh> <root, S_ssh, 11>
<root, 6, 11> <S_ssh, 11>
<6, 11>
<ASA5500, 11, 6> 0.79
<6, 11> <ASA550, 6>
<user, 6> <user, 10>
<11, 10> <app, 10>
<10, 10> <app, 10>
<root,6, 10>
<6, 10>
<root,S_ssh, 10> <S_ssh, 10>
<ASA5500, 10, 6> 0.79
<10, 6> <ASA550, 6>
<user, 6>
<db, 8> <10, 8>
<user, 8>
<8, 8>
<root,S_ssh, 8> <root,6, 8> <6, 8> <S_ssh, 8>
<Xen, 8, 8> 0.6
0.057
<Xen, 8>
< http1, 0, 11> 0.68
< http2, 11, 11> 0.62
< app1, 11, 10> 0.75
< db2, 8, 8> 0.75 < db1, 10, 8>
0.75 < app2, 10, 10>
0.72
<root, 11>
<root, 10>
<root, 8>
<user, Xen> <A_root, 11>
<A_root, 10>
<A_root, 8>
0 End User Ost OpenStack
S_ssh ssh Server
Service CVE # http1 2007-5156
http2 2007-1741
Ost 2013-6433 ASA5500 2011-0379 ssh 2007-5616 app1 2006-0586
app2 2004-1774
db1 2005-0297
db2 2007-1442
Xen 2013-4344
Figure 13. Hardening Infrastructure 1 w.r.t. End Users
after we add the new firewall. By applying the BN-based metric, we find the leve of security has increased by 21% from 0.558 in Figure10to 0.441 in Figure14.
Summary In addition to the hardening options of reducing redundancy and increasing diversity dis-cussed in the previous section, we have demonstrated in this section two more hardening options, i.e., enforc-ing stricter access and addenforc-ing new firewall (rules). In practice cloud administrators will need to consider