43
IDENTIFICATION AND QUANTIFICATION OF FACTORS AFFECTING REUSABILITY OF OPEN SOURCE SOFTWARE IN REUSE-INTENSIVE
SOFTWARE DEVELOPMENT
Fazal-e-Amin1, Aized Amin Soofi2
1Department of Software Engineering
College of Computer and Information Sciences, King Saud University, Riyadh, Saudi Arabia
2Department of Computer Science, Allama Iqbal Open University, Islamabad, Pakistan
e-mail: [email protected], [email protected]
ABSTRACT
Open Source Software (OSS) is one of the emerging areas in software engineering. Reuse of OSS is employed in reuse-intensive software development such as Component Based Software Development and Software Product Lines. OSS is gaining the interest of the software development community due to its enormous benefits. The context of this study is the identification and quantification of factors affecting reusability of OSS in reuse-intensive software development. The use of OSS in the systematic reuse of software, such as in Software Product Lines (SPLs) is a new phenomenon. Therefore, the aim of this study is to identify and quantify the factors affecting the reusability of OSS in reuse-intensive software development, especially for SPLs. In this study, a mixed methods based approach is employed to identify the factors affecting the reusability of OSS. Interviews are conducted with experts in this field as the qualitative part, followed by a survey, experiments and a statistical analysis. The factors identified during the interviews are ranked by software engineers in a survey. Experiment is conducted to assess the reusability of open source packages. The factors are validated by conducting a statistical analysis of the results of the experiments. A set of nine factors were identified as a result of the qualitative study. A model was formed on the basis of the findings of interviews and a survey. It includes five factors. These were statistically analyzed by applying the model to 77 open source packages. A set of nine factors were identified as affecting reusability of OSS in a reuse-intensive development environment. Five of them were validated at the code level. The statistical results show a positive correlation between reusability and the identified factors.
Keywords: Open source software; software reusability; mixed method
INTRODUCTION
44
(Kenwood, 2001; Krishnamurthy, 2003) and the lessening of maintenance risk (F. v. d. Linden, Lundell, & Marttiin, 2009). Other benefits include user support from the community (Krishnamurthy, 2003), encouraging innovation (Howe, 2000; Wheeler, 2005) and increased collaboration (P. J. Ågerfalk, Deverell, Fitzgerald, & Morgan, 2005), which are multifaceted advantages of OSS. These may be seen from the social aspect or from the financial aspect. The things which contribute to the popularity of OSS may also include the availability of increased bandwidth, search facilities, and tools such as Code Conjurer (Hummel, Janjic, & Atkinson, 2008). The growth of the Internet is also one of the things that has had a huge impact on the way software is developed, marketed, and supported (Wasserman, 2011). The use of OSS in CBSD is already a norm in the industry (Sommerville, 2007). Recently the researchers have envisioned the use of OSS in SPL development (P. Ågerfalk et al., 2006; Ahmed, Capretz, & Babar, 2008). So, OSS is entering into a new arena. Currently limited knowledge is available in this research area. There is a need to explore the use of OSS in reuse-intensive software development especially in SPL.
The disciplines of OSS, CBSD, and SPL share a common theme, namely ‘reusability’. A broader definition of reusability describes it as the “reapplication of various kinds of knowledge about one system to another system in order to reduce the effort of developing and maintaining that system” (Samadi, Almaeh, Wolfe, Olding, & Isaac, 2004). OSS is developed to be reused and contributed to by numerous software engineers.
The reuse-intensive software development methodologies such as CBSD and SPL reuse software artefacts to develop new products. In CBSD, software components are composed to develop software systems. In SPL software assets are ‘developed to reuse’ and ‘reused for development’ (F. Linden, Schmid, & Rommes, 2007). The concept of reusability is the central tenet in these areas. So, in the context of OSS based development of CBSD /SPL it is important to assess the reusability of an asset. Reusability assessment is recognized as a research area in software engineering (Frakes & Kyo, 2005).
In (Frakes & Kyo, 2005), it is pointed out that reuse assessment is necessary to make software reuse a scientific and engineering approach. Several attempts such as (Boxall & Araban, 2004; Gui & Scott, 2007; Gui & Scott, 2008; Sharma, Grover, & Kumar, 2009; Yoonjung, Sungwook, Houp, Jingoo, & SunHee, 2008) have been made to assess the reusability of software assets. The collection and synthesis of these works needs time. It will provide insight into the current state of the art and help to identify the short comings which will pave the way forward. Following this the factors affecting reusability of software will be identified. A reusability assessment model can be formed to assess the reusability of a code asset. The importance of understanding and analysis of code cannot be neglected. As the code base is increasing, the importance of its analysis and manipulation is also increased (Harman, 2010).
45
tool to explore the phenomenon of reusability in reuse-intensive software development and OSS.
Software reuse based development has become a standard in business and commercial software development (Sommerville, 2007). Software reuse is commonly employed in two ways, first by using component libraries, as in CBSD, and second in a systematic way as in software product line development. This focuses on reuse intense development. Software artefacts are developed, from existing artefacts, with the intention of being reused. The product line development concept revolves around the terms ‘commonality’ (the requirements which are common to family members) and ‘variability’ (the distinguishing requirements).
The three generic activities for using a component in CBSD are identification, selection and adaptation of components (where this is necessary). In the past, the decision to be made was to develop a component or to buy one. Now, with the emergence of OSS, there is a third option (Höst, Oručević-Alagić, & Runeson, 2011). During the selection of components, different criteria are used. These may include legal aspects, such as license type or maintenance support for the component. In the context of this paper, a particular criterion, the reusability of a component, is assessed to facilitate the decision process.
RESEARCH METHODOLOGY
In this study, a mixed method approach is used to achieve the objectives. Mixed method research is emerging as a third option for researchers in addition to qualitative and quantitative research (Leech & Onwuegbuzie, 2009). Mixed method studies combine the qualitative and quantitative approaches. (Tashakkori & Teddlie, 1998) comments on mixed method studies: “These are studies that are the products of pragmatist paradigm and that combine the qualitative and quantitative approaches within different phases of the research process”.
Software engineering is a multidisciplinary field. It deals with social and technological issues. A software engineering activity is not only based on the processes and tools, but it also depends on the social and cognitive process around it (Easterbrook, Singer, Storey, & Damian, 2008). Therefore, study of human activities is necessary to understand a problem and its solution in the software engineering domain. The aforementioned importance of human activities in the software engineering field compels us to use the research methods of fields related to the study of human behavior.
In the software engineering field, opinions exist that suggest there should be a combination of both qualitative and quantitative research methods in software engineering research (Lazaro & Marcos, 2006). The authors also state that using a combination of qualitative and quantitative methods may be beneficial in that it provides information from a number of perspectives. The combination of qualitative and quantitative approaches in a single study is referred to as a mixed method study.
46
Research Questions
Following research questions are answered in this study:
RQ1 – What are the factors affecting reusability of open source software in reuse-intensive software development?
RQ2 – How to measure the factors affecting reusability?
RQ3 – What is the significance and nature of the relationship between reusability and its identified factors?
Research Methods
The research methods used in this study are presented in the next sections.
Interview
The interview is a means of collecting primary data; it is a conversation between two persons, one of whom is a researcher. Interviews can be used for data collection where the nature of the study is exploratory. Interviews are helpful when the data to be gathered is about a person’s knowledge, preferences, attitude or values (Gray, 2009). Several types of interviews are reported in the literature (Punch, 2009). In this study, the semi-structured type of interview is used.
Semi-structured interviews make use of both open-ended and specific questions. This combination allows the researcher to explore the issues and to collect expected information using specific questions while open-ended questions provide unforeseen information.
Respondents’ Profiles
The research issues investigated in this study are of a specialized nature. Not everybody working in industry or academia is able to answer the questions. The respondents chosen for this study were based on their expertise. It should be noted that the respondents have up to date information regarding the research and industrial practices in this area.
The interviews were audio recorded and transcribed prior to performing the analysis. The first respondent is a software engineering researcher and developer. He has experience related to human computer interaction application development.
The second respondent is a researcher with a doctorate degree in software engineering in the area of software product lines. He is an author of many publications and book chapters, including those specifically targeting software product lines and related issues.
The third respondent is an expert in software reuse research, and has been authoring research papers on software reuse since the 1980s. He is actively participating in research activities and is currently the editor of a publication in software engineering published by a prestigious body. He is currently serving as principle software architect in a well-known organization.
47
domains of accounts, student information services, examination systems and a few others involving automating small industries and NGOs.
The fifth respondent has worked in the domains of micro finance systems, accounts systems, medical laboratory systems, visa systems, and billing systems.
Qualitative Analysis Coding Process
The content analysis approach is used in this study for the analysis of qualitative data. Content analysis is a scientific tool which helps to understand the phenomenon. The content analysis is a “research technique for making replicable and valid inferences from the text (or other meaningful matter) to the contexts of their use” (Krippendorff, 2004).
The analysis is conducted following the approach presented in (Elo & Kyngäs, 2008) and (Hsieh & Shannon, 2005). The analysis process is started by generating the transcriptions from the audio recorded interviews. These transcripts are read carefully to extract the open codes (Elo & Kyngäs, 2008). The open coding process results in a list of codes. The open coding process is performed by using atlas.ti software. In this paper only one category i.e. factors affecting reusability is discussed, further details can be found in (Fazal-e-Amin, Ahmad Kamil Mahmood, & Alan Oxley, 2011e).
Survey Population and Sampling Technique
The objective of software engineering research is to provide results which are useful for the software industry. The selection of a population for a survey is one of the critical decisions. In this study the target population consists of the individuals related to the software development in Malaysia.
In this research, sample is collected using convenience sampling. The driving force to make this decision is time and resource constraints. It’s a non-probability sampling method. On contrary, the probability sampling method also requires the identification of every individual in the population which is quite difficult in this case.
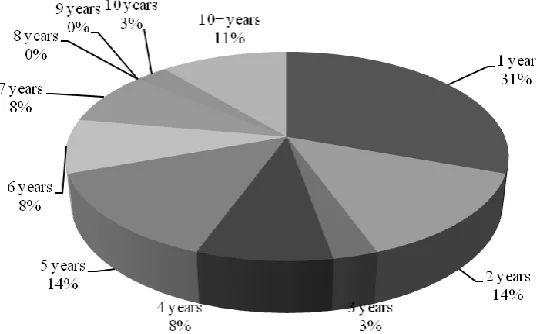
48
Figure 1. Experience of Survey population
Table 1 Survey Details
Survey Details
Confidence level 95 %
Population 91410*
Sample size needed 383
Population Accessed 2707+
Sample size collected 396
Confidence interval 4.91
Percentage 50
Calculated using calculator
(www.surveysystem.com/scalc.htm)
49
Statistical Analysis
In this study, the Pearson correlation coefficient, r, was used as a numerical measure that assesses the strength of the linear relationship between two variables (‘reusability’ and ‘factor’).
In experiment, 77 packages were assessed for their reusability. The software was downloaded from multiple sources which include Sourceforge (www.sourceforge.net),
Merobase (www.merobase.com), and FreashMeat (www.freshmeat.net).
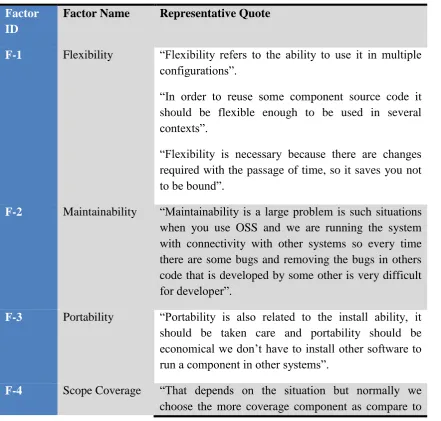
Factors Affecting Reusability
The factors identified as affecting reusability are presented in this section. The factors and corresponding quotes are presented in Table 2. Further definitions of factors and metrics are presented in appendix.
Table 2. Identified factors and representative quotes
Factor ID
Factor Name Representative Quote
F-1 Flexibility “Flexibility refers to the ability to use it in multiple configurations”.
“In order to reuse some component source code it should be flexible enough to be used in several contexts”.
“Flexibility is necessary because there are changes required with the passage of time, so it saves you not to be bound”.
F-2 Maintainability “Maintainability is a large problem is such situations
when you use OSS and we are running the system with connectivity with other systems so every time there are some bugs and removing the bugs in others code that is developed by some other is very difficult for developer”.
F-3 Portability “Portability is also related to the install ability, it
should be taken care and portability should be economical we don’t have to install other software to run a component in other systems”.
F-4 Scope Coverage “That depends on the situation but normally we
50
the less covered one”.
“… it depends on the application if we want to extend further our application then we will go for more features”.
F-5 Stability “Stable meaning reasonably error free and it could be
used with confidence that there is no bug”.
F-6 Understandability “If I don’t understand it then I can’t show that it is reliable and prove it to myself then I am not going to use it”.
“Size can be managed but if it is not understandable then it is difficult to reuse”
F-7 Usage History “Usage history also shows the maturity of the
component and how many people have used and made changes to it”.
“In many cases open source software is used by many
people many engineers, already proven its
usefulness”.
F-8 Variability “Variability is a two edge sword in other words there
are advantages and disadvantages”.
F-9 Documentation “If there is lack of documentation then I mean it
creates hurdles to understand the code for any other developer or the software engineer”.
“If there is no proper documentation then others cannot understand the software neither can change nor modify it”.
Results of Survey
The results of the survey are presented in the form of pie charts. The percentages of population selected a specific scales are presented in Figure 2 to 10.
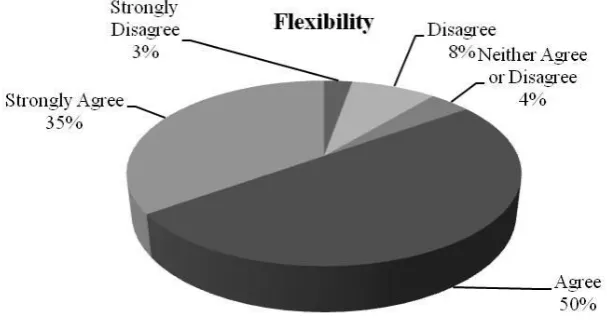
51
Figure 2. Frequency distribution of the scales assigned to flexibility
Flexibility
Scale Confidence Interval
Strongly Disagree *0% - 7.69%
Disagree 3.42% - 13.24%
Neither Agree or Disagree *0% - 8.95%
Agree 45.09% - 54.91%
Strongly Agree 29.94% - 39.76%
* The lower limit being below zero is rounded to zero, following the guidelines presented in (Beck, 2011).
52
Figure 3. Frequency distribution of the scales assigned to scope coverage
Scope Coverage
Scale Confidence Interval
Strongly Disagree *0% - 7.44%
Disagree 23.37% - 33.19%
Neither Agree or Disagree 8.22% - 18.04%
Agree 40.04% - 49.86%
Strongly Agree 6.20% - 16.02%
* The lower limit being below zero is rounded to zero, following the guidelines presented in (Beck, 2011).
The pie chart of attribute portability shows a concentrated data at scale four (agree) and five (strongly agree). It shows a consensus that portability is one of the attribute of reusability.
53
Figure 4. Frequency distribution of the scales assigned to portability
Portability
Scale Confidence Interval
Strongly Disagree *0% - 7.69%
Disagree 10.75% - 20.57%
Neither Agree or Disagree 2.67% - 12.49%
Agree 40.29% - 50.11%
Strongly Agree 23.88% - 33.70%
* The lower limit being below zero is rounded to zero, following the guidelines presented in (Beck, 2011).
54
Figure 5. Frequency distribution of the scales assigned to maintainability
Maintainability
Scale Confidence Interval
Strongly Disagree *0% - 5.67%
Disagree 2.92% - 12.74%
Neither Agree or Disagree 13.78% - 23.60%
Agree 50.39% - 60.21%
Strongly Agree 12.51% - 22.33%
* The lower limit being below zero is rounded to zero, following the guidelines presented in (Beck, 2011).
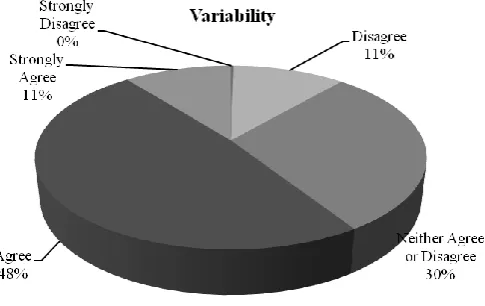
55
Figure 6. Frequency distribution of the scales assigned to variability
Variability
Scale Confidence Interval
Strongly Disagree *0% - 5.16%
Disagree 6.20% - 16.02%
Neither Agree or Disagree 24.64% - 34.46%
Agree 43.57% - 53.39%
Strongly Agree 5.70% - 15.52%
* The lower limit being below zero is rounded to zero, following the guidelines presented in (Beck, 2011).
56
Figure 7. Frequency distribution of the scales assigned to understandability
Understandability
Scale Confidence Interval
Strongly Disagree *0% - 10.72%
Disagree 4.43% - %14.25
Neither Agree or Disagree 6.71% - %16.53
Agree 48.37% - %58.19
Strongly Agree 15.04% - 24.86%
* The lower limit being below zero is rounded to zero, following the guidelines presented in (Beck, 2011).
57
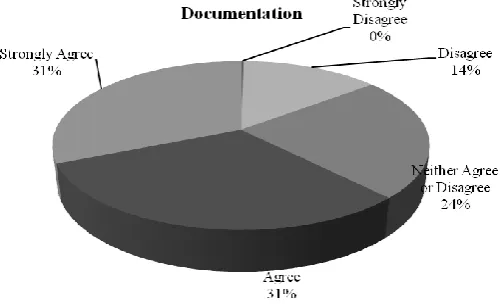
Figure 8. Frequency distribution of the scales assigned to documentation
Documentation
Scale Confidence Interval
Strongly Disagree *0% - 5.16%
Disagree 9.23% - 19.05%
Neither Agree or Disagree 18.57% - 28.39%
Agree 25.90% - 35.72%
Strongly Agree 26.40% - 36.22%
* The lower limit being below zero is rounded to zero, following the guidelines presented in (Beck, 2011).
58
Figure 9. Frequency distribution of the scales assigned to usage history
Usage History
Scale Confidence Interval
Strongly Disagree *0% - 7.44%
Disagree 5.44% - 15.26%
Neither Agree or Disagree 7.21% - 17.03%
Agree 41.05% - 50.87%
Strongly Agree 24.13% - 33.95%
* The lower limit being below zero is rounded to zero, following the guidelines presented in (Beck, 2011).
59
Figure 10. Frequency distribution of the scales assigned to stability
Stability
Scale Confidence Interval
Strongly Disagree *0% - 5.16%
Disagree 10.24% - 20.06%
Neither Agree or Disagree 13.02% - 22.84%
Agree 43.07% - 52.89%
Strongly Agree 13.78% - 23.60%
* The lower limit being below zero is rounded to zero, following the guidelines presented in (Beck, 2011).
Factors
F-1 Flexibility
It is defined as “the ease with which a system or component can be modified for use in applications or environments other than those for which it was specifically designed” (IEEE, 2010). In (Pohl, Böckle, & Linden, 2005; Sant'anna, Garcia, Chavez, Lucena, & von Staa, 2003; Sharma, et al., 2009) ‘flexibility’ is considered as a factor affecting the reusability of a component. In the context of an SPL, the flexibility characteristic is necessary for a core asset as it is intended to be reused in the development of other products.
60 F-2 Maintainability
In (IEEE, 2010), maintainability is defined as “the ease with which a software system or component can be modified to change or add capabilities, correct faults or defects, improve performance or other attributes, or adapt to a changed environment”. Two metrics, CC and MI, are used to measure maintainability.
Maintainability is related to reuse in terms of error tracking and debugging. If a component is maintainable it is more likely to be reused. In cases where OSS components are running on systems connected to another system then a bug is particularly problematic. Sometimes debugging a component on one configuration may not work on other configurations. On the other hand, in black box reuse, maintainability is not considered a factor of reusability.
F-3 Portability
It is defined as “the ease with which a system or component can be transferred from one hardware or software environment to another”. The portability of a component depends on its independence, i.e. the ability of the component to perform its functionality without external support. In a scenario where an open source component is used in SPL development, the component should have the characteristic of portability. The component, being a core asset, may be used in the development of another product/family member within the product line/family.
Portability is considered a factor in the sense that a cohesive component is more portable. A component having all the necessary information within it or having less interaction with another module during its execution is more reusable. Again, in the case of black box, portability is not a factor.
F-4 Scope Coverage
It is the factor that counts the number of features provided by the component from the list of features in the SPL scope.
Another characteristic of the open source components explored is the extent of their scope. A developer would prefer a component to cover as much of the application’s functionality as possible. Size is a concern in large components as it often means a high level of complexity and poor understandability. Furthermore, scope coverage is important in situations where future enhancements have already been envisioned, or where there is the likelihood that more features will be added in the future.
F-5 Stability
61 F-6 Usage History
Usage history provides a hint about the usefulness of the component. Another side of usage history is the maturity of the component. The component can be considered mature if it is used in many applications. The use of a component in many applications also reflects its quality of interoperability. It provides confidence to the potential user that the component can be easily adapted. Another aspect of usage history is that the use of a particular OSS in different applications provides an example of usage of a component. This example can be effective for learning purposes.
F-7 Understandability
It is defined as “the ease with which a system can be comprehended at both the system-organizational and detailed statement levels” (IEEE, 2010). In (Sant'anna, et al., 2003; Washizaki, Yamamoto, & Fukazawa, 2003) ‘understandability’ is considered a factor of reusability.
‘Understandability’ is related to the maintainability of a component; a component that is easy to understand is easy to maintain. Understandability affects the reliability of a component.
F-8 Variability
Software variability as defined in (Firesmith, 2003) is the “degree to which something exists in multiple variants, each having the appropriate capabilities”. Variability of a software component is related to its reuse as increased variability increases the likelihood of reuse. The object-oriented variability mechanisms are reported in (Fazal-e-Amin, A. K. Mahmood, & A. Oxley, 2011b). A comprehensive analysis of variability mechanisms is presented in (Fazal-e-Amin, Ahmad Kamil Mahmood, & Alan Oxley, 2011a).
The two constructs of object oriented paradigm, namely abstract classes and interfaces, support two variability mechanisms, which are ‘inheritance’ and ‘overloading’. These mechanisms facilitates the implementation of positive, negative, optional and alternative types of variability (Fazal-e-Amin, et al., 2011a). Variability can be introduced at class, method and attribute level by using these mechanisms (Fazal-e-Amin, et al., 2011a). (Here the term ‘attribute’ refers to the data in an object-program.) These mechanisms can support open scope variability at compile time (Fazal-e-Amin, et al., 2011a).
The use of metrics is proposed in this paper as a measure of variability. The abstractness metric computes the ratio of abstract classes and interfaces to the total number of classes. It can be seen as an indirect measure of variability. So, the variability capability of a package, or openness of a package towards variability, can be assessed using the abstractness metric.
62 F-9 Documentation
Documentation affects flexibility, understand-ability and reusability. The issue of documentation is multifaceted. Usually, OSS comes without much documentation. OSS is developed and contributed to by many developers. The number of developers may reach up to thousands, as in case of Linux. The code size increases rapidly. It is very difficult to analyse code without documentation.
Documentation is associated with understand-ability. The lack of
documentation, or poorly maintained documentation, hinders understand-ability. Documentation also provides a record of a component; the component history can be known by seeing the documentation.
Metrics
The following package level metrics are employed in this study. The package level metrics differs from the class level metrics due to the difference in the nature of these artefacts.
Abstractness (A)
The abstractness of a package is the ratio of the number of abstract classes and interfaces to the total number of classes (Robert Cecil Martin & Martin, 2006). Its domain is the set of real numbers [0, 1], where zero refers to a concrete package, i.e. the absence of an abstract class or interface, and 1 refers to an abstract package, i.e. where all of its classes are abstract.
A = Number of abstract classes & interfaces / Total number of classes
Cyclomatic Complexity (CC)
The cyclomatic complexity metric a measure of control structure complexity (Lincke & Lowe, 2007). It counts the linear independent paths, i.e. the minimum number of parts during the execution. It is measured on an absolute scale and its domain is the set of integers [1, ∞).
Fan-in / Afferent Coupling
The metric ‘fan-in’ is related to the total number of external classes coupled to the classes of the package. It counts the number of classes outside the package that refer to a class of the given package (Lincke & Lowe, 2007). Each class is counted for one time only. The value of the metric is zero if there is no external package that refers to the classes of the given package. This metric is equivalent to afferent coupling. It is measured on an absolute scale; its domain is the set of integers [0, ∞). A large value of fan-in represents a high dependability of other packages on the given package.
Fan-out / Efferent Coupling
63
efferent coupling. Each class is counted for one time only. The value of the metric is zero if the package is not referring to any class of an external package. It is measured on an absolute scale; its domain is the set of integers [0, ∞). A large value of fan-out represents a high dependability of the package on other packages.
Instability (I)
The instability of a package is related to the total number of external classes coupled to the classes of the package. (Robert C. Martin, 2009; Robert Cecil Martin & Martin, 2006). The instability of a package is the ratio of efferent coupling (fan-out) to the total coupling (fan-out + fan-in). It is represented by ‘I’ and its domain is the set of integers [0, 1).
I = Ce / (Ca + Ce) (eq. 1)
where Ce is efferent coupling
Ca is afferent coupling
The instability metric is also an indicator of the resilience to change. The value of 0 represents a stable package, i.e. a package that is little affected by change. The value of 1 represents an unstable package, i.e. a package that is highly affected by change.
Lines of Code (LOC)
This is a measure of the lines of source code (Fenton & Pfleeger, 1997). It indicates the size of the entity. The size of the software affects its understandability. It is measured on an absolute scale; its domain is the set of integers [0, ∞).
Lines of Comments
It is a measure of total number of comment lines in the package, measured on an absolute scale and its domain is the set of integers [0, ∞). ‘Comments’ have a positive effect on the understandability of a code asset.
Number of Classes or Interfaces
It is a measure of total number of classes in a package. The size of package affects the understandability. The number of classes is measured on an absolute scale; its domain is the set of integers [0, ∞).
Number of Methods (NOM)
64 Maintainability Index
Maintainability index (MI) (Coleman, Lowther, & Oman, 1994) value is the representative of the relative maintainability of the code (Laired & Brennan, 2006). Maintainability index is calculated by making use of lines of code, CCabe complexity metric and Halstead measures. The maintainability index is calculated by following formula:
MI = 171 – 5.2 ln (aV) – 0.23 aV(g’) – 16.2 ln (aLOC) + 50 sin[(2.4 *perCM)1/2] (eq. 2)
Where
aV = average Halstead volume per module
aV(g’) = average extended cyclomatic complexity per module aLOC = average count of lines of code per module
perCM = average percent of lines of comments per module
Application of Metrics
In this section the results of an experiment are presented. This experiment is intended to test the hypotheses formulated as a result of the interviews and survey. In this experiment the hypotheses related to a ‘package level reusability attribute model’ are tested. (The term ‘reusability attribute model’ is used for consistency with our earlier work. In the context of this paper it is preferable to think of it as a reusability factor model.) The values of reusability are calculated using the equations stated later in this paper. Pearson’s correlation analysis is conducted using statistical software. The results are presented in the form of scatter plots along with the correlation values between ‘reusability’ and its factors.
Table 3. Attribute, Sub-attribute and Metrics
Attribute Sub-attribute Metrics
Flexibility Instability I (Robert C. Martin, 2009; Robert
Cecil Martin & Martin, 2006)
Understand ability Comments, Size Number of classes, %comments, LOC (Fenton & Pfleeger, 1997), NOM (Li & Henry, 1993)
Portability Independence Fan-out (Lincke & Lowe, 2007)
Maintainability Complexity CC (Lincke & Lowe, 2007), MI
(Coleman, et al., 1994)
Variability Abstractness A (Robert Cecil Martin & Martin,
65
Due to the space limitation detailed explanation of the metrics are provided in this appendices.
Table 4. Pearson’s Correlation Values
DISCUSSIONS
At the outset of this research nine factors were identified as affecting reusability. We will now discuss, in turn, each of these factors. The first factor identified as affecting reusability is flexibility of the software. The survey results show a strong indication that ‘flexibility’ is one of the factors of reusability. The metrics shows that the strength of correlation between flexibility and reusability is .789.
The second factor identified as affecting reusability is maintainability of the software. The survey results show a strong indication that ‘maintainability’ is a factor of reusability. The metrics show that the strength of correlation between maintainability and reusability is .667.
The third factor identified as affecting reusability is portability of the software. The survey results show that the population has little confidence that ‘portability’ is one of the factors of reusability. The metrics show that the strength of correlation between portability and reusability is .693.
The fourth factor identified as affecting reusability is scope coverage of the software. The survey results show that there is some doubt as to whether or not ‘scope coverage’ is a factor of reusability.
The fifth factor identified as affecting reusability is stability of the software. The survey results point towards the importance of ‘stability’ as a factor of reusability in the scenario studies in this research.
The sixth factor identified as affecting reusability is understandability of the software. The survey results show that there is a strong indication that ‘understandability’ is a factor of reusability. The metrics show that the strength of correlation between understandability and reusability is .417.
Pearson's Correlations
Flexibility
Maintain-
ability Portability
Understan
d- ability Variability
Reusability Pearson
Correlation .789
** .667** .693** .417** .674**
Sig. (2-tailed) .000 .000 .000 .000 .000
N 77 77 77 77 77
66
The seventh factor identified as affecting reusability is the usage history of the software. The above mentioned empirical evidence points towards the importance of ‘usage history’ as a factor of reusability in the scenario studies in this research.
The eighth factor identified as affecting reusability is variability of the software. The survey results show that there is a consensus that ‘variability’ is a factor of reusability. The metrics show that the strength of correlation between variability and reusability is .674.
The ninth factor identified as affecting reusability is documentation of the software. The survey results show that there is a strong indication that ‘documentation’ is a factor of reusability.
Threats to Validity of Results
The validity of quantitative results is affected by type I and type II errors. Both of these error types are related to the rejection or acceptance of the null hypothesis. In this research study, a low value of probability is used, i.e. 0.01. This low level of the p-value ensures that there is no type I or type II errors in the results.
The validity of qualitative research is of four types: descriptive, interpretive, concurrent and theoretical. Descriptive validity is related to the reporting of events, behaviors, settings, people, places and times (Sullivan, 2009). It is of little concern to this study. Interpretive validity (Johnson & Christensen, 2011) is more of a concern to this research. Whenever there is ambiguity, the transcriptions are reviewed by the researcher to ensure the interpretive validity of the results. Furthermore, the findings of the qualitative studies are provided to the respondents. This measure was taken to cater for the possible apprehensions of respondents about the results. The respondents verified the interpretations.
Theoretical validity (Sullivan, 2009) is maintained by comparing the findings of this research study with contemporary studies. It can be safely said that the findings presented in this study are in line with the available theory.
Concurrent validity (Basit, 2010) is exhibited by the fact that the qualitative data is collected using five interviews. Similar patterns and trends are identified from the collected data. The only findings that are reported are those which are concurrent, i.e. extracted from multiple respondents.
Limitations
The approach presented in this paper is meant to be of use to software engineers etc. The approach is applied on open source software to obtain the results. The findings are specific to open source projects. The results are acquired by analysing the source code. Therefore, the results may not comply with black-box reuse, i.e. in which the user has no access to the source code of the project.
67
CONCLUSIONS
In this study, the factors affecting reusability of OSS in a reuse-intensive software development environment have been identified. These factors include the following: flexibility, understand-ability, maintainability, portability, scope-coverage, stability, usage history, variability and documentation. A survey was conducted to ascertain the relative rankings of these factors. The survey results show a high ranking for understand-ability, flexibility, maintainability, documentation and usage history. The statistical results of an experiment show a strong correlation between four of the five factors, ‘understand-ability’ being the odd one out. Further studies are required in order to identify new metrics that could be used in a similar experiment. The contributions of this study are twofold, first as a demonstration of mixed method research in software engineering. Second, the topic of reusability is revisited in the context of OSS and reuse-intensive software development.
REFERENCES
Ågerfalk, P., Fitzgerald, B., Lings, B., Lundell, B., O’Brien, L., & Thiel, S. (2006). Open Source in Software Product Line: An Inevitable Trajectory. Paper presented at the 10th International Software Product Line Conference (SPLC '06).
Ågerfalk, P. J., Deverell, A., Fitzgerald, B., & Morgan, L. (2005). Assessing the Role of Open Source Software in the European Secondary Software Sector: A Voice from Industry. Paper presented at the First International Conference on Open Source Systems, Genova.
Ahmed, F., Capretz, L. F., & Babar, M. A. (2008, July 28 2008-Aug. 1 2008). A Model of Open Source Software-Based Product Line Development. Paper presented at the Computer Software and Applications, 2008. COMPSAC '08. 32nd Annual IEEE International.
Basit, T. N. (2010). Conducting Resaerch in Educational Contexts Continuum
International Publishing Group.
Beck, K. (2011). Confidence Intervals, 2011, from
http://www.doh.wa.gov/healthyyouth/technical/confidinterval.htm
Boxall, M. A. S., & Araban, S. (2004). Interface Metrics for Reusability Analysis of Components. Paper presented at the Proceedings of the 2004 Australian Software Engineering Conference.
Burgin, M., Lee, H. K., & Debnath, N. (2004, 8-10 Nov. 2004). Software technological roles, usability, and reusability. Paper presented at the Proceedings of the 2004 IEEE International Conference on Information Reuse and Integration, IRI 2004. Coleman, D., Lowther, B., & Oman, P. (1994). Using Metrics to Evaluate Software
System Maintainability Computer, 27(8), 44-49.
Easterbrook, S., Singer, J., Storey, M.-A., & Damian, D. (2008). Selecting Empirical
Methods for Software Engineering Research Guide to Advanced Empirical
Software Engineering (pp. 285-311).
68
Fazal-e-Amin, Mahmood, A. K., & Oxley, A. (2011a). An analysis of object oriented variability implementation mechanisms. SIGSOFT Softw. Eng. Notes, 36(1), 1-4. doi: 10.1145/1921532.1921538
Fazal-e-Amin, Mahmood, A. K., & Oxley, A. (2011b). Mechanisms for managing variability when implementing object oriented components. Paper presented at the National Information Technology Symposium (NITS), King Saud University, KSA.
Fazal-e-Amin, Mahmood, A. K., & Oxley, A. (2011c). Metrics Based Variability Assessment of Code Assets In J. M. Zain, W. M. b. Wan Mohd & E. El-Qawasmeh (Eds.), Software Engineering and Computer Systems (Vol. 181, pp. 66-75): Springer Berlin Heidelberg.
Fazal-e-Amin, Mahmood, A. K., & Oxley, A. (2011d). A Review of Software
Component Reusability Assessment Approaches. Research Journal of
Information Technology, 3(1), 1-10.
Fazal-e-Amin, Mahmood, A. K., & Oxley, A. (2011e, 25-28 Sept. 2011). Using open source components in software product lines - An exploratory study. Paper presented at the IEEE Conference on Open Systems (ICOS) 2011.
Fenton, N., & Pfleeger, S. (1997). Software Metrics: A Rigorous and Practical Approach (2nd ed.): PWS Publishing Co.
Firesmith, D. (2003). Common Concepts Underlying Safety, Security, and Survivability Engineering. Pittsburgh, PA, USA: Software Engineering Institute, Carnegie Mellon University.
Frakes, W. B., & Kyo, K. (2005). Software reuse research: status and future. IEEE Transactions on Software Engineering, 31(7), 529-536.
Gravetter, F. J., & Forzano, L. A. B. (2011). Research Methods for the Behavioral Sciences (4th ed.): Cengage Learning.
Gray, D. E. (2009). Doing Research in the Real World (2nd ed.): SAGE Publication Ltd.
Gui, G., & Scott, P. D. (2007). Ranking reusability of software components using coupling metrics. Journal of Systems and Software, 80(9), 1450-1459. doi:
http://dx.doi.org/10.1016/j.jss.2006.09.048
Gui, G., & Scott, P. D. (2008, 18-21 Nov. 2008). New Coupling and Cohesion Metrics for Evaluation of Software Component Reusability. Paper presented at the The 9th International Conference for Young Computer Scientists, 2008. ICYCS 2008. . Harman, M. (2010, 12-13 Sept. 2010). Why Source Code Analysis and Manipulation
Will Always be Important. Paper presented at the Source Code Analysis and Manipulation (SCAM), 2010 10th IEEE Working Conference on.
Höst, M., Oručević-Alagić, A., & Runeson, P. (2011). Usage of Open Source in Commercial Software Product Development – Findings from a Focus Group Meeting. In D. Caivano, M. Oivo, M. Baldassarre & G. Visaggio (Eds.), Product-Focused Software Process Improvement (Vol. 6759, pp. 143-155): Springer Berlin / Heidelberg.
Howe, C. (2000). Open Source Cracks The Code: Forrester Research.
Hsieh, H.-F., & Shannon, S. E. (2005). Three Approaches to Qualitative Content Analysis. Qualitative Health Research, 15(9), 1277-1288.
69
IEEE. (2010). Systems and Software Engineering Vocabulary ISO/IEC/IEEE 24765:2010 (pp. 1-418).
Johnson, B., & Christensen, L. (2011). Educational Resaerch : Quantitative, Qualitative, and Mixed Approaches (4th ed.): Sage Publication, Inc.
Kenwood, C. A. (2001). A Business Case Study of Open Source Software: The MITRE Corporation.
Krippendorff, K. (2004). Content analysis: an introduction to its methodology (2nd ed.): Sage.
Krishnamurthy, S. (2003). A Managerial Overview of Open Source Software. Business Horizons, September-October 2003.
Laired, L. M., & Brennan, M. C. (2006). Software Measurement and Estimation : A Practical Approach: John Wiley & Sons, Inc.
Lazaro, M., & Marcos, E. (2006). An Approach to the Integration of Qualitative and Quantitative Research Methods in Software Engineering Research. Paper presented at the 2nd International Workshop on Philosophical Foundations of Information Systems Engineering (PHISE’06).
Leech, N., & Onwuegbuzie, A. (2009). A typology of mixed methods research designs. Quality & Quantity, 43(2), 265-275. doi: 10.1007/s11135-007-9105-3
Li, W., & Henry, S. (1993, 21-22 May 1993). Maintenance metrics for the object oriented paradigm. Paper presented at the Proceedings of First International Software Metrics Symposium, 1993.
Lincke, R., & Lowe, W. (2007). Compendium of Software Quality Standards and Metrics - Version 1.0.
Linden, F., Schmid, K., & Rommes, E. (2007). Software Product Lines in Action: The Best Industrial Practice in Product Line Engineering: Springer-Verlag Berlin Heidelberg.
Linden, F. v. d., Lundell, B., & Marttiin, P. (2009). Commodification of Industrial
Software: A Case for Open Source. IEEE Software, 26(4), 77-83. doi:
10.1109/ms.2009.88
Martin, R. C. (2009). Clean Code: Pearson Education, Inc.
Martin, R. C., & Martin, M. (2006). Agile Principles, Patterns, and Practices in C#: Prentice Hall.
Niemi, T., Tuisku, M., Hameri, A.-p., & Curtin, T. (2009). Server-Based Computing Solution Based on Open Source Software. Information Systems Management, 26(1), 77-86. doi: 10.1080/10580530802552227
Pohl, K., Böckle, G., & Linden, F. v. d. (2005). Software Product Line Engineering Foundations, Principles, and Techniques: Springer-Verlag Berlin Heidelberg. Punch, K. F. (2009). Introduction to Research Methods in Education Sage Publications
Ltd.
Samadi, S., Almaeh, N., Wolfe, R., Olding, S., & Isaac, D. (2004, 20-24 Sept. 2004). Strategies for enabling software reuse within the Earth Science Community. Paper presented at the Proceedings of IEEE International Geoscience and Remote Sensing Symposium, 2004. IGARSS '04. .
70
Sharma, A., Grover, P. S., & Kumar, R. (2009). Reusability assessment for software
components. SIGSOFT Softw. Eng. Notes, 34(2), 1-6. doi:
http://doi.acm.org/10.1145/1507195.1507215
Sommerville, I. (2007). Software Engineering (8th ed.): Addison-Wesley.
Stafford, J. (2006). Time to plan your company’s escape from Microsoft.
SearchExchange.com Retrieved 01 June 2011, from
http://searchenterpriselinux.techtarget.com/news/1163576/2006-Time-to-plan-your-companys-escape-from-Microsoft
Sullivan, L. E. (2009). The SAGE Glossary of the Social and Behavioral Sciences: Sage Publications, Inc.
Tashakkori, A., & Teddlie, C. (1998). Mixed Methodology Combining Qualitative and Quantitative Approaches: SAGE Publications, Inc.
Washizaki, H., Yamamoto, H., & Fukazawa, Y. (2003). A Metrics Suite for Measuring Reusability of Software Components. Paper presented at the Proceedings of the 9th International Symposium on Software Metrics.
Wasserman, A. (2011). How the Internet transformed the software industry. Journal of Internet Services and Applications, 2(1), 11-22. doi: 10.1007/s13174-011-0019-x Wheeler, D. A. (2005). Why Open Source Software / Free Software (OSS/FS, FLOSS,
or FOSS)? Look at the Numbers! Retrieved 01 June, 2011, from
http://www.dwheeler.com/oss_fs_why.html
Wood, M., Daly, J., Miller, J., & Roper, M. (1999). Multi-method research: An empirical investigation of object-oriented technology. Journal of Systems and Software, 48(1), 13-26.
Yoonjung, C., Sungwook, L., Houp, S., Jingoo, P., & SunHee, K. (2008, 17-20 Feb. 2008). Practical S/W Component Quality Evaluation Model. Paper presented at the 10th International Conference on Advanced Communication Technology, 2008. ICACT 2008. .