1
The presentation of an exploratory algorithm for the rectangle
packing problem on the basis of the best fit algorithm and the
lowest front-line strategy
Mohamad Bozorgi Perija (1), Morteza Mohammadi Zanjireh (2)
(1) MSc from Imam Khomeini International University, Ghazvin, [email protected]
(2) Assistant professor of computer engineering group, Imam Khomeini International University, Ghazvin,
ABSTRACT
Nowadays, the wasting of resources is one of the fundamental challenges of the industrial sector. The rectangle packing problem can be very effective in this context. Practical applications of this issue in the timing and designing of the industries and businesses are very remarkable. The purpose of this issue is to arrange a set of rectangles with specific dimensions in a rectangular page with a specific width and unlimited height without overlapping. The fundamental challenge in this issue is that this is an NP-complete issue. Therefore, it is difficult to achieve the best arrangement, which has the maximum rate of resource utilization and also has a linear running time. Many algorithms have been presented to estimate a practical solution for this issue. In the past decades, the best fit method has been one of the most useful methods for this purpose. This study presents a combinatorial algorithm based on two algorithms, including the lowest front-line strategy and the best-fit algorithm. The running results indicate that the suggested algorithm performs well, despite its simplicity. The time complexity of the suggested algorithm is O(nm), in which n is the number of input rectangles and m is the number of the created front lines.INDEX TERMS Rectangle packing problem, Best-fit algorithm, lowest front-line strategy
I. INTRODUCTION
Decreasing the wasting of resources in industry and business can be very advantageous. The rectangle packing problem is one of the most practical issues in the industrial sector. The rectangle packing problem has many uses in the industry, including cutting leather, wood, metals, paper, glass, cloth, and paperboard [7-9, 32] for designing and manufacturing cars [1], fighters [12], and ships [11], and for designing VLSI [31, 14, 13, 32] and in similar issues like timing and replacement [15, 16]. It also has uses in the assignment and timing of the radio frequencies spectrum [15].
In the rectangle packing problem, we have a set of rectangles with specific dimensions and the target is to arrange these rectangles in a rectangular page with a constant width and unlimited height without overlapping, provided that the packing is orthogonal [33]; it means that the sides of the rectangles that are inserted into the rectangular page are parallel to the sides of the main page rectangle [14, 17]. Also, the problem may not be guillotine cut; it means that we cannot place the replaced rectangles in several groups that each group is separated from the others by vertical or horizontal lines [7, 31]. Rotation of the
rectangles is acceptable, but the rotation angle could be only 90 degrees [18, 19].
As stated, one of the fundamental challenges in the industry is waste reduction and in other words, increasing the utilization rate. Utilization rate equals to the sum of the area of the input rectangles divided by the area of the main page used and is represented by U [3, 18, 20]. Utilization can be calculated by equation (1):
U= (1)
In this equation, width represents the main page width, and height represents the main page height and and are width and height of the replaced rectangles, respectively, and m is the
number of these rectangles [18].
packing problem and the conditions prevailing over it in the past four decades. In [35], comprehensive research has been done in this context. The best-fit algorithm is one of the most useful algorithms. The purpose of this study is to represent an algorithm for the rectangle packing problem with an optimal utilization rate and linear running time using the best-fit algorithm.
This article will be structured as follows: in the second section, we will introduce the works done on the rectangle packing context and also the best-fit decreasing height and the lowest front line algorithms. In the third section, we will present our algorithm. In the fourth section, we will represent the results of algorithm implementation, and in the fifth section, we will conclude
.
II. Background of the research
One of the algorithms that have attracted many researchers during the past four decades is the best-fit algorithm. It’s a layered algorithm in which the layers are created gradually, as the rectangles are inserted. The rectangle places into the higher level if it can’t be placed in a layer. The rectangle will always be located in a layer that has less waste after insertion [7].
Wei et al. [37] have presented an algorithm based on the best-fit algorithm with a branch & bound approach for the rectangle packing problem with constant dimensions. This algorithm has a reasonable utilization rate and also a linear running time. Despite a desirable utilization rate for more massive data, the running time of the algorithm increases. Huang et al. [27] have presented an algorithm based on two algorithms, including the best-fit algorithm and particle swarm optimization algorithm. They compared their method with the presented classical methods and got more efficient results. But the fundamental challenge of their approach is the long-running time of the algorithm. Bruke et al. [36] have presented an algorithm based on the best-fit algorithm, and this is a linear order algorithm. This algorithm has a reasonable utilization rate compared to the optimizing algorithms. The use of very similar data is one of the challenges of this algorithm.
BL (bottom left) algorithm is one of the first algorithms presented for the packing problem, and Brenda [36] presented it. The purpose Of the BL algorithm is to place the rectangles at the lowest and leftmost points possible. This algorithm is suitable for little input, and its Running order is O ( ).
Chazelle [30] have presented an algorithm called BLF (Bottom Left Fill). The number of possible modes for inserting a rectangle is decreased in the BLF algorithm. While in the BL algorithm, it is not possible to use the leftover spaces from placing the rectangles, in the BLF algorithm, the rectangle is placed at the lowest point possible. The BLF algorithm uses unused spaces. The time complexity of this algorithm is O( ).
Liu and Teng [29] have presented an algorithm for the rectangle packing problem based on two algorithms,
including the BL algorithm and the genetic algorithm. They improved the initial BL algorithm because it does not identify some of the modes. As the mode in which the rectangles are alternately big and small; the big rectangles have ascending sizes, and the small ones have descending scales. The positive point of this algorithm is the use of an intelligent crowd function for the genetic algorithm. The running order of this algorithm is O( ).
Hu et al. [33] have presented an algorithm based on two algorithms, including best-fit and BL algorithms. This algorithm has all of the properties of the two mentioned algorithms. This algorithm categorizes the rectangles first and then places the created categories one by one. This method is suitable for rectangles with different sizes. The time complexity of this algorithm is O(mMlogM), in which m and M could be equal to the number of input rectangles. Liu et al. [18] have presented a solution for rectangle packing problem by combining the lowest front-line algorithm with the genetic optimization algorithm. Arrangement of the rectangles from the lowest point possible to the highest point is a prominent feature of this algorithm that reduces the space waste. It also utilizes a smart function to cross local optimum modes. The long running time of this algorithm for identifying and improving various modes is its fundamental challenge. In the following, two algorithms are introduced, including best-fit decreasing height algorithm and the lowest front-line strategy.
A. The lowest front-line strategy
The lowest front-line strategy is designed based on the BL algorithm and is defined as follows [18]:
First step: the algorithm starts with the initial quantification of the front line. In the beginning, the front lines set contained only one line, and that is the horizontal line at the bottom of the page.
Second step: locating the rectangle in a place using the lowest front-line strategy. is the position where the i-th rectangle is placed. First, we select and check one line of the front line set to see whether the width of the rectangle that is going to place is equal to or smaller than the width of the selected line. If the conditions are right, that rectangle will be placed at the top left of the page. If the conditions are not right, we increase the height of the lowest line until it reaches the second lowest front line, and the conditions will be rechecked. This process repeats until one line of the front lines set gets selected. In this step, if several lines exist with the lowest heights, the selection will be based on the X-axis. If we increase height from a lower line to a higher line, these two lines will be merged.
Third step: in this step, the front line will be updated. Some of the old lines will be converted to the new lines, and new lines will be added to the front-line set. As the points mentioned in the second step, the adjacent lines with equal height must be merged to form a single line.
we will go to the second step.
Figure 1 presents an example of the lowest front-line
strategy. will be selected for { }, and after that, the
front line will be { , }. In the same way, will
be selected for { }, and after the placement, the front
line will be { }. Similarly, after placing
the rectangle in { }, the front line will be {
}. In this point, the lowest line is
{ }, and it does not have enough space to place . So
we increase the height of { } until it reaches { },
the second lowest front line. Finally, the { } line will
be selected to place the rectangle, and the front line is
{ } at the end [25-33].
Figure 1: the lowest front-line strategy
The lowest front-line strategy does not sort the input rectangles before placing it, and this is a challenge for this algorithm. It increases page height and decreases the utilization rate. Also, this algorithm always tries to find the lowest and the leftmost point possible to place the rectangles. The way the height increases in this algorithm is its positive point.
B. the best-fit decreasing height method
In the best-fit decreasing height algorithm, first, the rectangles are sorted in decreasing order. Then the biggest rectangle will be placed at the bottom-left corner, and the first layer will be created. In order to place the next rectangles, if the rectangles could not be placed in the created spaces of the created layer, we create a layer above the highest layer and place the rectangle in it. If there are several layers with enough space to place the rectangles, a
layer will be selected that has less waste after the rectangle placement [23, 24]. The time complexity of this algorithm is O(nlogn) [25].
The best-fit decreasing height algorithm is layered and is suitable for non-guillotine cut issues. Finding the best position with the lowest waste is a benefit of this algorithm. Also, due to sorting the inputs, this algorithm has a better utilization rate compared to the best-fit algorithm without sorting. In this algorithm, we cannot place a rectangle between two layers, and this causes wasting. Therefore, we can place the rectangle between the layers in the proposed algorithm.
This study presents an algorithm that has the properties of both best-fit decreasing height algorithm and the lowest front-line strategy. This algorithm, similar to the best-fit method, always tries to find the best position for the rectangle. However, this algorithm tries to decrease the total height by increasing the height of the layers, inspired by the lowest front-line strategy.
III. The proposed algorithm
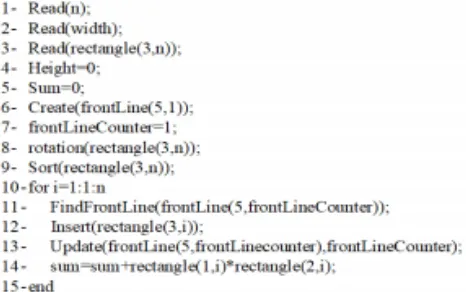
The steps of our algorithm are as follows:
First step: at first, the algorithm starts with initial quantification. The height of this page is zero at the beginning, and its final value is specified at the end of the algorithm. In this algorithm, we have a set of lines called the front line for saving empty spaces. In the beginning, the front line is the bottom borderline of the page. The information of the input rectangles such as width, height, and the number of each one will be received at this stage of the algorithm.
In this algorithm, we use an array to save empty spaces. The first row of this frontline array is the starting point of the line, and the second row of the frontline shows the endpoint of the line. The third row of the frontline array represents the distance of this line from the lowest front line, which is the bottom borderline of the page. The fourth row of the frontline array shows the height of the next frontline after this line. With these four points, we can imagine a rectangle. If the value of the fifth row of the frontline array is 1, it means that this line is not occupied and when a rectangle is placed, this value will become -1. The fifth row of the array is added to adhere to the not-overlapping assumption. When placing rectangles into a line using the fifth row of the frontline array, it will be checked whether this place is full or empty.
Second step: in this step of the algorithm, the rectangles that have more height than width will be rotated 90 degrees. It means that the height and the width will be replaced. Third step: in this step, the rectangles will be sorted in decreasing height size order.
among the selected lines, we choose a line that has less wasting. At this point, there are three modes:
• If a line is found among the frontlines set that have sufficient width and height for placing the rectangle, we select it; and if there are several lines for placing, we choose the one that wastes less space.
• If we cannot find a line with required height and width, we start searching among the longest frontlines for a line that has required width for placing the rectangle. Also, if there are several lines, we choose the one that has less width and increases the height of the page lesser.
• If we cannot find a position to place the rectangle in the two predicted modes mentioned above – if we did not find any line that has enough space for placing the rectangle – then we create a new layer above the longest frontline and place the rectangle in the bottom-left of the created layer and increase the height of the page.
Fifth step: in this step, we update the frontline and empty spaces, and convert some of the old lines into new lines and also add new lines. Then in this step, we must identify all of the empty spaces. Then we must identify all of the empty houses that have common borders. In order for the algorithm to make the most of the wasted space available, if one or more than two houses have common borders, it must be merged with the house that creates larger free space after merging compared to other houses. This step plays an essential role in reducing waste.
Sixth step: in this step, we check the ending of the algorithm. If there is not a rectangle in the input list to place, the algorithm ends. Otherwise, we go to the beginning of the fifth step and continue the algorithm again. In the end, we calculate the utilization rate of the
algorithm. Figure 2 shows the flowchart of the algorithm process.
Figure 2: Semi-code of the proposed algorithm
IV. The evaluation results
In this study, in addition to the proposed algorithm, we used the best-fit decreasing height algorithm [33] and the lowest frontline strategy [34] in the MATLAB programming language v.2014 and also a hardware with Intel(R) Core (TM) i7-4710HQ CPU @ 2.50GHz processor and 12 Gb internal storage.
We used the data in the Liu algorithm [18] for the
evaluation of the algorithms. Then we compared
the results of the three algorithms with the results in the Liu study [35-44]. Table 1 shows these data, and also the width of the rectangle page is 400 units.
Table 1: data presented in
number 1 2 3 4 5 6 8 9 10 11 12 13 14 15 16 17 18 19 20
width 25 18 79 121 29 64 48 11 46 4 5 6 7 8 9 10 11 10 50
height 36 24 84 30 48 98 59 17 121 22 41 72 25 65 24 11 36 30 61
quality 4 5 3 4 11 2 3 2 2 1 2 2 2 2 3 2 2 3 2
Table 2 shows the results of these algorithms. The proposed algorithm in this study has the best performance among these algorithms. Our method reached the utilization rate of 94.37% in 0.023 seconds. Whereas the method presented in [45-53] reached the utilization rate
average of 85.51% after 300 times repeating the algorithm and 26.3 seconds, and at best, it has reached the rate of 87.75%.
algorithm Proposal Liu Front line Best-fit
utilization %94.37 %87.75 %50.54 %87.17
Run time(s)
0.023 26.3 0.042 0.031
Figure 3 shows the utilization rate diagram of the three best-fit decreasing height, the lowest frontline strategy, and the proposed algorithms. In this diagram, the utilization rate percentage of every algorithm has been drawn after placing each rectangle. The horizontal axis represents the number of placed rectangles, and the vertical axis represents the utilization rate percentage.
Figure 3: the utilization rate diagram of the three best-fit decreasing height, the lowest frontline strategy, and the proposed algorithms
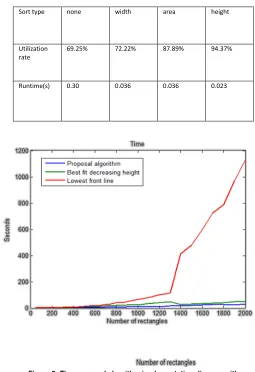
Figure 4 shows the diagram of the running time of the three algorithms, including best-fit decreasing height, the lowest frontline strategy, and the proposed algorithm. In this figure, the best running time belongs to the proposed algorithm.
Figure 4: the running time diagram of the best-fit decreasing height algorithm, the lowest frontline strategy, and the proposed algorithm
A- the effects of the sorting and 90-degree rotation on the utilization rate
In this section, we analyze the effects of the
sorting and rotation on the utilization rate.
Sorting the input rectangles has a major impact
on the utilization rate. We sorted the input
rectangles in descending order of height, width,
and area of the rectangles, and then we ran the
algorithm. The results of running the algorithm
show that sorting
in descending order of height has better results. Table 3 shows the results of thiscomparison, and figure 5 shows the utilization rate diagram for various sorting modes.
Table 3: The results of running the proposed algorithm with different sorting
Sort type none width area height
Utilization
rate 69.25% 72.22% 87.89% 94.37%
Runtime(s) 0.30 0.036 0.036 0.023
Figure 5: The proposed algorithm implementation diagram with different sorting
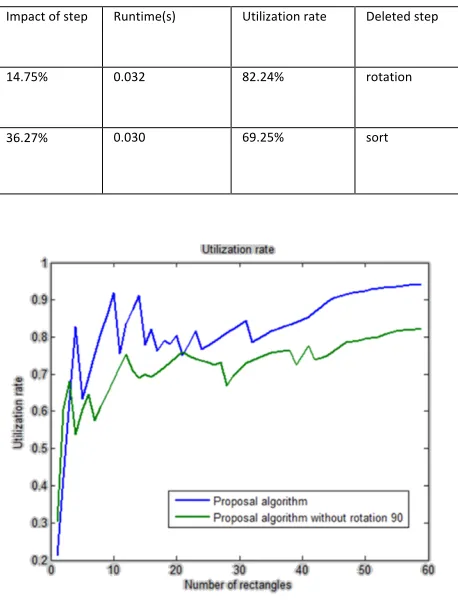
Table 4: the results of the proposed algorithm implementation with removing the rotation step and sorting
Impact of step Runtime(s) Utilization rate Deleted step
14.75% 0.032 82.24% rotation
36.27% 0.030 69.25% sort
Figure 6: the diagram of the algorithm with and without the rotation step
B-comparing the algorithm with random data Comparing the algorithm with low volume data and also,
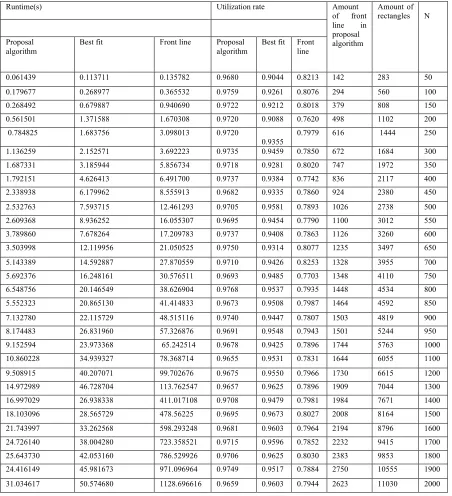
in some cases, comparing the algorithm with high similarity data, is one of the challenges of the presented algorithms. Practically, we are facing various data with different sizes in the industry. Therefore, in this section, we analyzed the proposed algorithm, the lowest frontline strategy, and the best-fit algorithm, by producing random data. The results of the running show the utilization rate of the proposed algorithm is better than the other two algorithms, and also it has a shorter running time. Table 5 shows the utilization rate and the running time of these algorithms. Also, figure 8 shows the running time diagram of these three algorithms.
Figure 7: the utilization rate diagram of the best-fit, frontline, and proposed algorithms with random data
Table 5: the results of the utilization rate of the proposed algorithm byproducing random data
C- The time complexity
The time complexity of the proposed method is the polynomial order. It means that in the worst case, it needs O(m) time for searching between m frontlines and finding the proper line to place the rectangle. Since this searching must be done for all of the rectangles, and the total number of rectangles is n. Therefore, the time complexity
of this algorithm is generally linear in time order and equals to O(nm). The results of the implementation indicate that the value of m is always less than n. It means that at the end of the algorithm implementation, the total number of the frontlines is always less than the total number of the rectangles. In table 5, the total number of rectanglescolumn is n, and the total number of frontlines column is m, and m is always less than n. The diagram in figure 7 demonstrates how the number of frontlines increases per number of input data.
Runtime(s) Utilization rate Amount
of front line in proposal algorithm
Amount of rectangles N
Proposal algorithm
Best fit Front line Proposal
algorithm
Best fit Front line
0.061439 0.113711 0.135782 0.9680 0.9044 0.8213 142 283 50
0.179677 0.268977 0.365532 0.9759 0.9261 0.8076 294 560 100
0.268492 0.679887 0.940690 0.9722 0.9212 0.8018 379 808 150
0.561501 1.371588 1.670308 0.9720 0.9088 0.7620 498 1102 200
0.784825 1.683756 3.098013 0.9720
0.9355
0.7979 616 1444 250
1.136259 2.152571 3.692223 0.9735 0.9459 0.7850 672 1684 300
1.687331 3.185944 5.856734 0.9718 0.9281 0.8020 747 1972 350
1.792151 4.626413 6.491700 0.9737 0.9384 0.7742 836 2117 400
2.338938 6.179962 8.555913 0.9682 0.9335 0.7860 924 2380 450
2.532763 7.593715 12.461293 0.9705 0.9581 0.7893 1026 2738 500
2.609368 8.936252 16.055307 0.9695 0.9454 0.7790 1100 3012 550
3.789860 7.678264 17.209783 0.9737 0.9408 0.7863 1126 3260 600
3.503998 12.119956 21.050525 0.9750 0.9314 0.8077 1235 3497 650
5.143389 14.592887 27.870559 0.9710 0.9426 0.8253 1328 3955 700
5.692376 16.248161 30.576511 0.9693 0.9485 0.7703 1348 4110 750
6.548756 20.146549 38.626904 0.9768 0.9537 0.7935 1448 4534 800
5.552323 20.865130 41.414833 0.9673 0.9508 0.7987 1464 4592 850
7.132780 22.115729 48.515116 0.9740 0.9447 0.7807 1503 4819 900
8.174483 26.831960 57.326876 0.9691 0.9548 0.7943 1501 5244 950
9.152594 23.973368 65.242514 0.9678 0.9425 0.7896 1744 5763 1000
10.860228 34.939327 78.368714 0.9655 0.9531 0.7831 1644 6055 1100
9.508915 40.207071 99.702676 0.9675 0.9550 0.7966 1730 6615 1200
14.972989 46.728704 113.762547 0.9657 0.9625 0.7896 1909 7044 1300
16.997029 26.938338 411.017108 0.9708 0.9479 0.7981 1984 7671 1400
18.103096 28.565729 478.56225 0.9695 0.9673 0.8027 2008 8164 1500
21.743997 33.262568 598.293248 0.9681 0.9603 0.7964 2194 8796 1600
24.726140 38.004280 723.358521 0.9715 0.9596 0.7852 2232 9415 1700
25.643730 42.053160 786.529926 0.9706 0.9625 0.8030 2383 9853 1800
24.416149 45.981673 971.096964 0.9749 0.9517 0.7884 2750 10555 1900
V. The evaluation results
In this study, we presented an algorithm for the rectangle packing problem. Also, we implemented the proposed algorithm along with the best-fit decreasing height and the lowest frontline strategy. Also, we compared the proposed algorithm with the algorithm presented in [18]. The results of the evaluation show the better utilization rate of the proposed algorithm in comparison with other mentioned algorithms. The proposed algorithm has improved the utilization rate by 86.72% in comparison with the lowest frontline strategy, 8.26% in comparison with the best-fit decreasing height algorithm, and 7.43% in comparison with the algorithm presented by Liu. The time complexity of the proposed algorithm is O(nm), in which n is the number of the input rectangles and m is the number of created front lines.
Since this problem is NP-complete, there are modes that the presented algorithm cannot find them. Therefore, for future studies, we can use this algorithm along with optimizing algorithms like genetic algorithms. In the algorithm that we will present, we first consider a solution to the problem with the best-fit algorithm presented in this study. Then we improve the presented solution every time we repeat the genetic algorithm.
REFERENCES
1. Agawal, P.K. and shing, M.T. (1992) ‘Oriented aligned rectangle-packing problem’, European journal of operational research, 62:2, 210-220. 2. Wu, Y.L. and Huang, W. and Lau, S.C. and
Wong, C.K. and Young, G.H. (2002) ‘An effective quasi-human based heuristic for solving the rectangle packing problem’, European Journal of Operational Research, 141:2, 341-358.
3. Maberg, J. and Schneider, J. (2011) ‘Rectangle packing with additional restrictions’, Theoretical Computer science, 412:50, 9648-9658.
4. Korf, R.E. (2003) ‘Optimal Rectangle Packing: Initial Results’, ICAPS’2003-13th International
Conference on Automated Planning and Scheduling, 09 - 13 June, Italy, Trento, 287-295. 5. Li, Q. and Yang, S.Y. and Zhu, S. (2012)
‘Solving 2D Rectangle packing problem Based on Layer Heuristic and Genetic Algorithm’, IHMSC’2012 - 4th International Conference on Intelligent Human-Machine Systems and Cybernetics, 26-27 Aug, Nanchang, China, 192-195.
6. Zandiyan S, Fotohi R, Koravand M. P‐method: Improving AODV routing protocol for against network layer attacks in mobile Ad‐Hoc networks. International Journal of Computer Science and Information Security. 2016 Jun 1;14(6):95.
7. Jamali, S., & Fotohi, R. (2017). DAWA: Defending against wormhole attack in MANETs by using fuzzy logic and artificial immune system. the Journal of Supercomputing, 73(12), 5173-5196.
8. Lodeiro-Santiago, M., Caballero-Gil, P.,
Aguasca-Colomo, R., & Caballero-Gil, C. (2019). Secure UAV-Based System to Detect
Small Boats Using Neural Networks.
Complexity, 2019.
9. Fotohi, R., Heydari, R., & Jamali, S. (2016). A Hybrid routing method for mobile ad-hoc networks. Journal of Advances in Computer Research, 7(3), 93-103.
10. Fotohi, R., & Bari, S. F. (2020). A novel countermeasure technique to protect WSN against denial-of sleep attacks using firefly and Hopfield neural network (HNN) algorithms. The Journal of Supercomputing, 1-27.
11. Huang, W. and Chen, D. and Xu, R. (2007), ‘A new heuristic algorithm for rectangle packing’, Computers & Operations Research, 34:11, 3270-3280.
12. Virk, A.K. and Singh, K. (2017) ‘Solving Multi-objective Two Dimensional Rectangle Packing Problem’, Advances in Intelligent Systems and
Computing, 547,188-196.
13. Hu, Y. and Hashimoto, H. and Imahori, S. and Uno, T. and Yagiura, M. (2016) ‘a partition based heuristic algorithm for the rectilinear
block packing problem, journal of the
Operations Research Society of Japan, 59:1, 110-129.
14. Zhang, D. and Che, Y. and Ye, F. and Si, Y.W. and Stephen C. H. and Leung (2016) ‘A hybrid algorithm based on variable neighborhood for the strip packing problem’, Journal of Combinatorial Optimization, 32:2, 513-530. 15. Wu, Y.L. and Huang, W. and Lau, S.C. and
Wong, C.K. and Young, G.H. (2002) ‘An effective quasi-human based heuristic for solving the rectangle packing problem’, European Journal of Operational Research, 141:2, 341-358.
16. Sarkohaki, F., Fotohi, R., & Ashrafian, V. (2017). An efficient routing protocol in mobile ad-hoc networks by using artificial immune system. International Journal of Advanced Computer Science and Applications (IJACSA), 8 (4).
Approach for Detection and Isolation Misbehavior Attacks in Wireless Networks. JCP, 13(6), 705-720.
19. Mabodi, K., Yusefi, M., Zandiyan, S., Irankhah, L., & Fotohi, R. Multi-level trust-based intelligence schema for securing of internet of things (IoT) against security threats using cryptographic authentication. The Journal of Supercomputing, 1-25.
20. Fotohi, R., Jamali, S., Sarkohaki, F., & Behzad, S. (2013). An Improvement over AODV routing protocol by limiting visited hop count. International Journal of Information Technology and Computer Science (IJITCS), 5(9), 87-93. 21. Virk, A.K. and Singh, K. (2016) ‘Solving
Bi-objective Two-Dimensional Rectangle Packing Problem using Binary Cuckoo Search’, International Journal of Computer Science and Information Security, 14:7, 165-169.
22. Zhu, Y.H. (2016) ‘Parameter Analysis of Placement Function for the Rectangular Packing Problem Based on GA’, Materials Science Forum, 836-837, 381-386.
23. Wang, S. (2017) ‘Solving Rectangle Packing
Problem Based on Heuristic Dynamic
Decomposition Algorithm’. EETA’2017-2nd
International Conference on Electrical and Electronics: Techniques and Applications, 15-16
January, China, Beijing, 187-196.
24. Jansen, Y. and Oba, R.S. (2009) ‘Rectangle
packing with one-dimensional resource
augmentation’, Discrete Optimization, 6:3, 310-323.
25. Huang, E. and Korf, R.E. (2013) ‘Optimal Rectangle Packing an Absolute Placement Approach’, Journal of Artificial Intelligence research, 46, 47-87.
26. Bortfeldt, A. (2013) ‘A reduction approach for solving the rectangle packing area minimization problem’, European Journal of Operational Research, 224:3, 486-496.
27. Chlebik, M. and J Chlebikova, J. (2009) ‘Hardness of approximation for orthogonal
rectangle packing and covering
Problems’, Journal of Discrete Algorithms, 7:3, 291-305.
28. Liu, H. and Zhou, J. and Wu, X.S. and Yuan, p. (2014) ‘Optimization Algorithm for Rectangle packing problem Based on Varied-factor Genetic Algorithm and Lowest Front-Line Strategy’, CEC’2014 - Congress on Evolutionary Computation July 6-11, Beijing, China, 1084-1091.
29. Bansal, N. and khan, A. (2014) ‘Improved Approximation Algorithm for Two-Dimensional Bin packing on discrete algorithm’, Society for Industrial and Applied Mathematics, 25, 13-25
30. Liu, Z. (2017) ‘On Continuity Properties for Infinite Rectangle Packing’, Cornell University Library.
31. Wei, L. and Zhang, D. and Chena, Q. (2009) ‘A least wasted first heuristic algorithm for the rectangular packing problem’, Computers & Operations Research, 36:5, 1608-1614.
32. Behzad, S., Fotohi, R., & Jamali, S. (2013). Improvement over the OLSR routing protocol in mobile Ad Hoc networks by eliminating the unnecessary loops. International Journal of Information Technology and Computer Science (IJITCS), 5(6), 2013.
33. Behzad, S., Fotohi, R., & Dadgar, F. (2015). Defense against the attacks of the black hole, gray hole and wormhole in MANETs based on RTT and PFT. International Journal of Computer Science and Network Solutions (IJCSNS), 3, 89-103.
34. Seyedi, B., & Fotohi, R. NIASHPT: a novel intelligent agent-based strategy using hello packet table (HPT) function for trust Internet of Things. The Journal of Supercomputing, 1-24. 35. Fotohi, R., Bari, S. F., & Yusefi, M. (2019).
Securing Wireless Sensor Networks Against
Denial‐of‐Sleep Attacks Using RSA
Cryptography Algorithm and Interlock Protocol.
International Journal of Communication
Systems.
36. Zhang, D. and Che, Y. and Ye, F. and Si, Y.W. and Stephen C. H. and Leung (2016) ‘A hybrid algorithm based on variable neighborhood for the strip packing problem’, Journal of Combinatorial Optimization, 32:2, 513-530. 37. Ntene, N. and Van, J.H. and Vuuren, (2009) ‘A
survey and comparison of guillotine heuristics for the 2D oriented offline strip packing problem’, Discrete Optimization, 6:2, 174-188. 38. Anika, D. and Garg, D. (2014) ‘Parallelizing
Generalized One-Dimensional Bin Packing Problem using MapReduce’, IACC’2014 -International Advanced Computing Conference, 21-22 Feb, Gurgaon, India, 628-635.
39. Mhaiskar, N.D. and Rahman, M. (2014) ‘two-dimensional rectangle packing problems: a survey’, International Journal of Computer, Information Technology & Bioinformatics, 2:1, 10-15.
40. Wei, L. and Limb, A. (2017) ‘An adaptive selection approach for the 2D rectangle packing area minimization problem’, Omega, 66, 1-26. 41. Fotohi, R., & Jamali, S. (2014). A
42. Jamali, S., & Fotohi, R. (2016). Defending against wormhole attack in MANET using an artificial immune system. New Review of Information Networking, 21(2), 79-100.
43. Jamali, S., Fotohi, R., Analoui, M. (2018). An Artificial Immune System based Method for Defense against Wormhole Attack in Mobile Adhoc Networks. TABRIZ JOURNAL OF ELECTRICAL ENGINEERING, 47(4), 1407-1419
44. Fotohi, R. (2020). Securing of Unmanned Aerial Systems (UAS) against security threats using human immune system. Reliability Engineering & System Safety, 193, 106675.
45. Fotohi, R.; Nazemi, E. An Agent-Based Self-Protective Method to Secure Communication between UAVs in Unmanned Aerial Vehicle Networks. Preprints 2020, 2020010229 (doi: 10.20944/preprints202001.0229.v1).
46. Huang, L. and Liu1, Z. and Liu, Z. (2014) ‘An Improved Lowest-level Best-Fit Algorithm with Memory for the 2D Rectangular Packing Problem’, ISEEE’2014 International Conference on Information Science Electronics and Electrical Engineering, 26-28 April, Japan, Sapporo, 1279-1282.
47. Daoden, K. and Thaiupathump, T. (2017), ‘Applying Shuffled Frog Leaping Algorithm and Bottom Left Fill Algorithm in Rectangular
Packing Problem’, ICEIEC’2017-7th IEEE
International Conference on Electronics
Information and Emergency Communication, 21-23 July, Macau, China, 136-139.
48. Liu, D. and Teng, H. (1999) ‘An improved BL-algorithm for genetic BL-algorithm of the orthogonal packing of rectangles’, European
Journal of Operational Research, 112:2,
413-420.
49. Chazelle, B. (1983) ‘the bottom-left Bin-packing heuristic: an efficient implementation’, IEEE transaction on computers, 32:8, 697-707. 50. Wei, L. and Zhu, W. and Lim, A. and Liu, Q.
and Chen, X. (2018) ‘An adaptive selection approach for the 2D rectangle packing area minimization problem’, Omega, 80, 22-30. 51. Hu, Y. and Fukatsu, S. and Hashimoto, m H. and
Imahori, S. and Yagiura, M. (2018) ‘Efficient overlap detection and construction algorithms for the bitmap shape packing problem’, Journal of the Operations Research Society of Japan, 61: 1,132-150.
52. Mohanty, R. and Kiran, P. (2017) ‘New Results on Next Fit and First Fit On-line Algorithms for Square and Rectangle Packing’, ICACCI’2017 -International Conference on Advances in Computing, Communications and Informatics, 13-16 Sept, Udupi, India, 2201-2207.