http://www.sciencepublishinggroup.com/j/ajce doi: 10.11648/j.ajce.20190705.11
ISSN: 2330-8729 (Print); ISSN: 2330-8737 (Online)
Earned Value Analysis for Construction Projects Using
Project Management Scheduling Engine
Mohammad Azim Eirgash
Department of Civil Engineering, Faculty of Engineering, Karadeniz Technical University, Trabzon, Turkey
Email address:
To cite this article:
Mohammad Azim Eirgash. Earned Value Analysis for Construction Projects Using Project Management Scheduling Engine. American Journal of Civil Engineering. Special Issue: Application of Earned Value Analysis in Construction Projects. Vol. 7, No. 5, 2019, pp. 121-125. doi: 10.11648/j.ajce.20190705.11
Received: September 19, 2019; Accepted: October 15, 2019; Published: October 23, 2019
Abstract:
One of the most important functions of project management is the monitoring and control of the project process. To perform it, Earned Value Analysis (EVA) in project management is a well-known management system to be applicable. This analysis is a very significant technique to measure and control the performance and progress of a project and is used in various sectors. It allows the calculation of cost and timing variances and performance indices and predicts project cost and project duration estimation. In addition, the usage of the correlation between the schedule performance index and cost performance index and the meaning of indices such as budgeted cost of work scheduled, budget cost of work performed, and the actual cost of work performed is illustrated in detail to analyze the performance of EVM application in the project management. Thereby, in this study, some of the work items of a sample project using Microsoft Office Excel were evaluated according to the Earned Value Analysis and the result implies that the analysis helped the project perform better through the cost and schedule indices.Keywords:
Earned Value Analysis, Performance Indices, Scheduling, Variances, Project Management1. Introduction
Today's high competition conditions, all businesses operating in the public and private sector have been made to move much faster than the past times. Therefore, it is seen that almost every company in the business life carries out many projects simultaneously. Regardless of the scope and purpose of the projects, one of the most important criteria for the success of these projects is the presence of a skilled project manager. Project control is the activities carried out within the scope of monitoring and updating the project. Within the scope of the control, the differences between the project plan and the actual situation are examined and the current plan is updated according to the actual situation. Thus, the project progress is tried to be controlled. If there is a delay in the project after the update, the project manager may try to prevent the delay by allocating additional resources to future activities. Deviations in the success of the project can be minimized by making healthy decisions as a result of controlling and updating the project. In addition to time changes in the project, substantial measures related to cost and quality should be monitored. In this context, S-curves are one
of construction sectors as well as projects [4]. Moreover, Vandevoorde and Vanhoucke prompted that the topmost trustworthy approach to forecasting time in fruition is the earned schedule technique [5].
Lipke et al. is presented an assured determining system of the total project cost and time span on enhance the potential of project managers to making educated choices [6]. Aceves et al. recommended a graphical structure to EVM should consolidate the measurements from claiming venture expense and plan for management of risk [7]. Czemplik applied EVM to progress supervision of construction projects [8]. The essential idea of earned value might have been concentrated starting with those industrial engineering approaches, which to point of interest investigated “cost-performance” methodology. In the transform about cost-performance evaluation, those comparability about wanted and genuine qualities of values furthermore expense might have been attained. In course of time span, the utilization of this system was not restricted just on state industrial also military undertakings but is for all that moderately unwell exerted to trading and exclusive projects
[9]. The value of the EVM is that it meets a precise dimension of the cost and time yield in the guiding of project tracking as well as supervision. Christensen and his colleagues in time span of 1998-2002 carried out a scientific study and expressed that the cost performance index determiner obtained at the 15-20% of project ending, ensures a substantially trustworthy scale for forecasting of total project cost with a maximum error of ±10% [10].
Moslemi-Naeni et al. indicated another fuzzy-based earned value instance with the benefit of rising and examining the earned value indices and the time and the cost estimates toward fruition under questionable matter [11]. Eirgash et al. [12] has demonstrated the theoretical and practical dimension of performance measurement on a small-scale construction project using the earned value methodology, and thereby contribute to its wider practical application.
Earned Value is an improvement over traditional accounting progress measures. Traditional methods focus on planned expenditure and actual costs. With clearer picture, managers can create risk mitigation plans based on actual cost, schedule and technical progress of the work. It is an early warning project management tool that enables managers to identify and control problems before they become insurmountable. It allows projects to be managed better – on time and on budget.
In this study, the parameters constituting the analysis were explained. Then, Earned Value Analysis is applied on some work items related to a small sample project, and the performance of the work items have been evaluated, and at the end, discussion and conclusion are provided, respectively.
2. Basic Concepts
Earned value management (EVM) combines a project’s domain, schedule, under a bound together situated metrics to monitor and forecast the project’s performance. Description about the greater part EVM terms is given in Table 1.
Table 1. Earned Value Terms [13].
Term Description Interpretation
PV (BCWS) Planned Value
It is the budgeted cost for the work scheduled to be completed on an activity or WBS component in a particular time. It is obtained from the cash flow diagram (The S-curve).
EV (BCWP) Earned Value It is the budgeted amount for the work actually accomplished on the schedule activity
or work breakdown structure (WBS) component during a given time.
AC (ACWP) Actual Cost It is resolved from accounting records that keeps record of actual expenditure money,
that means it is secret and actual money spent by the contractor.
BAC Budget at Completion The total approved budget when the scope of the project is completed.
EAC Estimate at Completion The expected total cost of the project when the defined scope of work is completed.
ETC Estimate to Complete The expected extra cost necessary to finish the project.
Cost Variance (CV) EV – AC Negative means over budget, Positive means under budget
Schedule Variance (SV) EV – PV Negative means behind schedule, Positive means ahead of schedule
Cost Performance Index (CPI) EV / AC More than 1 means Profit and less than 1 means loss.
Schedule Performance Index (SPI) EV / PV More than 1 means ahead of schedule and less than 1 means behind the schedule.
The graph shown in Figure 1 is a beneficial means for the project manager to supervise project efficiency depending upon advancement reports based on interpretations of CPI and SPI data. By a method for following the development about these indices through those project’s existence cycle,
managers could identify deviations from arranging along these lines that they could make initial restorative actions. An exemplary of an ideal format to outline level reporting to management is demonstrated in Figure 2.
Table 2. Represents the Status Report Of The Project.
BAC 4000 TL
Day BCWS (Planned) BCWP (Earned) ACWP (Actual)
2 2000 1500 1800
3 3000 2700 2500
4 4000 3600 3700
Figure 1. SPI and CPI Analysis Matrix of a Project.
Figure 2. Earned Value Analysis curve.
3. Application
EMPIRICAL STUDIES OF EVM IN CONSTRUCTION The key issues for empirical studies include effective implementation of EVM, behaviors of CPI, accuracy of cost control techniques, and accuracy of time control techniques. The non-empirical studies are concerned with SPI at different WBS levels, accuracy of time control techniques, and the integration of EVM with other project management techniques.
A 4-walled room with 10 m2 each will be constructed. Approximate cost of the project is 100 TL unit price per square meter is calculated as: 10 × 4 × 100 = 4000 TL. The duration of the project is 4 days. According to the schedule work, 10 m2 wall is expected to be built daily. The work breakdown structure of the project consists of one item and it is 40 m2 wall construction. On the second day of the project, according to the accounting records, the total amount of money spent for that work is determined 1800 TL. It was observed that 15 m2 wall was constructed. Earned value analysis on the 2nd, 3rd and 4th day review of the project is detailed in Table 2 and Table 3 demonstrates the obtained values of status report of the project.
Planned Value (PV): 2 days × 10 m2 / day × 100 TL / m2 =
2000 TL.
Actual cost (AC): According to accounting records: 1800 TL.
Earned Value (EV): 15 m2 × 100 TL = 1500 TL.
Table 3. Obtained Values Of Status Report Of The Project.
Variance Indices Forecasting Variance
CV SV CPI SPI ETC EAC BAC
-300.0 -500.0 0.833 0.750 3000 4800 4000
200.0 -300.0 1.080 0.900 1204 3704 4000
-100.0 -400.0 0.973 0.900 411 4111 4000
CV=BCWP – ACWP, SV=BCWP – BCWS, CPI=BCWP/ACWP, SPI=BCWP/BCWS, ETC= (BAC-BCWP) / CPI, EAC= ACWP+ETC.
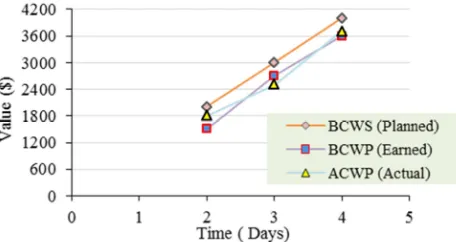
Figure 3. Planned vs estimated values.
Based on the analysis of the status report and graphical indication in Figure 3, the estimated cost of the project at completion for the 2nd day of the updating (after 40% of the project execution) is 4800 TL which 800 TL over the original budget of 4000TL. The project is projected to have a significant cost overrun.
Similarly the analysis of the status report and graphical indication reveals that the estimated cost of the project at completion for the 3nd day of the updating is 3703.704 TL which is 296,296 TL under the original budget of 4000TL.
Also the analysis of the status report and graphical indication represents that the estimated cost of the project at completion for the 4th day of the updating is 4111.111 TL which is 111.111 TL under the original budget of 4000TL.
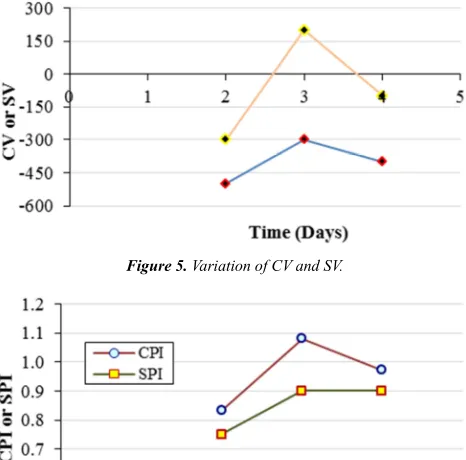
According to the analysis of the status report and graphical representation of Figure 4 and 5 which are associated each other, the earned value of the project for the 2nd day of the updating reveals that both the CV (Cost variance) and SV (Schedule variance) are smaller than zero which describes that the project is behind the schedule and making losses or over budget. In case of 3nd day updating both the CV (Cost variance) is greater than zero and SV (Schedule variance) is less than zero which means that the project is behind the schedule while making profit or under budget. But again on the 4th day updating of the earned value, both CV as well as SV are less than zero which represent that the project is making loss since it is behind schedule. By analyzing the graphical demonstration of CPI and SPI indices in Figure 6, the following comments can be stated.
Review of the project on the 2nd day:
According to the graphical interpretations of figure 6, CPI and SPI both are less than 1.0, CPI<1 implies a weak cost performance. That earned value is short of what the real costs for this reporting period. Also in case of SPI < 1.0, the schedule performance is significantly worse than planned and behind the schedule. The total project progress outline demonstrates the improvement and cost contrasts in the entire project. The positivity of the curve values increments as the CPI curves approach the assessed developed curve. At the point when expanded contrast edges are shown in the information, project managers or significant level officials can utilize the information to decide the reason, and after that plan reaction techniques dependent on the curve with an expanded distinction.
Figure 5. Variation of CV and SV.
Figure 6. Graphical representation of CPI and SPI index.
Review of the project on the 3rd day:
In this case values of CPI is greater than 1.0 represent good project performance. But, the SPI is less than 1.0, which defines the schedule performance isn’t carrying on better than planned.
Review of the project on the 4th day:
Both CPI as well as SPI indices are less than 1.0, which indicate the cost performance isn’t proceeding well and the project is over budgeted, but schedule performance is slightly worse and the project is running behind the schedule, which points out the project won’t be accomplished fairly after than planned.
Based on the graphical representation of CPI and SPI in Figure 7. The following comments can be stated.
a)Updating the project on the 2nd day represents that both CPI and SPI indices are located in Zone III which is (Behind Schedule – over budgeted).
b)Review of the project on the 3rd day shows that both CPI and SPI indices are located in Zone IVwhich is behind the schedule and over budgeted.
c)Updating the project on the 4th day indicates that both CPI and SPI indices are located in Zone IV which is behind the schedule and is over budgeted.
Figure 7. Graphical representation of CPI and SPI index.
4. Summary and Conclusion
The Earned Value Analysis is a proven method for identifying delays and budget overruns due to the limitations and evaluating business progress. Earned value for a given task as the budgeted cost of the work performed is calculated and is a function of “time, work completion and budget”. Cost control with Earned Value Analysis is also an effective approach for financial management of construction projects. Earned value performance indices and deviations from project analysis enable monitoring of current and forecasting of future progress of projects.
total project cost as well as duration. Regardless of pattern and frame of the project and with an accurate schedule plan and suitable tracking practice, this particular approach can be used as an early warning means to project teams, indicating that specific section of the project is not being done as per the planned schedule, therefore it avoids great deviation of cost sliding, time or scope.
5. Recommendation
Taking into account the present study‘s findings, future works can carry on to extend the EVM practice in procurement management. Furthermore, it is favorable to integrate fuzzy based earned value analysis with time cost trade off optimization models. This control mechanism can help project managers to take the advantage of a comprehensive model to schedule, control, and reschedule a project through the life cycle.
References
[1] R. Avlijaš and G.; Avlijaš, Upravljanje projektom. Beograd: Univerzitet Singidunum, In Serbian, 2010.
[2] S. Leu, A. Chen and C. Yang, “A GA-based fuzzy optimal model for construction time–cost trade-off”, International Journal of Project Management, 19 (1), 47-58, 2001.
[3] Fleming. Q. W and Koppelman. J. M, “Earned Value Project Management, Project Management Institute”, Newtown Square, PA, 1996.
[4] Kim. E, Wells. W. G and M. R. Duffey, A model for effective implementation of Earned Value Management methodology.
International Journal of Project Management, 21 (5), 375-382, 2003.
[5] Vandevoorde, S. and Vanhoucke, M. “A comparison of different project duration forecasting methods using earned value metrics”. International Journal of Project Management, 24 (4), 289–302, 2005.
[6] Lipke et al. “The probability of success”. The Journal of Quality Assurance Institute, January, 14–21, 2004.
[7] Acebes et al. “Beyond Earned Value Management: A Graphical Framework for Integrated Cost, Schedule and Risk Monitoring”. Procedia - Social and Behavioral Sciences, 74, 181-189, 2013.
[8] Czemplik, A. “Application of Earned Value Method to Progress Control of Construction Projects”. Procedia Engineering, 91, 424-428, 2014.
[9] Noori. S, Bagherpour. M and Zareei. A, Applying fuzzy control chart in earned value analysis: a new application. World Applied Sciences Journal, 3 (4), 684-690, 2008.
[10] Christensen. D. S and Templin. C, “EAC evaluation methods:” do they still work. Acquisition Review Quarterly 9, 105-116, 2002.
[11] Moslemi-Naeni et al. “Evaluating fuzzy earned value indices and estimates by applying alpha cuts”. Expert Systems with Applications, 38 (7), pp. 8193-8198, 2011.
[12] Eirgash M. A., Toğan V., Kazaz. A; “Application Earned Value Based Metrics to Enhance the Performance Measurement of Engineering Project Management”, Nevsehir Journal of Science and Technology. pp 431-439, 2017.
![Table 1. Earned Value Terms [13].](https://thumb-us.123doks.com/thumbv2/123dok_us/1010717.1601000/2.595.45.553.688.742/table-earned-value-terms.webp)