Article
1
Determination of the optimal size of photovoltaic
2
systems by using Multi-Criteria Decision Making
3
Methods
4
Guido C. Guerrero-Liquet 1,*,†, Santiago Oviedo-Casado 2,*,†, J.M. Sánchez-Lozano 3, M. Socorro
5
García-Cascales 1, Javier Prior 2,4 and Antonio Urbina 1
6
1 Department of Electronics, Computers Technology and Projects, Technical University of Cartagena, c/Dr.
7
Fleming, s/n 30202, Cartagena, Murcia, Spain; [email protected]; [email protected];
8
9
2 Departamento de Física Aplicada, Universidad Politécnica de Cartagena, 30202 Cartagena, Spain;
10
[email protected]; [email protected]
11
3 Centro Universitario de la Defensa de San Javier. Academia General del Aire. Universidad Politécnica de
12
Cartagena (UPCT), Murcia, Spain; [email protected]
13
4 Institute Carlos I for Theoretical and Computational Physics, Universidad de Granada, Granada 18071,
14
Spain; [email protected]
15
* Correspondence: [email protected] & [email protected] Tel.: +34-968-326-514
16
17
Abstract: The diverse socio-economic and environmental impacts that the set-up of a new
18
photovoltaic installation has must be weighed carefully in order to reach the best possible
19
solution. Among the different photovoltaic systems there are several classification criteria,
20
depending on the technology, application and the size of the modules that define them. The size
21
(installed nominal capacity) stands out as an impartial and critical measure in the decision making
22
process. In this article we use a multi-criteria decision making method to analyse the responses of
23
five experts to a detailed questionnaire in which several different criteria are correlated with
24
various photovoltaic installation sizes. The limitation associated to the low number of experts is
25
addressed with a robustness and sensitivity analysis. With this study we seek first, to apply and
26
demonstrate the feasibility of a methodology which combines technical information with
multi-27
criteria decision making methods, and second, to obtain a clear result oriented that increases the
28
benefits of a forthcoming photovoltaic installation of modules in distributed generation adding up
29
to 1GW total peak power in standard conditions. We observe a consistent result in which smaller
30
photovoltaic modules are the ideal solution that maximises the socio-economic benefits of any
31
installation. If a decision has to be taken about the type of photovoltaic plant to be installed, the
32
conclusion is clear: given a certain size, small, easily scalable installations are the best solution for
33
stake-holders, for the inhabitants, and for the environment.
34
Keywords: Solar electricity; Photovoltaic Systems; Distributed Generation (DG); Multi-Criteria
35
Decision Making (MCDM); Analytic Network Process (ANP); Technique for Order of Preference
36
by Similarity to Ideal Solution (TOPSIS).
37
List of acronyms: ANP: Analytic Network Process, CIGRÉ: The International Council of Large Electrical Systems,
38
DEMATEL: Decision making trial and evaluation laboratory, DG: Distributed Generation, ELECTRE: Elimination and
39
Choice Expressing Reality, GW: gigawatt, kWp: kilowatts peak, LCOE: Levelled cost of electricity, MCDM: Multi-Criteria
40
Decision Making, MWp: megawatts peak, PV: Photovoltaic solar energy, PROMETHEE: Preference ranking organization
41
method for enrichment evaluation, TOPSIS: Technique for Order of Preference by Similarity to Ideal Solution, VIKOR:
42
Multi-criteria Optimization and Compromise Solution, wc: weight of the sub-criteria.
43
44
1. Introduction
45
The For many years industrialized countries have increasingly generated electricity in large
46
centralized facilities. The electricity thus generated comes mainly from fossil fuels, nuclear energy,
47
hydroelectric plants and large solar or wind power plants [1]. However, both climate change
48
awareness and the increasing scarcity and raising prices of fossil energy sources are inducing a shift
49
in the way energy is produced globally. Renewable energy sources are experiencing an important
50
increase in the installed power per year.
51
The International Council of Large Electrical Systems (CIGRÉ) defines as Distributed
52
Generation (DG) those generation units with a maximum capacity ranging from a few kW to a
53
hundred MW, which are usually connected to the distribution network and which are not centrally
54
designed [2]. Also, DG can be defined as the generation of energy by small-scale units that are
55
installed in the distribution systems where the energy is consumed by the end users [3]. The main
56
objective of the distribution network is to provide a reliable and efficient service for consumers
57
while ensuring that voltage levels and quality of supply are within normal parameters [4].
58
Traditionally, this objective is achieved through the reinforcement of existing lines and substations
59
or through the installation of new DG systems [5, 6]. If the DG includes renewable sources it will
60
contribute to a cleaner electricity mix [7].
61
Photovoltaic solar energy (PV) connected to the grid can be expanded as a modular DG. This
62
would save initial investments in smaller systems that can be later upgraded to larger ones, and
63
make their installation by the end-user quite practical [8]. In addition, the modular nature of
64
photovoltaic technologies allows cost per unit of installed power capacity and power conversion
65
efficiency almost independent of the size of the installation. Therefore, photovoltaic distributed
66
energy is of great interest for decentralised energy production. The distributed photovoltaic
67
systems have a significant impact on price [9, 10]. If the total cost of the system is considered the
68
distributed rooftop solar PV system is in principle more expensive than large-scale solar PV plants,
69
but has followed a similar price reduction trajectory --especially in the cost of the photovoltaic
70
modules-- and is nowadays competitive with (or cheaper than) retail electricity prices in many
71
locations (considered as levelled cost of electricity, LCOE) [11]. Contrary to most conventional
72
energy sources, photovoltaic technology has a wide range of applications in a wide range of sizes.
73
For this reason, the size parameters of the DG have to be carefully determined to improve the
74
performance and overall efficiency of the PV. Therefore, the proper size of a distributed power
75
installation is crucial factor for reliability and to meet consumer demand.
76
Most of the studies aiming to determine the optimal size of photovoltaic installations have
77
focused on small-scale facilities, namely those ranging from solar roofs in the consumer or end user
78
[12]. However, some recent studies emphasize that large solar power plants or large-scale
79
installations are the most recommended, as they guarantee supply needs are covered and they
80
reduce greenhouse gas emissions considerably [13]. In our study, the modules composing the
81
optimum installation are required to add up to 1 GW. We aim to correlate several different
82
economic, technical, and environmental criteria to obtain the ideal module size of a photovoltaic
83
DG installation for each possible application.
84
It is clear that adequately classifying the size is a crucial aspect when determining the optimal
85
modules of a distributed generation photovoltaic installation [14]. In this article, we have divided
86
these facilities into an small and medium-sized plants category (composed of less than 1 MW of
87
power units, and between 1 and 5 MW respectively), corresponding to those usually installed in
88
homes and buildings [15]1.
89
With regard to the classification of DG units by order of installed power, scientific research
90
currently uses many definitions including [1]: a few kilowatts up to 50 MW (Electric Power
91
Research Institute), between 5 and 25 MW (Gas Research Institute), or less than 50-100 MW
92
1 A second category, including larger sizes (> 5MW) but still adding up to 1 GW is presented in the Appendix A.
(CIGRÉ). The categorisation by installed power is typically divided between: Individual Systems or
93
Power Plants [16]: individual systems are those with a power unit size (or generation capacity) of
94
the order of kW and power plants are photovoltaic installations that have a power unit around MW
95
and large-scale photovoltaic systems or small-scale photovoltaic systems [17]: Large-scale
96
photovoltaic systems are considered to be solar plants greater than 500 kW and small-scale
97
photovoltaic systems are considered to be solar installations greater than 3 kW and less than 500
98
kW. Here, we will employ the classification proposed by [18] in 2012 and which is summarised in
99
Table1.
100
101
Size Categories Power
Small and medium distributed generation
Micro-distributed generation ~ 1 W <5 kW
Small distributed generation 5 kW <5 MW
Large distributed generation
Medium distributed generation 5 MW <50 MW
Large distributed generation 50 MW <300 MW
Table 1. Different ratings of distributed generation (Source: Viral and Khatod, 2012). The small and medium
102
constitutes the main focus of this article while the results for the large category are presented in
103
Supplementary Information (S.I.) A.
104
To analyse the relative influence of in principle unrelated, independent, or incomparable criteria,
105
powerful optimization techniques and expert advisory panels are needed [19, 20]. Here we employ a
106
committee composed of five experts with heterogeneous background2, who select a total of 14 criteria, which
107
are then analysed employing Multi-criteria Decision Making Methods (MCDM) [21, 23], in search for the
108
best size alternative fulfilling the decision criteria. To overcome the limitation of the low number of experts
109
caused mainly by the length of the questionnaires, we perform a sensitivity analysis implemented in
110
Matlab/Octave software, to assert the robustness of the method and the optimal scale chosen between the
111
different alternatives. Thus in this article a MCDM supported by robustness analysis is for the first time used
112
to the problem of size in photovoltaic installations, revealing that, contrary to the common paradigm,
113
installations composed by smaller, easily scalable modules maximise the socio-economic and environmental
114
benefits of photovoltaic energy.
115
This article is organized as follows: in Section 2, the methodology (i.e. the specific MCDM)
116
employed to analyse the experts’ responses and correlations among the criteria is described in
117
detail. Section 3 is dedicated to present the results obtained from applying the MCDM to optimize
118
the size of photovoltaic solar installations and the result of the sensitivity analysis. Finally Section 5
119
presents the conclusions.
120
2. Materials and Methods
121
A MCDM is a methodology for making complex problem decisions in a systematic and
122
structured way [24], with the objective to provide an effective framework for the classification and
123
selection of one or more options from a set of alternatives [25]. Practical problems are often
124
characterized by several contradictory criteria, and there may be no solution that meets all the
125
criteria simultaneously. The solution has to be a compromise, according to the preferences of the
126
decision maker [26].
127
The best-known methods based on multi-criteria decision include the following: AHP, ANP,
128
ELECTRE, PROMETHEE, TOPSIS, VIKOR and DEMATEL [27]. MCDM has been substantially
129
applied in the energy fields, such as site selection, or project and equipment evaluation [28, 32]. In
130
order to achieve our objective, we combine two widely-used multi-criteria decision methods: The
131
2
The panel is composed by academics working in renewable energy technology (from Technical University of Cartagena),
ANP (Analytical Network Process) developed by Saaty [33] and the TOPSIS (Technique for
132
Preference by Similarity to Ideal Solution) developed by Hwang and Yoon [22]. The evaluation
133
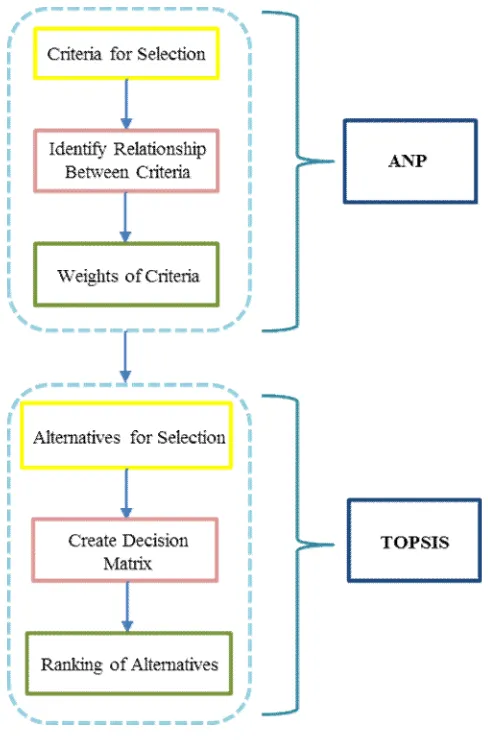
procedure of this study consists of the following phases, shown here in Figure 1.
134
The first step is to identify the multiple criteria that are considered in the decision-making
135
process. Then, the experts determine the relative influence among the different criteria by
136
evaluating the degree of interdependence. After constructing the dependence network, the relative
137
weights of the different criteria are calculated with ANP. Finally, TOPSIS is used to provide a
138
ranking of the alternatives [34].
139
140
141
142
Figure 1. Schematic representation of the different phases of a combined ANP-TOPSIS
143
methodology.
144
The ANP-TOPSIS combination eliminates many of the ANP procedures as redundant.
145
Calculations and comparisons by additional pairs are avoided in classifying the alternatives [35],
146
hence allowing a solution to be obtained in a shorter time. The ANP-TOPSIS combination has been
147
used in other areas (see S.I. A); but in the field of photovoltaic solar energy it is used for the first
148
time in this study. The reason may be that the ANP methodology has only recently been introduced
149
into the scope of multi-criteria methodology [36].
150
The ANP is a generalization of the Analytical Hierarchical Process (AHP) methodology in
151
which hierarchies are replaced by networks to capture the results of dependency and feedback
152
within and among elements [21]. Many traditional MCDM are based on the assumption of
153
independence. However, most situations do not meet the independence condition [25]. Therefore,
154
ANP is divided into two parts. The first consists of a hierarchy of control or the network of criteria
155
and sub-criteria that controls the interactions. The second is a network of influences between
156
relative influence of the different criteria from which the general priorities derive [28]. Here, the
158
ANP is used to obtain the relative weight of each of the criteria for the proposed model.
159
The TOPSIS method is a decision model for the classification of preferences by similarity to the
160
ideal solution. The basic principle of the method is the search for an alternative that minimises the
161
distance with the positive ideal solution [38]. In TOPSIS, the weight of each of the criteria is known
162
a priori (hence ANP). However, in many real situations clear data are inadequate to model real-life
163
situations, since human judgement is vague and cannot be estimated with exact numerical values.
164
This method allows searching for the better alternatives for each criterion exposed in a simple
165
mathematical form, with the relative importance weights incorporated in the comparison
166
procedures [25]. Here, TOPSIS is used to obtain the values of the alternatives. The ANP-TOPSIS
167
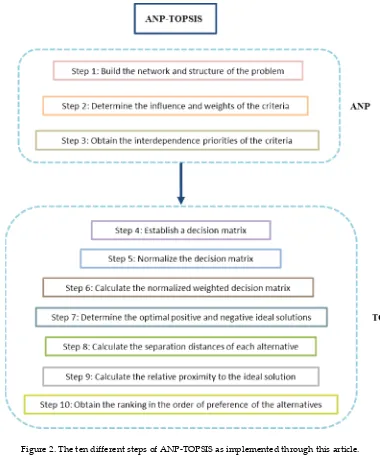
methodology proposed is thus composed by the ten steps presented in Figure 2.
168
169
170
Figure 2. The ten different steps of ANP-TOPSIS as implemented through this article.
171
172
173
3. Results
175
We use ANP-TOPSIS to tackle the question of size of photovoltaic installations, according to
176
the classification shown in the previous section (Table 1): small / medium and large scale (shown in
177
the S.I. A) of photovoltaic systems for distributed generation. For this analysis a team composed of
178
5 experts belonging to the photovoltaic energy sector and representing areas such as: installer
179
engineers, academics, researchers and users where interviewed using a detailed questionnaire.
180
Three question sessions were held for each expert per case. In the first session, the criteria and
sub-181
criteria were selected, and the relative influence of each of the sub-criteria to one another was
182
answered by the experts, leading to the matrix of interaction domination (step 1 of ANP-TOPSIS in
183
Figure 2), composed of 1's and 0's depending on whether a sub-criteria is influenced by another, or
184
not.
185
The second session questioned both the importance and influence of the criteria among
186
themselves, asking whether a criterion is inconsequential (1) or extremely important (9) to another
187
(step 2 of ANP-TOPSIS in Figure 2). The geometric mean of each of the resultant matrices leads to
188
the importance priorities among criteria and sub-criteria (step 3 of ANP-TOPSIS in Figure 2), which
189
when multiplied by the interaction domination matrix gives us the relative weights of each of the
190
sub-criteria, which will be used to evaluate the alternatives. In this step, consistency measures are
191
calculated to assert the uniformity of each expert.
192
In the last session the experts value the qualitative criteria for each alternative (step 4 of
ANP-193
TOPSIS in Figure 2), which is then normalised (step 5) and weighted (step 6), i.e. each alternative,
194
composed by 14 values corresponding to each of the sub-criterion, is multiplied by the
195
corresponding weight calculated in the previous steps.
196
Finally, to decide the alternatives ranking, the ideal positive and negative values (step 7) are
197
calculated from the best possible positive/negative weighted alternatives, then the geometric
198
distance of each of the alternatives to the ideals are calculated (step 8) and with it the relative
199
proximity to the ideal solution (step 9). Finally, a ranking of alternatives according to the relative
200
proximity to the ideal is established (step 10). The following subsections present the system
201
components (criteria, factors and alternatives), results and the comparative analysis.
202
This section may be divided by subheadings. It should provide a concise and precise
203
description of the experimental results, their interpretation as well as the experimental conclusions
204
that can be drawn.
205
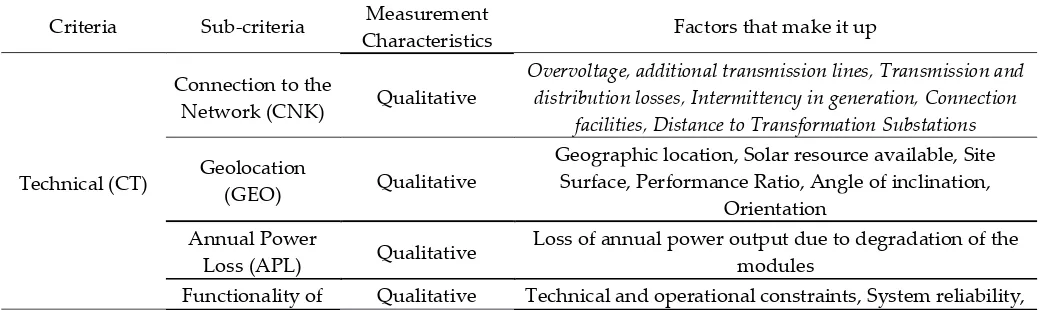
3.1 Criteria and factors to consider for the optimal size in PV
206
First, four large main groups of criteria have been established. They are the general criteria that
207
determine the optimum size of the photovoltaic system: technical, economic, environmental and
208
social criteria. Fourteen sub-criteria are selected from almost 70 determining factors that affect the
209
optimal size of a distributed generation photovoltaic system (Table 2) that recent studies show [39]
210
[40, 42], according to the criterion to which it belongs. These sub-criteria are divided into
211
quantitative and qualitative according to the characteristics of measurement in each case.
212
213
Criteria Sub-criteria Measurement
Characteristics Factors that make it up
Technical (CT)
Connection to the
Network (CNK) Qualitative
Overvoltage, additional transmission lines, Transmission and distribution losses, Intermittency in generation, Connection
facilities, Distance to Transformation Substations Geolocation
(GEO) Qualitative
Geographic location, Solar resource available, Site Surface, Performance Ratio, Angle of inclination,
Orientation Annual Power
Loss (APL) Qualitative
Loss of annual power output due to degradation of the modules
the System (FUS) System Degradation
Economic (CE)
Economic Costs
(EC) Quantitative
Operating costs, Investment cost, Maintenance Cost, Cost of electricity supplied by the network, Saving
transmission Economic
Barriers (EB) Qualitative Barriers to financing, Barriers in hiring Incentives and
Economic Profitability (IEP)
Qualitative
Possible Aid and tax relief, Additional income due to possible emission reduction, Internal rate of return (IRR), Net Present
Value (NPV),
Environmental (CM)
Physical Impacts on the Ground
(PIG)
Qualitative Natural Restrictions in the topography of the land, , Land availability, Environment
Environmental
viability (EV) Qualitative
Environmental impact, Reducing Greenhouse Gas Emissions, Recovery End of Life Photovoltaic Project, Legal restrictions on
environmental protection
Social (CS)
Generated Employment
(GE)
Quantitative
Employment generated in the construction phase, Employment Generated in the operation phase, Employment Generated in the dismantling and recycling
phase Regulatory
framework (RE) Qualitative Regulatory framework
Socio-political Perception of the Population (SPP)
Qualitative
Acceptance of the community and perceived equity, Public perception of information, Socio-political impacts , Poverty
alleviation and reduction of inequalities
Socio-economic
Viability (SV) Qualitative
Promotion of energy savings and awareness towards environmental problems, Development of local infrastructure, Production of goods and services,
Economic development Electric Supply
Service (ESS) Qualitative
Energy utilization , Local dispatch ability, Degree of User Satisfaction, Demand coverage
214
Table 2. Parameters determining the small and medium size of a distributed generation photovoltaic system.
215
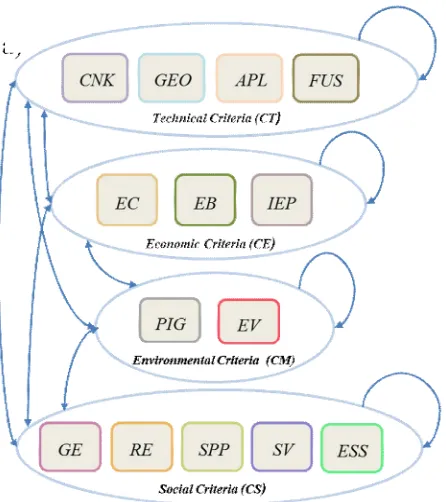
With the knowledge the criteria and the factors that compose them, the panel of specialists
216
218
Figure 3. The interrelation among criteria, used for the evaluation of small and medium
219
scale systems. Notice that the arrows indicate that each cluster has relation with criteria
220
within other clusters and within the same cluster. The same relation has been used for
221
large systems (see Supplementary Information).
222
3.2 Results of the model in small and medium-sized photovoltaic systems
223
In order to obtain the weight of the sub-criteria (wc) of the small and medium size of the PV
224
systems with DG, we carried out two questionnaire stages. Steps 2 and 3 of the ANP-TOPSIS are
225
applied. In this stage the consistency of each of the experts is analysed. The result of the weights
226
helps us evaluate the alternatives in the following steps (These results are presented in detail on S.I.
227
B).
228
To determine the alternatives, we have a size range from 5kWp to 5 MWp according to the
229
small and medium size that we have determined of the photovoltaic systems. The number of
230
systems in each alternative should add up to 1 GWp of installed capacity, and therefore the
231
different size alternatives are comprised by different number of independent systems: the smaller
232
the size of the system, the larger number that have to be installed in that category. The following
233
four groups have been weighted as alternatives:
234
235
Alternative 1 (AS1) - 200,000 photovoltaic systems with 5 kWp of power. These facilities would
236
be located in multi-family housing for self-consumption.
237
Alternative 2 (AS2) - 2,000 photovoltaic systems with 500 kWp of power. These facilities would
238
be located in the roofs and parking areas of medium-sized companies.
239
Alternative 3 (AS3) - 1,000 photovoltaic systems of 1 MWp of power. Installations located on
240
decks and car parks of large companies with an area larger than 5,000 square meters
241
Alternative 4 (AS4) - 200 photovoltaic systems with 5 MWp of power. Installations located in
242
industrial areas that contain the necessary surface according to established regulations.
243
The alternatives can be considered as independent systems (all the same size within the
244
alternative) or as groups of systems which add up to the maximum size considered in this
245
alternative, therefore providing a partial mixed solution within each alternative. For example, in
246
the maximum of 500kWp which is the minimum for the following alternative). The results of the
248
decision matrix step 4 of Section 2.2 can be seen in S.I. B. The data of the quantitative sub-criteria
249
economic costs (EC) and generated employment (GE) were weighted based on a study published
250
by the International Renewable Energy Agency [42]. The other sub-criteria are qualitative and their
251
value was established from the answers given by the experts in the last stage of questionnaires.
252
Applying the remaining steps of ANP-TOPSIS, we obtain the distance of each of the alternatives to
253
the ideal solution, which permits their classification in preference order, as shown in Figure 4 and
254
Table 3.
255
256
257
Figure 4. Relative proximity of each of the alternatives composing the size choices in small and
258
medium distributed photovoltaic systems.
259
3.3 Comparative analysis
260
The comparison of the results obtained from the alternatives is shown in Table 4, where the
261
ranking of sizes for each of the experts and the trend that finally prevails is presented.
262
Expert 1 Expert 2 Expert 3 Expert 4 Expert 5
Rankin g
AS1>AS2>AS3>A S4
AS3>AS4>AS1>A S2
AS1>AS2>AS3> A4
AS2>AS1>AS3>A S4
AS4>AS3>AS2>A S1
Table 3. Ranking of alternatives case small and medium-scale as classified by the relative distance calculated
263
from the analysis of each expert.
264
The most repeated trend is A1 > A2 > A3>A4 (the same result is found in the large installations
265
case, see Supplementary Information), while no other trend is repeated. The deviations produced
266
from this trend can be analysed in terms of sensitivity to human errors, as we will explore in the
267
next section. The predominant alternative is therefore 200,000 small installations of 5kWp for the
268
small and medium size group, selecting thus the smaller size within the available range. These
269
results suggest that for a given output power, smaller size modules optimise distributed generation
270
photovoltaic systems and the result is again that the systems with smaller size in this category are
272
the optimum solution. Details of the parameters’ and results are presented in the Supplementary
273
Information for the evaluation of large size systems. To confirm this trend and the robustness of the
274
results, we carried out a sensitivity analysis that is shown and discussed in what follows.
275
276
3.4. Sensitivity analysis of the results
277
The results obtained from the ANP-TOPSIS direct analysis show that results are pretty much
278
consistent for all experts. In this section, we will analyse the robustness of these results against
279
changes and errors both in the evaluation of alternatives and the relative weights assigned to each
280
of the sub-criteria by each of the experts. To do so, we introduce percentage
281
variations on the values provided by the experts in each of the 14 sub-criteria composing the four
282
different alternatives proposed, for both the small-medium and the large solar plant cases (the latter
283
shown in the S.I.). We thus simulate errors that the experts might have committed in assessing the
284
value assigned to each of the sub-criteria in each of the alternatives. In that way, we confirm the
285
strength of the decision and the method used to reach it, and also identify the weak points and the
286
most sensitive sub-criteria whose value might have to be double checked.
287
Given the structure of the ANP-TOPSIS decision method, percentage variation analysis is the
288
same for both the final relative weights assigned to each of the sub-criteria and to the values
289
provided for each alternative. In the ANP-TOPSIS method, the normalized final weights obtained
290
after correlating the criteria and sub-criteria, are each multiplied by the corresponding normalized
291
value of each sub-criteria in each alternative. This particularly means that any variation produced
292
in either of weights (alternatives) will spread and diffuse to all the weights when normalization
293
procedure is applied. Moreover, correlating the alternatives with the weights means that it does not
294
matter where the error is produced, and the results shown in Figure 5 are valid and equivalent for
295
both variations introduced in the weights and the alternatives.
296
297
298
299
300
301
302
303
304
305
306
307
308
309
310
311
312
313
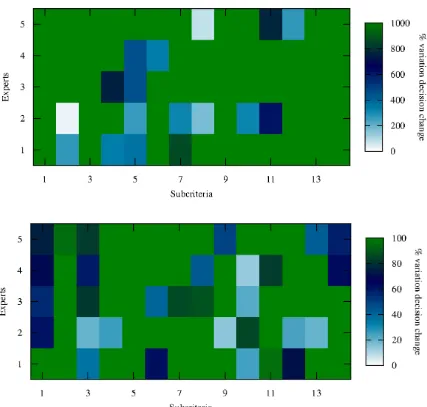
314
Figure 5. (a) Percentage variation of the individual sub-criteria weights at which the ideal
316
solution changes for the case of small and medium scale distributed photovoltaic systems.
317
(b) Average of 1000 realizations of percentage variation of the inividual sub-criteria
318
together with random errors in all the other sub-criteria of size equal or less than the
319
percentage variation in the considered sub-criteria. Each point shows the percentage at
320
which he ideal solution changes for the case of small and medium scale distributed
321
photovoltaic systems.
322
323
Figure 5a shows the percentage variation of either weight or alternative at which the original
324
ideal solution changes. Results are shown for variations in each of the sub-criteria and for each of
325
the experts. We have extended the variations up to 1000% error in order to show on the one hand,
326
real changes, and on the other, the extreme robustness of the ANP-TOPSIS method, as it is very
327
unlikely that an error of 1000% is produced. In particular, the smallest error for which a change in
328
the ideal alternative appears is 33% for expert 1. Furthermore, only three of the variations produce a
329
change within the 100% error, displaying the robustness of the method. Moreover, such changes
330
appear in experts for which the solution differed from the common A1 > A2 > A3 > A4 solution, and
331
the tendency is for the changes induced by errors to drift towards the A1 > A2 > A3 > A4 solution.
332
With this analysis we gain insight on the influence that each of the weights has on the final solution.
333
In Figure 5b we have again performed a sensitivity analysis by varying each of the weights
335
adding an error, in this case up to 100%. The difference is that here all the other weights (or
336
alternatives) are allowed to have an error equal or smaller than the one that is being analysed. To
337
do so, 1000 realizations of random errors for each of the percentages are calculated and averaged to
338
obtain how the ideal solution changes with error. The percentage at which the ideal solution
339
changes is represented in the heatmap on Fig. 5b. We see that for most subcriteria, an error higher
340
than 100% in all of the subcriteria is necessary in order to see a change in the ideal solution.
341
Moreover, in any case such an error has to be higher than 15%. This again demonstrates the
342
robustness of the method we have employed and the fiability of the results obtained. This analysis
343
shows as well the degree of interrelation existing among subcriteria, demonstrating that except for
344
subcriteria three, were the sensitivity to errors in the other subcriteria produces a change in the
345
ideal solution for all experts, the choice of interrelations by the experts that leads to the relative
346
weights is well justified, as the interrelations are already taken into account and they do not exert
347
more influence. In that sense, the sensituvity analysis demonstrates that the results obtained from
348
the experst analysis is robust.
349
The robustness of the ANP-TOPSIS mehtod comes mainly from the fact that any error that is
350
produced on sub-criteria gets normalized and thus spreads on all the sub-criteria, causing just a
351
shift without order change in the results when the whole ANP-TOPSIS is implemented. In fact, if
352
error is introduced in more than one of the alternatives (weights), the results show that the
353
percentage variation needed to see a change in the ideal solution increases for most of the
sub-354
criteria. Correlations between sub-criteria seem to be small and are only important whenever it
355
coincides that both weights are similar, and both correspond to either a maximum or minimum in
356
the distance to the ideal solution. In general, this means that the possible correlations tend just to
357
reinforce the final solution instead of changing it, again due to the normalization procedure
358
introduced.
359
In conclusion, the robustness analysis shows that solutions are resilient to errors both in the
360
valuation of alternatives and in the comparison of the relative importance of the different
sub-361
criteria, and demonstrates the capabilities and power of the ANP-TOPSIS method.
362
4. Discussion
363
Distributed generation photovoltaic plants can be defined through the installed capacity.
364
Provided a desired capacity, the PV plant can be constructed out of modules whose size range from
365
small, domestic installations, to huge solar parks. Moreover, any installed single system can always
366
be scaled up, thus benefiting from previous investments in the same location due to the flexibility of
367
the technology. Therefore, the size of the system is, unlike other energy technologies, a free
368
parameter that stakeholders (including end-users, investors, and policy makers) have to decide by
369
themselves with few technical limitations and scant constraints. In this article, we have presented a
370
possible classification of the different PV module sizes according to power capacity and target
371
installation location. From few kW to MW and from private, mostly house installations to industrial
372
size, large solar plants.
373
Determining the optimal module size for a given power capacity is a highly non-trivial
374
problem, where several technical, socio-economic, and environmental parameters can be assigned
375
to each size. In this article, a methodology to obtain the optimum decision about the size of the
376
system in terms of best socio-economic impacts is proposed and tested. For that purpose, a panel of
377
experts have been interviewed in order to assign the qualitative socio-economic and environmental
378
parameters to different PV systems according to its size, for example, the amount of new jobs
379
created or the physical impact on the ground. Once the deciding criteria are selected, and weights
380
correspondingly assigned, we have, in what to our knowledge is a first in photovoltaic
381
technologies, applied a combination of ANP and TOPSIS multi-criteria decision methods to
382
evaluate the different PV systems and obtain the best fitting solution within each size group. This is
383
achieved by combining the relative weights of each of the different criteria and sub-criteria, with
384
the sub-criteria. In addition, we have implemented a sensitivity and robustness analysis of the
386
method by performing a cross-correlation and error study which indicates that the proposed
387
solution is robust, that there is no superfluous correlation between parameters, and that the
388
methodology itself is built so that possible errors tend to smooth out and become relatively
389
irrelevant.
390
The results obtained show clearly that within each size category (i.e. small and medium vs.
391
large systems), the best solution to optimize both the socio-economic and the environmental
392
impacts is the smallest one. This is an important conclusion: the best use of investment regarding
393
the socio-economic impacts of the future PV facilities is to design and build smaller and more
394
distributed PV systems instead of very large plants, which seems to be the actual tendency.
395
Moreover, the decision making support methodology, a combination of ANP and TOPSIS used for
396
this study which has provided a clear and robust result, can be extended to other PV studies
397
(advantages of different technologies instead of different sizes for example) .
398
In conclusion, initial investment in small systems is recommended. Furthermore, future
399
investment could also be used to expand those already existing installed systems in an optimal way
400
by using the previous photovoltaic plant. Ours is thus a conscientious effort towards
401
demonstrating, with robust tools and strong arguments, that the policy of “the larger the better” is
402
not necessarily the best, neither for stakeholders nor for the environment, and that the community
403
in general can greatly benefit from using sophisticated decision methods, and smaller photovoltaic
404
installations.
405
In the aforementioned direction, future work should address the question of the number of
406
experts. It is clear that given the size of the sample, and the technicality of the topic, finding suitable
407
experts is a hard task. However, the sensitivity analysis provides the clue to resolve the issue. It is
408
clear that both the correlation and the relative influence among sub-criteria varies greatly, having
409
almost totally inconsequential sub-criteria, which could be ascertained from the responses of just a
410
handful of experts, thus simplifying the questionnaires for increasing experts samples. Moreover,
411
once a few different experts are known, simulations of experts via learning algorithms can provide
412
with the necessary variations that provide robustness to the results by identifying the stronger
413
trends. Another line of future research is to apply this methodology to specific regions, identifying
414
and solving the particular needs of geographically localized places, which will require from local
415
experts and specific sub-criteria.
416
417
Supplementary Materials: The following are available online at www.mdpi.com/xxx/s1, Figure S1: title, Table
418
S1: title, Video S1: title.
419
Author Contributions: † This authors contributed equally. All authors contributed to the research and
420
participated in the discussions and writing of this manuscript.
421
Funding: This research was done thanks to the financial support from MINECO (SPAIN), including FEDER
422
funds: FIS2015-69512-R and ENE2016-79282-C5-5-R, and from Fundación Séneca (Murcia, Spain) Project No.
423
19882/GERM/15 and projects TIN2014-55024-P from MINECO (SPAIN) P11-TIC-8001 and TIN2017-86647-P
424
from Junta de Andalucía (including FEDER funds) and project FIS2015-69512-R from MINECO (SPAIN) and a
425
doctoral scholarship from MESCYT (Dominican Republic) with the contract No. BIM- 434-2017, respectively.
426
Conflicts of Interest: “The authors declare no conflict of interest.” “The funders had no role in the design of
427
the study; in the collection, analyses, or interpretation of data; in the writing of the manuscript, or in the
428
decision to publish the results”.
429
430
References
431
1. Ackermann, T., Andersson, G., Söder, L. Distributed generation: a definition. Electric Power Systems
432
2. Prakash, P., Khatod, D.K., Optimal sizing and sitting techniques for distributed generation in distribution
434
systems: A review. Renewable and Sustainable Energy Reviews 2016, 57, 111–130,
435
10.1016/j.rser.2015.12.099.
436
3. Rezaee, J.A., Allocation of distributed generation units in electric power systems: A review. Renewable
437
and Sustainable Energy Reviews 2016, 56, 893-905, 10.1016/j.rser.2015.11.086.
438
4. Bagheri, A., Monsef, H., Lesani, H., Integrated distribution network expansion planning incorporating
439
distributed generation considering uncertainties, reliability, and operational conditions. International
440
Journal of Electrical Power & Energy Systems 2015, 73, 56–70, 10.1016/j.ijepes.2015.03.010.
441
5. Lizi Luo, Wei Gu Xiaoing, Zhang Ge Cao,Weijun Wang, Gang Zhu, Dingjun You., Optimal siting and
442
sizing of distributed generation in distribution systems with PV solar farm utilized as STATCOM
(PV-443
STATCOM). Applied Energy 2018, 210, pp 1092-1100, 10.1016/j.apenergy.2017.08.165.
444
6. Zeraati, Mehdi, Mohamad Esmail Hamedani Golshan, and Josep M. Guerrero., Distributed control of
445
battery energy storage systems for voltage regulation in distribution networks with high PV penetration.
446
IEEE Transactions on Smart Grid 2018, 9.4: 3582-3593, 10.1109/TSG.2016.2636217.
447
7. Ali, E.S., Elazim, S.M., Abdelaziz, A.Y., Ant Lion Optimization Algorithm for optimal location and
448
sizing of renewable distributed generations. Renewable Energy 2017, 101, 1311-1324,
449
10.1016/j.renene.2016.09.023.
450
8. Ruiz-Romero, S., Colmenar-Santos, A., Gil-Ortego, R., Molina-Bonilla, A., Distributed generation: The
451
definitive boost for renewable energy in Spain. Renewable Energy 2013, 53, 354-364,
452
10.1016/j.renene.2012.12.010.
453
9. Lincy, G., M. Ponnavaikko, and Lenin Anselm., Economic of Distributed Photovoltaic Generation
454
Installed in a Typical Distribution System. International Journal of Applied Engineering Research
455
2013, 13.7: 4796-4801.
456
10. McKenna, Eoghan, Jacquelyn Pless, and Sarah J. Darby., Solar photovoltaic self-consumption in the UK
457
residential sector: New estimates from a smart grid demonstration project. Energy Policy 2018, 118:
482-458
491, 10.1016/j.enpol.2018.04.006.
459
11. Renewable Energy Policy Network for the 21st Century. Renewables 2017 Global Status Report. c/o
460
UNEP 1 Rue Miollis Building VII 75015 Paris France. ISBN 978-3-9818107-6-9. http://www.ren21.net/.
461
12. Kaldellis, J.K., Zafirakis, D., Kondili, E., Optimum sizing of photovoltaic-energy storage systems for
462
autonomous small islands. International Journal of Electrical Power & Energy Systems 2010, 32(1), 24-36,
463
10.1016/j.ijepes.2009.06.013.
464
13. Phillips, J., Determining the sustainability of large-scale photovoltaic solar power plants. Renewable and
465
Sustainable Energy Reviews 2013, 27, 435-444, 10.1016/j.rser.2013.07.003.
466
14. Markvart, T., Sizing of hybrid photovoltaic-wind energy systems. Solar Energy 1996, 57(4), 277-281,
467
10.1016/S0038-092X(96)00106-5.
468
15. Prados, M.J., Renewable energy policy and landscape management in Andalusia, Spain: The facts. Energy
469
Policy 2010, 38(11), 6900–6909, 10.1016/j.enpol.2010.07.005.
470
16. Duailibe Ribeiro, A.E., Cardoso Arouca, M., Moreira Coelho, D., Electric energy generation from
small-471
scale solar and wind power in Brazil: The influence of location, area and shape. Renewable Energy 2016,
472
85, 554–563, 10.1016/j.renene.2015.06.071.
473
17. Lv, T., Ai, Q., Interactive energy management of networked microgrids-based active distribution system
474
considering large-scale integration of renewable energy resources. Applied Energy 2016, 63, 408–422,
475
10.1016/j.apenergy.2015.10.179.
476
18. Viral, R., Khatod, D.K., Optimal planning of distributed generation systems in distribution system: A
477
review. Renewable and Sustainable Energy Reviews 2012, 16(7), 5146-5165, 10.1016/j.rser.2012.05.020.
478
19. Liu K, Sheng W, Liu Y, Meng X, Liu Y. Optimal sitting and sizing of DGs in distribution system
479
considering time sequence characteristics of loads and DGs. International Journal of Electrical Power &
480
Energy Systems 2015, 69: 430–440, 10.1016/j.ijepes.2015.01.033.
481
20. Abdmouleh, Z., Gastli, A., Ben-Brahim, L., Haouari, M., Ahmed Al-Emadi, N., Review of optimization
482
techniques applied for the integration of distributed generation from renewable energy sources.
483
Renewable Energy 2017, 113, 266-280, 10.1016/j.renene.2017.05.087.
484
21. Saaty T.L. Fundamentals of the Analytic Hierarchy Process. In The Analytic Hierarchy Process in Natural
485
Kangas J., Mendoza G.A., Pesonen M. Springer, Dordrecht, Netherlands, 2001. Volume 3, pp 15-35,
978-487
90-481-5735-8.
488
22. Hwang, C. L., Yoon, K.. Multiple Attribute Decision Methods and Applications. Springer, Berlin
489
Heidelberg, Germany, 1981, 978-3-540-10558-9
490
23. Lee Amy, H.I., Hung, M.C., Kang, H.Y., Pearn, W.L., A wind turbine evaluation model under a
multi-491
criteria decision making environment. Energy Conversion and Management 2012, 64, 289-300,
492
10.1016/j.enconman.2012.03.029.
493
24. Cheng-Shiung, W., Chin-Tsai, L., Chuan, L., Optimal marketing strategy: A decision-making with ANP
494
and TOPSIS. International Journal of Production Economics 2010, 127(1), 190–196,
495
10.1016/j.ijpe.2010.05.013.
496
25. Singh, R.K., Benyouce, L., A fuzzy TOPSIS based approach for e-sourcing. Engineering Applications of
497
Artificial Intelligence 2011, 24(3), 437–448, 10.1016/j.engappai.2010.09.006.
498
26. Sánchez-Lozano, J.M., Teruel-Solano, J., Soto-Elvira, P.L., García-Cascales, M.S., Geographical
499
Information Systems (GIS) and Multi-Criteria Decision Making (MCDM) methods for the evaluation of
500
solar farms locations: Case study in south-eastern Spain. Renewable and Sustainable Energy Reviews
501
2013, 24, 544–556, 10.1016/j.rser.2013.03.019.
502
27. Aragonés-Beltrán, P., Chaparro-González, F., Pastor-Ferrando, J.P., An AHP (Analytic Hierarchy
503
Process)/ANP (Analytic Network Process)-based multi-criteria decision approach for the selection of
504
solar-thermal power plant investment projects. Energy 2014, 66, 222–238, 10.1016/j.energy.2013.12.016.
505
28. Yunn W., Geng S., Multi-criteria decision making on selection of solar–wind hybrid power station
506
location: A case of China. Energy Conversion and Management 2014, 81, 527–533,
507
10.1016/j.enconman.2014.02.056.
508
29. Yahyaoui, I., Atieh, A., Tadeo, F., Tina, G.M., Energetic and economic sensitivity analysis for photovoltaic
509
water pumping systems. Solar Energy 2017, 144, 376-391, 10.1016/j.solener.2017.01.040.
510
30. Kabalci, Y., Kabalci, E., Modeling and analysis of a smart grid monitoring system for renewable energy
511
sources. Solar Energy 2017, 153, 262-275, 10.1016/j.solener.2017.05.063.
512
31. Muhsen, D.H., Khatib, T., Abdulabbas, T.E., Sizing of a standalone photovoltaic water pumping system
513
using hybrid multi-criteria decision making methods. Solar Energy 2018, 159, 1003-1015,
514
10.1016/j.solener.2017.11.044.
515
32. Guerrero-Liquet, G.C., Sánchez-Lozano, J.M., García-Cascales, M.S., Lamata, M.T., Verdegay, J.L.
516
Decision-Making for Risk Management in Sustainable Renewable Energy Facilities: A Case Study in the
517
Dominican Republic. Sustainability, 2016, 8(5) 455, 10.3390/su8050455
518
33. Saaty, T.L. Decision Making with Dependence and Feedback: The Analytic Network Process : the
519
Organization and Prioritization of Complexity. RWS Publications, 2001, 0962031798
520
34. Shyur, H.J., COTS evaluation using modified TOPSIS and ANP. Applied Mathematics and Computation
521
2006, 177(1), 251–259, 10.1016/j.amc.2005.11.006.
522
35. Chang, K.L., Liao, S.K., Tseng, T.W., Liao, C.Y., An ANP based TOPSIS approach for Taiwanese service
523
apartment location selection. Asia Pacific Management Review 2015, 20(2), 49-55,
524
10.1016/j.apmrv.2014.12.007.
525
36. Ayağ, Z., Özdemir, R.G., Evaluating machine tool alternatives through modified TOPSIS and alpha-cut
526
based fuzzy ANP. International Journal of Production Economics 2012, 140(2), 630–636,
527
10.1016/j.ijpe.2012.02.009.
528
37. Shafiee, M., A fuzzy analytic network process model to mitigate the risks associated with offshore wind
529
farms. Expert Systems with Applications 2015, 42(4), 2143–2152, 10.1016/j.eswa.2014.10.019.
530
38. Sánchez-Lozano, J.M., García-Cascales, M.S., Lamata, M.T., Evaluation of suitable locations for the
531
installation of solar thermoelectric power plants. Computers & Industrial Engineering 2015, 87, 343-355,
532
10.1016/j.cie.2015.05.028.
533
39. Corona, B., de la Rúa, C., San Miguel, G., Socio-economic and environmental effects of concentrated solar
534
power in Spain: A multiregional input output analysis. Solar Energy Materials and Solar Cells 2016, 156,
535
112-121, 10.1016/j.solmat.2016.03.014.
536
40. Hangera, S., Komendantova, N., Schinke, B., Zejli, D., Ihlal, A., Patt, A., Community acceptance of
large-537
scale solar energy installations in developing countries: Evidence from Morocco. Energy Research &
538
41. Sheikh, N.J., Kocaoglu, D.F., Lutzenhiser, L., Social and political impacts of renewable energy: Literature
540
review. Technological Forecasting and Social Change 108, 2016, 102–110, 10.1016/j.techfore.2016.04.022.
541
42. Yang, H., Zhou, W., Lu, Lin., Zhaohong, F., Optimal sizing method for stand-alone hybrid solar-wind
542
system with LPSP technology by using genetic algorithm. Solar Energy 2008, 82(4), 354-367,
543
10.1016/j.solener.2007.08.005.
544
43. IRENA (2018), Renewable Power Generation Costs in 2017. International Renewable Energy Agency, Abu
545
Dhabi. ISBN 978-92-9260-040-2. http://www.irena.org.
546