C A S E S T U D Y
Open Access
An analysis of passengers
’
ride needs of
urban rail transit services: application of
quality function deployment
Catherine Y. P. Chan
1*, Kwai-Sang Chin
1, Candace Chan
1and Kwok L. Tsui
2* Correspondence:catherine@qfdhk. org
1SEEM Department, City University
of Hong Kong, Tat Chee Avenue, Kowloon, Hong Kong
Full list of author information is available at the end of the article
Abstract
This study aims to suggest using the interpretation type of deployment of quality function deployment (QFD) as a methodology to understand the passengers’needs when they situate in the train cars of urban rail, using the East Rail Line (ERL) in Hong Kong as a case study. The result shows that behaved environment and safe stand are the two most important ride needs demanded by the everyday ordinary passengers of the rail line. In addition to this, the members of the study team reflected that the deployment process has greatly helped them on acquiring a thorough understanding of the passengers’needs, which is very essential for deriving innovative solutions. Besides the rail company could make use of the case study for improving its train ride quality, the suggested methodology is applicable to understand the passengers’ride needs of other kinds of public transport as well as the recipient needs of those public services that are of similar nature.
Keywords:Quality function deployment, Voice of the customer, Passengers’needs, Train ride, Urban rail transit services
Introduction
Train ride quality of urban rail transit services has received increasing attention from passengers [1,2]. Over the years, rail companies have put considerable efforts on pro-viding safe and comfortable train ride. On the one hand, they have implemented safety measures and set out regulations to prevent accidents from happening as well as drawn up guidelines and established procedures for handling accidents once happened. On the other hand, they have markedly improved the physical conditions of the internal environment of the train cars, such as temperature, humidity, air conditioning, and ventilation, and reduced the disturbance arisen from vibration and noise during the train in motion [3]. However, the advancement of the society has expanded the scope of train ride quality beyond public safety and physical body comfort. Passengers have shown a growing concern about the situations and their surroundings when they ride on the train. The concern is not only the invisible and intangible surroundings, such as those relating to public hygiene and human health, but also the visible and tangible surroundings that might potentially hurt them or affect their feeling of comfortability. To provide transit services of good quality in modern cities, rail companies have to find ways to address the current kinds of needs demanded by the passengers.
For a convenient and efficient ride at an inexpensive price, most people could accept a quite high degree of crowdedness of mass transit rail. The findings of a survey about the urban public transport of Bucharest in Romania show that almost 60% of the re-spondents admitted the subway was crowded but they could accept [4]. However, the point is many urban rail lines are no more simply crowded. In the last two decades, the huge explosion of population and massive influx of visitors have tremendously in-creased the use of mass rail transit in many cities. Although rail companies have kept on monitoring the extent of crowdedness [5] and ways for dealing with overcrowding [6] and avoiding accidents from happening because of congestion [7] have been sug-gested, the problem of customer dissatisfaction remains. One of the reasons is that the changed nature of crowdedness has not yet been fully addressed. The current crowded-ness is not simply a rising number of people but also suitcases and packages, and the rising number of people is not only the local and ordinary riders but also the visitors, babies, children, elderly, physically disabled, and many other kinds of passengers as well. The quantity of objects and the variety of passenger groups have collectively made the inside environment of the train cars growingly chaotic. Pressure has built up for all passengers.
Literature shows that there are many studies on the topic of customer satisfaction of urban transit services. Some measured the performance, such as the studies on compar-ing the transport service attributes of public bus of two cities in Africa [8], analysing the performance of the railway transit services of Algiers [9], assessing the intra-urban bus services of Enugu [10], and conducting passenger surveys to evaluate the Lithu-anian railways [11]. Some identified the satisfaction gap. An example is the study on comparing bus rapid transit with the conventional bus and metro services in Guangzhou [12]. Some pointed out the important factors or the determinants, such as the study on identifying the key service factors offered by rail operators in Northern Italy [13] and the study on investigating the changes of attribute importance of traveller satisfaction of different segments over time and the inter-segment geographical vari-ation of overall satisfaction [14]. Still, there are some focused on developing models and devising formulas, such as the studies of [15–17]. The results and the outputs of these studies have greatly contributed to increasing the theoretical knowledge of the domain as well as offering service providers the directions to explore. However, with the growing awareness of the importance of customer satisfaction at point of service to overall customer satisfaction, urban transit service providers are in need of practical methods to solve situational problems for and add functional values to passengers at their servicing sites. This aspect of research has recently started, such as the studies on investigating the sitting in the seats and the in-cabin activities for finding out the needs of the passengers of high-speed rail in China [18, 19]. However, it is only at the initial stage; methods and case studies in literature are very limited.
perspective of customers, before applying professional knowledge to formulate solu-tions. Over the years, organizations of different industries have put QFD into their business and management for a variety of purposes. Among the applications, the use of the interpretation type of deployment to understand the customers’needs is one of the major kinds. In addition to the quantitative results, an important benefit organizations would obtain from exercising QFD is innovation. The interpretation the team members made in the deployment process would engage them in understanding what customers truly require and exploring what customers potentially require. The understanding would greatly help the team on coming up with new ideas for deriving solutions [20].
The aim of this paper is to suggest using the interpretation type of deployment of QFD as a methodology to understand the needs of the passengers when they situate in the train cars of urban rail, using the East Rail Line (ERL) in Hong Kong as a case study. Collectively speaking, the contributions of this paper to literature are fourfold. First, studying the passengers’ situational problems and needs at servicing sites offers providers of urban rail transit services a new perspective for improving customer satis-faction. Second, the methodology formulated in accordance with the general operation of the interpretation type of deployment of QFD provides an effective approach for un-derstanding passengers’ needs. Third, the ERL case study gives details on how the process of understanding operates, which is fundamental and important to deriving in-novative solutions. Last but not least, the suggested methodology together with the re-sult obtained from the ERL case study would be a useful piece of reference for raising the ride quality of urban rail.
This paper consists of six sections. The “Introduction”section introduces the ration-ale and gives the aim of the paper. The “Literature review of quality function
deploy-ment” section is a literature review of QFD, making a focus on its basic principles, industrial applications, and how it deals with the fuzzy front end, with the purpose of building a theoretical and practical foundation for the suggested methodology. The
“Suggested methodology” section presents the framework of the suggested method-ology, and the “Case study” section shares an application of the methodology, that is, the case study of the ERL. The“Discussion”section discusses the follow-up for the case study and further studies for improving train ride quality. The“Conclusions”section is the conclusions. In this last section, the key points, applications of the methodology, and contributions of the study are summarized.
Literature review of quality function deployment
idea of QFD for assuring product quality [24]. As the deployment technique for assur-ing product quality is equally applicable to managassur-ing business process, QFD uses the same approach to facilitate the operation of hoshin kanri, a participative kind of man-agement method developed in Japan in the early 1970s [25]. Organizations could use QFD as a methodology for setting policy at the management level and deploying the policy to the operation level for execution. QFD serves as a vehicle for TQM imple-mentation by means of providing a quality-driven approach for making business plan-ning as well as a customer-oriented approach for doing product and service development, with both of them effectively involve the participation of organization members.
Two kinds of deployment
There are two kinds of deployment in QFD: (1) interpretation and (2) conversion. As early as in the early to mid-1960s, Japanese manufacturers had already made use of quality charts, which were first used in Kobe Shipyard, to help convert the qualities demanded by buyers into corresponding parameters to assure the make and the pro-duction quality of their products [26]. Some early QFD cases of the automotive indus-try revealed the use of quality charts to conduct the conversion kind of deployment for managing quality. For example, Toyoda Gosei applied QFD charts in formulating the assurance network for managing the quality of rubber and plastic parts [27] and Hino Motors used the charts to link design quality to production methods and final assembly for cost control [28]. The conversion kind of deployment greatly helps translate items of one aspect, for instance, the given requirements, into items of another aspect, such as the features, the parts, and the processes, which would collectively contribute to meeting the given requirements. However, it does not help find out the items at the origin, that is, the needs of the customers with the product. The formulation of the in-terpretation kind of deployment has overcome this limitation. This added deployment is a process starting from collecting the voice of the customer (VOC) from various sources, extracting need items from the collected VOC, organizing the need items into needs, and finally identifying the important needs—the control points for assuring the design quality. Upon completing the interpretation kind of deployment, the team could use the conversion kind of deployment to continue to assure the make and the produc-tion quality. The two kinds of deployment of QFD enable manufacturers to identify control points at every stage of manufacture to implement quality assurance.
Industrial applications
QFD has been widely applied in two major areas of business management: (1) hoshin
needs. For example, a laboratory of NASA used QFD to gather the requirements and analyse the diverse needs of the internal customers to design a subsystem programme [31]. Some used QFD to identify quality characteristics, or design parameters, and/or to define technical requirements, such as the case shared by a hotel in Ibadan used QFD and Pareto analysis to identify the“vital few”items to optimize resources for improving its services [32]. Some focused on defining the product and service features with QFD, such as the studies of mountain bike [33] and pruning shears [34]. There are some studies, of course, aimed at using QFD to design actual products. An example is the study on designing a device for holding an endotracheal tube of the patient in a more secure manner during anaesthesia [35].
QFD is not new to the passenger transportation industry. Here are some applications. An airline used a modified QFD to understand the customers’ needs with respect to flight attendants, in-flight products, and cabin environment in the design of a new ser-vice for its intercontinental business class [36]. In a study rectifying the problems found in the launching phase of a smartcard for paying riding fare of public transportation, the team used QFD to translate the VOC into the technical specifications to improve the electronic system [37]. In Sapporo, there is a case on using the house of quality to make suggestion for improving the road maintenance service in winter. The team first conducted an evaluation by identifying the road users’ dissatisfaction items and then deployed the dissatisfaction items into the technical aspects of the service to formulate advice [38]. Recently, the passenger transportation industry has applied QFD to hand-ling the voice of multiple customers. For example, in a study on suggesting an airport in Japan on how to ensure the generality and sustainability of quality implementation, the team formulated a multilayered QFD model to deal with the conflicting require-ments of the airline companies and the passengers [39]. A study conducted for highway bus services took similar approach. The team used fuzzy QFD to integrate the views of the service provider and the customers to devise quality improvement strategies [40]. Although the areas of application of the studies were diversified, they carried the same aim of improving quality and they all started with customers.
Dealing with the fuzzy front end
Gemba visiting is a method commonly used to collect VOC in QFD. “Gemba” is a Japanese word meaning “real place”, a place where real actions are to be taken. Imai contended thatgemba is the site of all improvements and the source of all information for adding customer-satisfying value [46]. Since many customers’needs are often un-voiced,“going to the gemba”therefore could help a supplier understand how and under what circumstances its product or service was being used [47]. In general,gembavisits provide two major kinds of information for improving product and service design. First,
gemba analysis could help identify the potential failure modes and root causes in de-signing products and services, which often missed in conventional problem analysis [48]. Second,gemba visits could assist suppliers on discovering customers’ latent and unspoken demands so that the product or service to be developed could surpass their basic requirements [49, 50]. Many applications have reported using gembavisiting to collect information about the customers’ needs. A cement manufacturer in New Mexico improved their technical support services by paying visits to their key cus-tomers to document their cement use and concrete production processes [51]. A home utensil company adopted the gembatechnique and used it to encounter consumers in different situations to help the development of more innovative concepts [52]. In the project on designing a dinosaur robot for a theme park, the engineers visited a petting zoo to observe how children interact with live animals [53]. A phone manufacturer conductedgembavisits in the metropolitan areas of Tokyo to capture the basic and la-tent needs of cellular phone users [54]. To improve customer satisfaction with bagel sales in the airports of the USA, the team discovered from gembavisits that customers wanted toasted bagels but had never offered before [55]. For the project on understand-ing how consumers identify with the brand of a beer, the team members went to super-markets to observe how people buy beer and went to pubs to see how people drink beer [56,57].
Interacting with customers is another method frequently used to collect VOC in QFD, which is usually conducted in the form of focus group or individual meeting. The common approach of this method is to ask customers to give comments for the exist-ing product or the service and/or their expectations with the product or the service. An example is an improvement project of a distributor of convenience food to retail out-lets. The team invited the key players and customers to come to a meeting to discuss and to identify the main problems within the existing supply process [58]. Another ex-ample is a project on making a service plan of a regional acute-care hospital in Singapore. The team asked the patients to give their expectations with health providers [59]. Although in most cases the responses are audio-recorded, some teams would like to interact with customers in a more natural way. They simply dialogue with customers and listen to their stories. In a project on boosting morale, the team invited the em-ployees to come to a lunch meeting to let them voice out their difficulties and feelings [60]. Another example is a project on using QFD in designing maternity party dresses. In an afternoon tea meeting, pregnant women and mothers-to-be shared their stories on attending banquets with their“big bellies”[61].
The processing of the collected VOC starts from extraction, that is, to bring out the embedded meanings from the voice and to turn the embedded meanings into items informing the needs. For example, in a surgery satisfaction survey, the requirements of
unnoticeable scar”and “want to wear bikini”, respectively [62]. Similarly, in the develop-ment of a finger vein authentication device, the requiredevelop-ments of“pleasant to touch”and
“appropriate size for a hand”were extracted from the voice of“pleasant to use”[63]. Inter-pretation usually operates with a two-time extraction. Besides, it is easier to decompose a statement and reword a phrase; the in-between pause helps enrich the contents of the de-ployment. Interpretation not only to be made to verbal expressions, but also to images, such as photos and videos, as well. Referring back to the maternity party dress project, the team searched photos from the web and extracted possible embarrassing situations preg-nant women would like to avoid at party time [64]. Similarly, in the project on finding out the passengers’needs of the seat of high-speed rail in China, the team members extracted need items from the photos they took on the train [18].
The next step is to group the need items into needs. Affinity diagramming, a bottom-up clustering technique, is often used for this process. Affinity diagram has its origin in the KJ Method® developed by Jiro Kawakita, a Japanese anthropologist, for establishing an orderly system from chaotic information. This technique provides an approach for grouping items that are naturally related and helps identify one concept generic enough to tie the group [65]. It is highly effective for bringing the picture of a matter clearly into view and is a creative process that could break through preconceived notions about the situation. An example of using affinity diagramming in QFD application is the development of an online travel agency website. The team used this technique to put the needs collected from interviewing the participants of web design courses into customer requirements [66].
The identification of important needs is to put the needs into a survey for customers to indicate how important the needs to them. Traditionally, the indication is by rating or by ranking. However, the ordinal numbers collected in such ways could hardly pro-duce valid mathematical meanings. Among the methods suggested for solving this problem, analytic hierarchy process (AHP), a decision-making model formulated by Saaty [67, 68], is one that has been widely used in QFD. There are two reasons. First, AHP asks respondents to give judgement by making pairwise comparison so that the received responses on the importance of the given needs would be actual and more exact. Second, AHP uses ratio numbers to present priorities. As ratio numbers are mathematically operative, subsequent deployment of the priorities therefore is feasible as the priorities could be transferred from one matrix to another matrix with high ac-curacy [69–71]. An example of using AHP in QFD is a project of an insurance com-pany on finding out the priorities of need attributes of various customer segments and the management of [72].
Suggested methodology
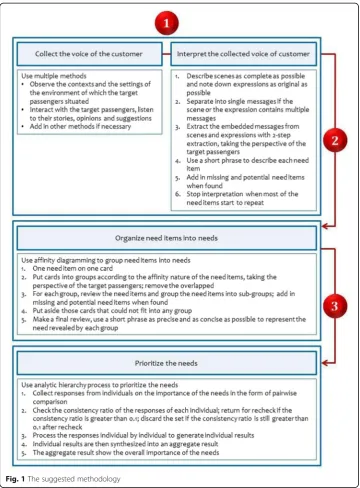
Formulated in accordance with the general operation of the interpretation type of deployment of QFD, Fig. 1 displays the framework of the suggested methodology for understanding the needs of the passengers when they situate in the train cars of urban rail.
Case study
Kong. The line starts in the city of Kowloon, flows through the greater part of New Territories, and terminates at two border-crossing points, Lo Wu and Lok Ma Chau. Figure 2 displays the route map of the ERL. Since the mid-2000s, the rapid develop-ment of residential and commercial complexes in the New Territories together with the massive influx of visitors from the Mainland has made the ERL very busy. From 2008 to 2017, only the cross-boundary service of the MTR had already increased 20%, from 1,205,448 thousands in 2008 to 1,637,898 thousands in 2017 [73], not to say the increase of the domestic service of the ERL in these 10 years. Besides being densely crowded with people, the huge quantity of carryings the passengers brought along with them has made the train cars increasingly disordered.
The objectives of the study are to understand the problems faced by and to find out the important needs demanded by the everyday ordinary passengers of the ERL when they ride on the train. Figure 3exhibits the key characteristics of the target passenger group. The study team consisted of four members, with three of them the authors of this paper.
Collect VOC and interpret the collected VOC
The team employed two methods to collect the VOC: (1) gembavisiting and (2) dia-loguing with customers. The first method is to collect non-verbal voice, something the passengers would only vaguely talk about or find difficult to describe. The second method is to collect passengers’ opinions, listen to their stories, and gather the voice that is missed out in gembavisits. Each of these two methods has its own advantages, and at the same time, they supplement the limitations of each other. The combined use of gembavisiting and dialoguing with customers has helped the team gather a rich set of data.
Gemba visiting
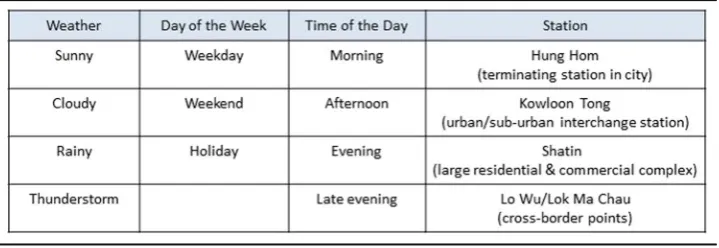
Before conductinggemba visits, the team members held meetings to discuss what they intended to observe. They used a table to plan the visits. On the table, they drew sev-eral columns and put contextual factors, such as weather, day of the week, time of the day, and station, as the headings. Under each heading, they put down the correspond-ing items, for example, cloudy and thunderstorm for weather, and Lo Wu and Lok Ma Chau for station. Thegembaplanning table helped the team members in three aspects. First, the display of items facilitated their discussion and selection of scenes for gemba. Second, they could easily use the table to review any scene they had missed and any scene they needed to revisit. Third, the table provided an overall picture of their action plan. The team members could easily adjust their visits, in particular when they added
new factors and/or new items. Table 1exhibits an excerpt of thegemba planning table of the study.
Two team members were responsible for this activity, with each conducted the assigned gemba visits according to his/her own schedule. In each ride, the team mem-ber walked through the train cars to observe the situations the target passengers were facing as well as the physical environment surrounding them, making a focus on the contexts and the settings. When the team member found something that would help understand the target passengers’problems and their needs, he/she would take a photo of it with his/her mobile phone. The purpose of photo taking is to mark down what was observed. It is not to capture passengers’act and conduct. If the train car at that time was very crowded or the circumstance was not appropriate for photo taking, the team member jot down notes after he/she had left the train. Team members held meet-ings to review the taken photos and to discuss further actions.Gembavisiting stopped when the team found most of the collected scenes start to repeat. In total, the team ob-tained more than 60 photos from 17gembavisits.
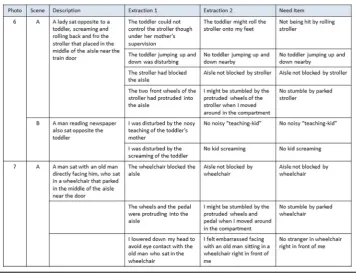
The team members made use of a VOC table to help them on interpreting the col-lected visual voice. First, they went through the photos one by one to extract scenes. When they have located a scene, they drew a circle round the scene and gave it a de-scription. Figure4shows how to make scene extraction. The team members did the in-terpretation together to extract the embedded meanings from each scene by referring to the description of the scene and taking the perspective of the everyday ordinary pas-sengers. As interpretation could hardly be comprehensive and to the point in one single step, the team members therefore used two-step extraction to assist them on digging out the meanings and turning them into need items. In the interpretation process, the team members reviewed what they had done from time to time and added in missing and potential items whenever they found. Table 2 is the interpretation made for the scenes exhibited in Fig.4. Interpretation stopped when many need items were repeat-ing. The team members derived 76 need items from the scenes extracted from 33 photos.
Dialoguing with customers
Upon completing processing the VOC collected from gembavisits, the team members started to interact with target passengers to make a further collection of VOC. Each time, one team member met one person and the format of the meeting was a dialogue.
Fig. 4Example of scene extraction
Instead of asking answers for certain pre-set questions, the team member invited the person to share his/her stories. The stories could be some good or some bad experience with rides on the ERL. Besides, the team member also asked the person if he/she found any problem with staying in the train cars and to give his/her opinions. During the dia-logue, if the team member found something not well explained, he/she would ask the person to give a fuller description of the situation or an illustration if required. To keep the atmosphere informal, the conversation was neither audio nor video recorded. The team member wrote down notes on what the person told him/her after the meeting.
Same as gemba visiting, the team held meetings to review the expressions they had collected and make plan for further actions. The activity of dialoguing stopped when the team found most of the collected expressions start to repeat. In total, the team had met three males and seven females, who were in the age of 21 to 40. All ten of them took the ERL to go to work or go to school at least eight times a week.
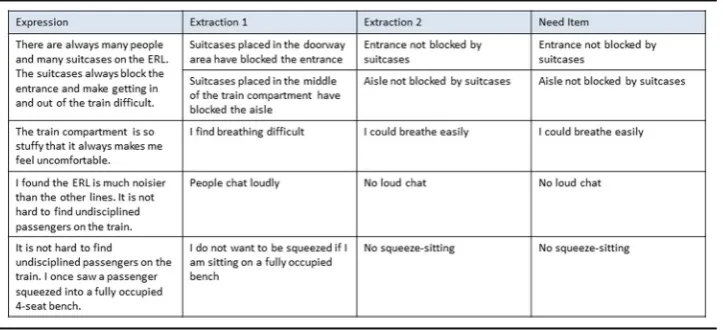
Similar to processing the non-verbal voice, the team members did the interpretation together and made use of a VOC table to help them interpret the collected verbal voice. They went through the collected expressions one by one. When they found compound expressions, they broke them down into individual expressions. From the perspective of the everyday ordinary passengers, they used two-step extraction to dig out the embed-ded meanings. Again, the team members adembed-ded in missing and potential items when found. Below is a piece of collected expression, and Table3 exhibits the interpretation made for the expression.
“Compared to other lines, there are always many people and many suitcases on the ERL. The suitcases always block the entrance and make getting in and out of the train difficult. The coach car is so stuffy that it always makes me feel uncomfortable. Besides, I found the ERL is much noisier than the other lines. It is not hard to find undisciplined passengers on the train. I once saw a passenger squeezed into a fully occupied 4-seat bench.”
Interpretation stopped when many need items were repeating. The team members derived 50 need items from the expressions they had collected.
Organize need items into needs
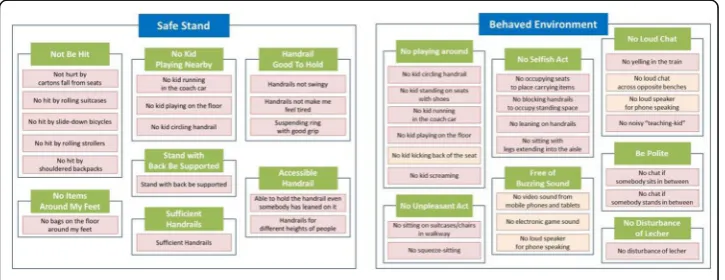
The team members used the method of affinity diagramming to organize the need items they obtained from the two VOC tables. They wrote each need item on a small card. After going through the cards one by one, the team members started grouping the need items. On a large table, they put those having an affinity relationship into a cluster. It is not to categorize but to group the need items from the perspective of the target passengers. On the one hand, they removed the overlapping items. On the other hand, they added in missing and potential items. For each cluster or each group, the team members grouped the need items into subgroups. They had tried several ways to group the need items and put aside those that could hardly fit into any group. After making a final review with the contents of each group, the team members put down a short phrase as precise and as concise as possible to represent the group. The short phrases they put down are the needs. Figure 5displays two of the six affinity diagrams prepared by the team.
The team obtained the following list consisting of six needs:
1. Behaved environment 2. Sit comfortably on the seat 3. Safe stand
4. Easy to get on and off 5. Pleasant feeling
6. Place for putting down my carrying items
Before proceeding further, a team member met a station officer of MTR, who has served the company for almost 20 years, to seek his opinions. In the meeting, the team member asked the officer if he found any need obviously missed from the list. The offi-cer fed back to the team that the six needs were sensible and representable.
Prioritize the needs
The next step of the study was to find out the importance of the six needs. According to the operation of AHP, this step is divided into two substeps: (1) collect responses in the form of pairwise comparison and (2) input the collected response into software to generate results.
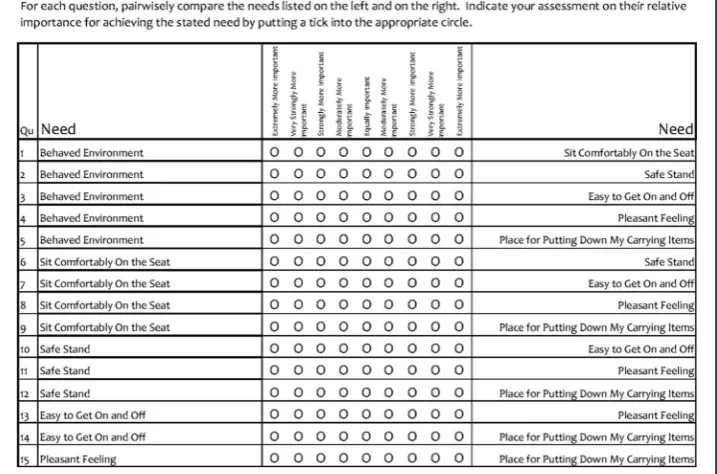
The team members conducted a survey to find out the degrees of importance of the six needs. They prepared a questionnaire displaying the 6 needs in 15 pairs (Fig.6). For each pair of needs, the respondent was asked to indicate which need of the two given needs was more important to him/her and how much was the importance. The ques-tionnaire enclosed a sheet of definitions explaining the six needs.
The team members invited 36 persons to do the questionnaire. Upon confirming the person was a target passenger of the study, the team member explained to him/her the purpose of the survey, the definitions of the needs, and how to do pairwise comparison. The respondent did the questionnaire in the meeting with the team member and returned the completed questionnaire to the team member together with his/her con-tact details.
The team members used the software of ExpertChoice® to process the collected re-sponses. For each completed questionnaire, the consistency ratio of the responses would reflect if the respondent was clear about his/her opinion on the relative import-ance of the needs. If the consistency ratio was greater than 0.1, the questionnaire was returned to the respondent to ask to recheck his/her responses. Out of the 16 question-naires returned to respondents for recheck, there were 6 copies of which the consistency ratios were still greater than 0.1. Due to the respondent either was not skil-ful at doing pairwise comparison or was not sure about the importance of the needs, these six copies were discarded. The survey ended up with receiving 30 sets of valid responses.
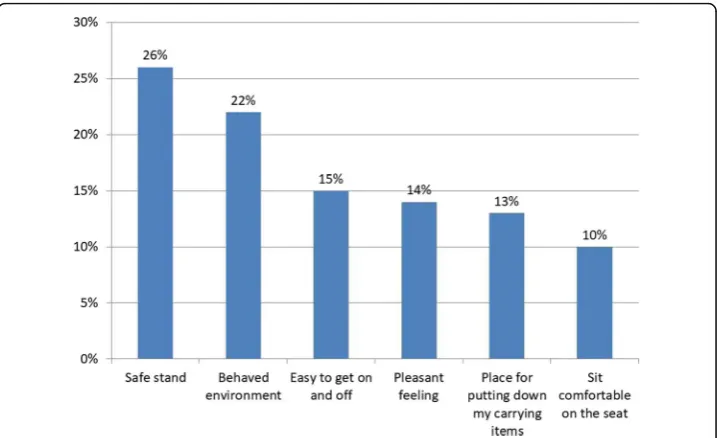
The importance of the six needs of each set of responses was first calculated, and subsequently, the individual results were synthesized into an aggregate result. Figure 7
is the result of one set of individual responses, and Fig. 8 displays the overall import-ance of the six needs.
The result shows that “safe stand” (26%) and“behaved environment” (22%) are two needs the everyday ordinary passengers found most important when they ride on the train of the ERL. These two needs accounted for 48% of the total importance of the six needs.
Implications
To make a successful improvement in ride quality, providers of urban rail transit ser-vices need to acquire a thorough understanding of the passengers’ situational needs in the train cars before taking any action. Besides, the needs would vary from passenger group to passenger group and differ from situation to situation, but also many implicit needs would only be found and potential needs would be discovered through explor-ation. Therefore, a comprehensive understanding of what the target passengers demanded could hardly be acquired if directly adopting the needs reported by other studies or simply summarizing the ideas thrown out in a brainstorming session. A de-tailed need exploration is required.
To QFD, VOC collection is not simply a task but an opportunity for the team mem-bers to understand the needs via interacting with the target passengers in person and experiencing the real situations themselves. Although the close-encountering kind of
Fig. 7Importance of the needs of one set of individual responses
collection methods, such as gemba visiting and dialoguing with customers, might take team members more time and efforts, what they would obtain at the end of the process is far more than a set of data. The “feel” they obtained from talking to those who use the service and experiencing the problems in real situations would help them under-stand the demanded needs to a much deeper and broader extent. As a team member of the ERL case shared,“I now could feel how unsafe it could be for riding on the moving train during the business hours after I have conducted the gemba visits.” To facilitate the understanding of problems and needs as well as project execution, in accordance with the nature of the study, the team has to employ some other supplementary methods as well. For example, mounted video recording would be useful for under-standing a particular action or response and free web forum is a way for welcoming voices of all kinds.
The interpretation type of deployment of QFD plays two roles in devising solution. First, interpretation helps the team members grasp a clearer meaning and obtain a more complete description of each of the needs in demand. For example, for the need of“safe stand”of the ERL case study, the constituents of the need tell the team that the target passengers do not feel safe standing in the cars because there are many things surrounding them instead of simply the vibration of the train. Second, the process in-spires the team members on coming up with new ideas about the needs as well as the ways for meeting the needs when they make interpretation together. The more compre-hensive the interpretation, the more items would be carried forward to the subsequent conversion deployments and the more ideas for meeting the needs would be generated. The team thus becomes more able to produce quality solutions. Furthermore, rather than taking piecemeal approach and making remedial responses, a fuller consideration into the possible aspects, such as the settings and the facilities, the seats and the floor, and the policies and the arrangements, would help formulate effective improvement plans. Let us take the need of “behaved environment” of the ERL case study as an ex-ample. To achieve a balance between freedom and control in public spaces, it is neces-sary to first identify the behaviour to be ethically controlled by passengers themselves or strategically controlled by the service provider [74]. After identification, the rail com-pany could deploy both kinds of behaviours into respective issues for devising solutions. For the former, the solutions could be some campaigns and promotion. For the latter, they could be some innovative designs for “controlling” certain behaviours, something for preventing kids from circling round the handrails or those sitting on the bench from extending their legs into the aisle.
The understanding of passengers’needs is important to seeking ways for meeting the needs. Only after the team members have acquired a thorough understanding of the needs and the list of explored needs they drawn up is comprehensive could the import-ance about the needs obtained from the survey be usable and useful for the service pro-vider to make effective improvement.
Discussion
For the ERL case
There are three suggestions for increasing the validity of the obtained result. First, con-duct surveys of greater scale. Second, use some more methods, such as complaint ana-lysis and layout anaana-lysis, to collect more VOC from different sources. Besides reducing the chance of certain needs from missing, the team members could gain more inspira-tions from the process. Third, let more teams interpret the same set of VOC to reduce the bias the team members put into the interpretation.
For improving train ride quality
The methodology only has suggested how to understand the passengers’ ride needs, and the case study has explored only those of the everyday ordinary passengers. To im-prove train ride quality, it is necessary to conduct further studies on (1) understanding the ride needs of other passenger groups and (2) extending the methodology to help formulate solutions.
Understand the needs of other passenger groups
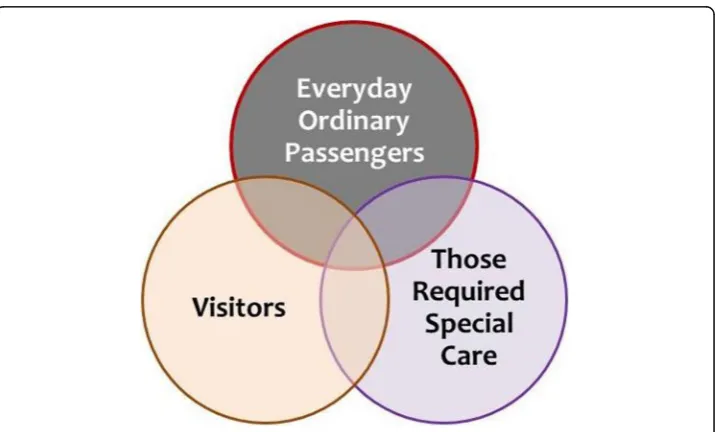
With regard to the nature of the case study, we could broadly divide the passengers into three groups: (1) everyday ordinary passengers, (2) visitors, and (3) those who required special care (elderly, disabled, pregnant, physically hurt, those accompanying with wheel-chaired persons and carrying baby strollers). Some characteristics are exclusive for a par-ticular group, and some characteristics would share between two or even all three groups, so do their needs. Figure9displays the relationships of the needs of the groups.
The case study only has explored the needs of the everyday ordinary passengers. It is ne-cessary to find out the needs of the other two passenger groups as well. Although many needs would be the same, some needs are group specific. One may argue why not putting all groups in one single study so that the team could find out the needs of the three pas-senger groups all at one time. However, it is better to carry out individual studies as there
is a chance the important needs identified are only applicable to one or two passenger groups rather than to all passenger groups. Upon completing the individual studies, an in-vestigation on the inter-relationships among the important needs of the three passenger groups is required in order to obtain a full picture of the passengers’needs. The output could be one whole set of needs but also could be several sets of needs.
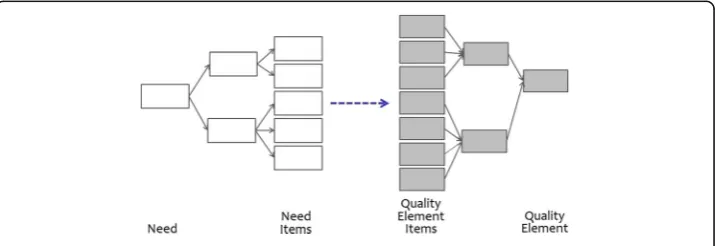
Extend the methodology to help formulate solutions
The methodology only has suggested how to understand the passengers’ride needs. It is necessary to extend it to help formulate solutions as well. One of the ways is to con-tinue with the conversion type of deployment upon completing the interpretation type of deployment. For example, if“behaved environment”is an important need to all cus-tomer groups, then the team could refer back to its affinity diagrams to convert the need items into quality element items. Using the technique of affinity diagramming again, the team would obtain quality elements by grouping the quality element items. Figure10shows the concept of making the conversion.
Upon identifying the important quality elements by means of prioritization, engineers and designers will know better how to satisfy the need.
Conclusions
This study contributes to the literature on providing a methodology for understanding the passengers’ride needs of urban rail transit services. Adhering to the basic principles of QFD and the operation of the interpretation type of deployment, the suggested methodology is particularly suitable for exploring the situational needs of passengers. The ERL case study, on the one hand, has explained how the methodology be exercised and, on the other hand, suggested some improvement areas for the rail company. Whilst the important needs that were found would inform the rail company on making decisions and taking actions, the process of exercising the methodology would contrib-ute to sustainability. The exploration, the exchange of views, the inspiration arising from interaction, and the knowledge that was built would help derive innovative solu-tions for satisfying the passengers’needs.
The applicability of the methodology could extend to various dimensions and aspects when adaptations and modifications are appropriately made. Here are some of the sug-gested applications. First, the methodology is highly applicable to understand the pas-sengers’needs of other servicing sites of urban rail transit, such as the needs when they
pass through the lobby or wait for the train at the platform. Second, other kinds of public mass transport could make use of the methodology to understand the ride needs of their passengers. However, due to the kinds of problems and the services and set-tings of the cabins are different, adjustments would be required. Last but not the least, the practitioners of those public services that are of similar nature to urban rail transit could adopt the approach and the tools of the methodology to understand the situ-ational needs of those they serve.
The methodology this study suggests is only one of the methods for understanding passengers’ ride needs. However, it is a practical method. Together with other tech-niques and tools, the methodology would help providers of urban rail transit services on achieving quality and attaining sustainability.
Abbreviations
AHP:Analytic hierarchy process; CWQC: Company-wide quality control; ERL: East Rail Line; MTR: Mass Transit Railway; QFD: Quality function deployment; TQM: Total quality management; VOC: Voice of customer
Acknowledgements
Not applicable
Authors’contributions
CCYP provided guidance for the execution of the study and wrote the manuscript. CKS planned the study and played an active role in interpreting the collected VOC. CC took up a major role in collecting and processing the VOC as well as conducting the survey. TKL supervised the study, discussed with the team members at every phase of the study, and offered them advice. All authors read and approved the final manuscript.
Authors’information
Catherine Chan is a certified QFD Black Belt® and a research fellow of City University of Hong Kong at the time of the study. She won the Akao Scholarship® in 2007 and obtained her PhD in Quality Management from Hong Kong Polytechnic University in 2010.
Funding
The Research Grants Council of Hong Kong Special Administrative Region, China TBRS Project (no. T32-101/15-R), and City University of Hong Kong SRG Project (no. 7004698).
Availability of data and materials
The datasets used and/or analysed during the current study are available from the corresponding author on reasonable request.
Competing interests
The authors declare that they have no competing interests.
Author details
1
SEEM Department, City University of Hong Kong, Tat Chee Avenue, Kowloon, Hong Kong.2School of Data Science, City University of Hong Kong, Tat Chee Avenue, Kowloon, Hong Kong.
Received: 29 March 2019 Accepted: 18 October 2019
References
1. Celik E, Aydin N, Gumus AT (2014) A multiattribute customer satisfaction evaluation approach for rail transit network: a real case study for Istanbul, Turkey. Transp Policy 36:283–293.https://doi.org/10.1016/j.tranpol.2014.09.005
2. Nordin NH, Masirin MIM, Ghazali MI, Azis MI (2016) Passenger rail service comfortability in Kuala Lumpur urban transit system. MATEC Web Conf 47:03011.https://doi.org/10.1051/matecconf/20164703011
3. Frommer G (2012) Two decades of noise control engineering and implementation for the Mass Transit Railway Corporation. J Acoust Soc Am 131:3263.https://doi.org/10.1121/1.4708187
4. Alpopi C, Manole C (2012) Qualitative analysis of urban public transportation in Bucharest. Manag Res Pract 4(2):68–86 5. Lam WHK, Cheung CY, Poon YF (1999) A study of passenger measures at the Hong Kong mass transit railway system. J
Adv Transport 33(3):389–399
6. Halvorsen A, Koutsopoulos HN, Lau S, Au T, Zhao J (2016) Reducing subway crowding: analysis of an off-peak discount experiment in Hong Kong. Transp Res Rec 2544:38–46.https://doi.org/10.3141/2544-05
7. Wang E, Zhang Y, Yue H (2017) Developing a new design method avoiding latent congestion danger in urban rail transit station. Transp Res Proc 25:4079–4095.https://doi.org/10.1016/j.trpro.2017.05.332
8. Suman HK, Bolia NB, Tiwari G (2017) Comparing public bus transport service attributes in Delhi and Mumbai: policy implications for improving bus service in Delhi. Transp Policy 56:63–74.https://doi.org/10.1016/j.tranpol.2017.03.002
10. Ali AH (2010) An assessment of the quality of intraurban bus services in the city of Enugu, Enugu State, Nigeria. Theoretical Empirica 5(6):74–91
11. Maskeliūnaite L, Sivilevicius H, Podvezko V (2009) Research on the quality of passenger transportation by railway. Transport 24(2):100–112.https://doi.org/10.3846/1648-4142.2009.24.100-112
12. Cao J, Cao X, Zhang C, Huang X (2016) The gaps in satisfaction with transit services among BRT, metro, and bus riders: evidence from Guangzhou. J Transp Land Use 9(3):97–109.https://doi.org/10.5198/jtlu.2015.592
13. Eboli L, Mazzulla G (2015) Relationships between rail passengers’satisfaction and service quality: a framework for identifying key service factors. Public Transp 7:185–201.https://doi.org/10.1007/s12469-014-0096-x
14. Abenoza RF, Cats O, Susilo YO (2017) Travel satisfaction with public transport: determinants, user classes, regional disparities and their evolution. Transport Res A-Pol 95:64–84.https://doi.org/10.1016/j.tra.2016.11.011
15. Wan D, Kamga C, Hao W, Sugiura A, Beaton EB (2016) Customer satisfaction with bus rapid transit: a study of New York City select bus service applying structural equation modeling. Public Transp 8:497–520.https://doi.org/ 10.1007/s12469-016-0135-x
16. Shen W, Xiao W, Wang X (2016) Passenger satisfaction evaluation model for urban rail transit: a structural equation modeling based on partial least squares. Transp Policy 40:20–31.https://doi.org/10.1016/j.tranpol. 2015.10.006
17. Cao J, Cao X (2017) Comparing importance-performance and three-factor theory in assessing rider satisfaction with transit. J Transp Land use 10(1):837–854.https://doi.org/10.5198/jtlu.2017.907
18. Yang Q (2018) An application of QFD: listen to the VOC for understanding the passengers’needs with the seat of high-speed rail in China. In: Proceedings of the 24thinternational symposium on quality function deployment, Hong Kong, 6-7 September 2018
19. Chin K, Yang Q, Chan CYP, Kwok LT, Li Y (2019) Identifying passengers’needs in cabin interiors of high-speed rails in China using quality function deployment for improving passenger satisfaction. Transport Res A-Pol 119:326–342.https:// doi.org/10.1016/j.tra.2018.12.004
20. Chan CYP, López-Fresno P (2017) QFD: fundamentality for innovation. In: Tsui E, Cheung B (eds) Proceedings of the 14th
international conference on intellectual capital, knowledge management & organisational learning ICICKM 2017, Hong Kong, 7-8 December 2017
21. Ishikawa K (1990) Introduction to quality control. 3A Corporation, Tokyo
22. Sullivan LP (1986) Quality function deployment: a system to assure that customer needs drive the product design and production process. Qual Prog 1986(Jun):39–50
23. Kogure M, Akao Y (1983) Quality function deployment and CWQC in Japan: a strategy for assuring that quality is built into new products. Qual Prog 1983(Oct):25–29
24. Akao Y (1990) History of quality function deployment in Japan. In: Zeller HJ (ed) The best on quality: targets, improvement, systems, vol 3. C. Hanser, Muchen, pp 183–196
25. Kondo Y (1998) Hoshin kanri–a participative way of quality management in Japan. TQM Mag 10(6):425–431.https://doi.org/10.1108/ 09544789810239155
26. Takayanagi A (1994) The concept of the quality chart and its beginning. In: Mizuno S, Akao Y (eds) QFD: the customer-driven approach to quality planning and deployment, Asian Productivity Organization
27. Aoki H, Kawasaki Y, Taniguchi T (1990) Using quality deployment charts: subsystems, parts deployment, quality assurance charts. In: Akao Y (ed) Quality function deployment: integrating customer requirements into product design. Productivity Press, Portland
28. Tanisawa T (1994) Quality deployment and manufacturing methods deployment. In: Mizuno S, Akao Y (eds) QFD: the customer-driven approach to quality planning and deployment, Asian Productivity Organization
29. Akao Y (1991) Hoshin kanri: policy deployment for successful TQM. Productivity Press, Portland
30. Mazur GH, Takasu H, Ono M (2001) Policy management: quality approach to the strategic planning, 2nd edn. IQD, California 31. ELBoushi M, Zawacki S, Domb E (1994) Towards better object oriented software designs with quality function deployment.
In: Transactions from the sixth symposium on quality function deployment, Novi, Michigan, 13-14 June 1994
32. Oke SA, Ofiabulu CE, Banjo AA, Akanbi OG, Oyawale FA (2008) The combined application of quality function deployment and Pareto analysis for hotel services improvement. IJPQM 3(2):241–262.https://doi.org/10.1504/IJPQM.2008.016567
33. Knowles G (2002) Customer driven design of products and services. In: Antony J, Preece D (eds) Understanding, managing and implementing quality: frameworks, techniques and cases. Routledge, London
34. Haapalainen M, Kivistö-Rahnasto J, Mattila M (1999/2000) Ergonomic design of non-powered hand tools: an application of quality function deployment (QFD). Occup Ergon 2(3):179–189
35. Booysen GJ, Barnard LJ, Truscott M, Beer DJ (2006) Anaesthetic mouthpiece development through QFD and customer interaction with functional prototypes. Rapid Prototyping J 12(4):89–197.https://doi.org/10.1108/13552540610682697
36. Ghobadian A, Terry AJ (1995) How Alitalia improves service quality through quality function deployment. Manag Serv Qual 5(5):25–30.https://doi.org/10.1108/09604529510100459
37. Chan AHS, Wai SH (2000) Improving customer satisfaction of smartcard system: integration of human factors and quality function deployment. In: Proceedings of the IEA 2000/HFES 2000 Congress.https://doi.org/10.1177/ 154193120004403804
38. Yamamoto C, Kishi K, Hara F, Satoh K (2005) Using quality function deployment to evaluate government services from the customers’perspective. J East Asia Soc 6:4160–4175.https://doi.org/10.11175/easts.6.4160
39. Bulut E, Duru O, Huang ST (2018) A multidimensional QFD design for the service quality assessment of Kansai International Airport, Japan. Total Qual Manag Bus 29(2):202–224.https://doi.org/10.1080/14783363.2016.1174058
40. Kurtulmuşoğlu FB, Pakdil F, Atalay KD (2016) Quality improvement strategies of highway bus service based on a fuzzy quality function deployment approach. TransportmetricaA12(2):175–202.https://doi.org/10.1080/23249935.2015.1117535
41. Akao Y (1995) Voice of customer–basic for partnership–as a viewpoint from QFD. Paper presented at India’s third summit on quality, Confederation of Indian Industry, India, 2-4 Nov 1995
42. Mazur G (2003) Voice of the customer (define): QFD to define value. In: ASQ’s 57thannual quality congress proceedings, USA
44. Friman I (1999) User requirements for electric wheelchairs. In: Bühler C, Knops H (eds) Assistive technology on the threshold of the new millennium. IOS, Washington DC
45. Ekdahl F, Gustafsson A, Norling P (1997) QFD for service development: a case study from Telia Mobitel. In: Gustafsson A, Bergman B, Ekdahl F (eds) Proceedings of the third annual international QFD symposium, vol 2, Linköping, Sweden, 1–2 October 1997
46. Imai M (1996) A consultant and gemba. J Manag Consult 1996(May):3–9
47. Mazur GH (1997) Close encounters of the QFD kind. Paper presented at the sixth annual service quality conference 48. Terninko J (2000) Using the gemba to improve FMEA. In: Transactions from the 12th symposium on quality function
deployment / international symposium on QFD 2000-Novi, Michigan, 5-6 June 2000
49. Nelson D (1992) The customer process table: hearing customers’voices even if they’re not talking. In: Transactions from the fourth symposium on quality function deployment, Novi, Michigan, 15-16 June 1992
50. MacDonald D (2012) When is a cappuccino not a cappuccino? Address unspoken needs to achieve ultimate customer satisfaction. Qual Prog 45(10):53
51. Hearon H, Mazur G (2002) Using QFD to improve technical support to make commodity products more competitive. In: Transactions from the fourteenth symposium on quality function deployment, San Diego, California, 9 December 2002 52. Rings CM, Barton BW, Mazur GH (1998) Consumer encounters of the third kind: improving idea development and
concept optimization. In: Transactions from the tenth symposium on quality function deployment, Novi, Michigan, 14-16 June 1998
53. Bolt A, Mazur GH (1999) Jurassic QFD: integrating service and product quality function deployment. In: Transactions from the eleventh symposium on quality function deployment, Novi, Michigan, 12-18 June 1999
54. Ronney E, Olfe P, Mazur G (2000) Gemba research in the Japanese cellular phone market. In: Transactions from the 12th symposium on quality function deployment / international symposium on QFD 2000-Novi, Michigan, 5-6 June 2000 55. Lampa S, Mazur GH (1996) Bagel sales double at Host Marriott: using quality function deployment. In: Transactions from
the eighth symposium on quality function deployment / international symposium on QFD 96, Novi, Michigan, 9-11 June 1996
56. Vongpatanasin T, Mazur GH (2009) Why we drink beer: using QFD, Kansei and AHP to understand how consumers identify with brands. Paper presented at German QFD symposium 2009–Wolfsburg, September 2009
57. Vongpatanasin T, Mazur GH (2012) Thai brewery deploys QFD tools to tap into consumer motivation. ASQ Knowledge Center, USA, 2009(December):1–6
58. Samuel D, Hines P (1999) Designing a supply chain change process: a food distribution case. IJRDM 27(10):409–420.
https://doi.org/10.1108/09590559910297893
59. Lim PC, Tang NKH (2000) The development of a model for total quality healthcare. Manag Serv Qual 10(2):103–111.
https://doi.org/10.1108/09604520010318290
60. Chan CYP, Taylor G (2015) QFD: listening to the voice and meeting the needs of employees for improving productivity. In: The paper collection of the 21stinternational symposium on quality function deployment, Zhejiang University,
Hangzhou, China, 25-26 September 2015
61. Chan CYP, Taylor G (2014) A QFD project on using the deployment concept to design a maternity cocktail dress. In: Proceedings of the 20thinternational symposium on quality function deployment, Istanbul, Turkey, 4-5 September 2014 62. Akao Y, Kozawa Y (2005) QFD and knowledge management: a QFD case study on a survey of surgery patient
satisfaction. In: Ho S, Tang X, Liu Y (eds) Proceedings of the 10thinternational conference on ISO 9000 & TQM, Shanghai, China, 28–30 March 2005
63. Akao Y, Kazuhiko K (2007) QFD and knowledge management: QFD application on the development of a finger vein authentication device. In: Transactions from the 19th symposium on quality function deployment / the international symposium on QFD 2007–Williamsburg, Virginia, 7-8 September 2007
64. Tse FTF, Chan CYP (2016) New approach for fashion design: case study of employing user-oriented method to design mother-to-be party dress. RJTA 20(1):53–60.https://doi.org/10.1108/RJTA-02-2015-0004
65. ReVelle JB (2004) Quality essentials: a reference from A to Z. ASQ Quality Press, Wisconsin
66. Malarranha C, Puga-Leal R, Pereira ZL (2008) Application of quality methodologies to the development of a website. IJIEM 5(4):313–332.https://doi.org/10.1016/S0950-5849(02)00002-2
67. Saaty TL (1994) Fundamentals of decision making and priority theory with the analytic hierarchy process. RWS Publications, Pittsburgh
68. Saaty TL (2007) The analytic hierarchy process: how to measure intangibles in a meaningful way side by side with tangibles. In: Transactions from the 19th symposium on quality function deployment / the international symposium on QFD2007–Williamsburg,Virginia, 7-8 September 2007
69. Mazur G (2015) ISO 16355–the international standard for QFD. In: The paper collection of the 21stinternational
symposium on quality function deployment, Zhejiang University, Hangzhou, China, 25-26 September 2015 70. Chan CYP, Mazur GH (2017) ISO 16355: modern QFD generated from 50 years of practice. In: Proceedings of the 21st
international conference on ISO 9000 & TQM, Beijing Normal University, Zhuhai campus, Zhuhai, China, 14-16 April 2017 71. Chan CYP, Mazur GH, Stansfield K (2018) AHP for comprehensive approach of modern QFD. Paper presented at the
international symposium on analytic hierarchy process, Hong Kong, 13-15 July 2018
72. Hepler C, Mazur G (2007) The analytic hierarchy process: methodologies and applications with customers and management. In: Transactions from the 19th symposium on quality function deployment / the international symposium on QFD 2007–Williamsburg, Virginia, 7-8 September 2007
73. MTRC (2017) Annual report of Mass Transit Railway Corporation 2017
74. Zhao T, Siu KWM (2014) Freedom and control: a state of balance in public space. Facilities 32(11–12):606–623.https:// doi.org/10.1108/F-08-2012-0064
Publisher’s Note