R E S E A R C H
Open Access
Cost-effectiveness analysis of three
algorithms for diagnosing primary ciliary
dyskinesia: a simulation study
Panayiotis Kouis
1,2,9*, Stefania I. Papatheodorou
2,3, Nicos Middleton
4, George Giallouros
1, Kyriacos Kyriacou
5,6,
Joshua T. Cohen
7, John S. Evans
8and Panayiotis K. Yiallouros
1Abstract
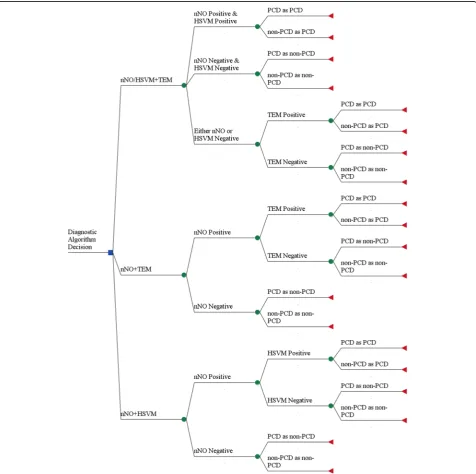
Background:Primary Ciliary Dyskinesia (PCD) diagnosis relies on a combination of tests which may include (a) nasal Nitric Oxide (nNO), (b) High Speed Video Microscopy (HSVM) and (c) Transmission Electron Microscopy (TEM). There is variability in the availability of these tests and lack of universal agreement whether diagnostic tests should be performed in sequence or in parallel. We assessed three combinations of tests for PCD diagnosis and estimated net sensitivity and specificity as well as cost-effectiveness (CE) and incremental cost-effectiveness (ICE) ratios. Methods and results:A hypothetical initial population of 1000 referrals (expected 320 PCD patients) was followed through a probabilistic decision analysis model which was created to assess the CE of three diagnostic algorithms (a) nNO + TEM in sequence, (b) nNO + HSVM in sequence and (c) nNO/HSVM in parallel followed, in cases with conflicting results, by confirmatory TEM (nNO/HSVM+TEM). Number of PCD patients identified, CE and ICE ratios were calculated using Monte Carlo simulations. Out of 320 expected PCD patients, 313 were identified by nNO/ HSVM+TEM, 274 with nNO + HSVM and 198 with nNO + TEM. The nNO/HSVM+TEM had the highest mean annual cost (€209 K) followed by nNO + TEM (€150 K) and nNO + HSVM (€136 K). The nNO + HSVM algorithm dominated the nNO + TEM algorithm (less costly and more effective). The ICE ratio for nNO/HSVM+TEM was€2.1 K per additional PCD patient identified.
Conclusions:The diagnostic algorithm (nNO/HSVM+TEM) with parallel testing outperforms algorithms with tests in sequence. These findings, can inform the dialogue on the development of evidence-based guidelines for PCD diagnostic testing. Future research in understudied aspects of the disease, such as PCD-related quality of life and PCD-associated costs, is needed to help the better implementation of these guidelines across various healthcare systems.
Keywords:Primary ciliary dyskinesia, Diagnosis, Cost-effectiveness analysis, Decision analysis Kartagener syndrome, Nitric oxide, High speed video microscopy, Transmission Electron microscopy
Introduction
Primary Ciliary Dyskinesia (PCD) is a genetically heteroge-neous disorder that affects one in approximately 15,000 live births [1]. PCD is characterized by chronic sinopulmonary symptoms and development of bronchiectasis, recurrent otitis, male infertility and situs inversus [2]. Defective
components of the ciliary axoneme (e.g. dynein arms) as well as dysfunctional regulatory or transport proteins have been implicated in the etiology of PCD and to date more than 40 genes have been found to be causative for PCD [3]. This genetic heterogeneity translates into a wide spectrum of ciliary structural and beating abnormalities and a diverse diagnostic and clinical phenotype. Patients with PCD usually present with chronic cough and rhinorrhea as well as recur-rent infections of unknown aetiology. Some of them also present with situs abnormalities and in the case of older pa-tients, with infertility or subfertility [2]. Bronchiectasis may
© The Author(s). 2019Open AccessThis article is distributed under the terms of the Creative Commons Attribution 4.0 International License (http://creativecommons.org/licenses/by/4.0/), which permits unrestricted use, distribution, and reproduction in any medium, provided you give appropriate credit to the original author(s) and the source, provide a link to the Creative Commons license, and indicate if changes were made. The Creative Commons Public Domain Dedication waiver (http://creativecommons.org/publicdomain/zero/1.0/) applies to the data made available in this article, unless otherwise stated. * Correspondence:[email protected]
1
Respiratory Physiology Laboratory, Medical School, University of Cyprus, Nicosia, Cyprus
2Cyprus International Institute for Environmental and Public Health, Cyprus
University of Technology, Limassol, Cyprus
develop already in childhood in some patients [4] and it is usually present in most adult PCD patients [5]. Late diagno-sis is associated with a worse clinical picture and reduced lung function [6,7], while several patients undergo surgical resection of lung segments to control lung infection, even before diagnosis is established [8]. Situs inversus is the only characteristic manifestation associated with PCD. With the exception of chronic cough and rhinorrhea, all other manifestations may not always be present and may be characterized by considerable variability in their severity [9–11]. As a result, heterogeneity in the clinical picture presents a challenge to the clinician who needs to decide when to test for PCD and with which diagnostic test(s). Diagnostic approach is further perplexed by heterogeneity in the diagnostic features of the disease as respiratory epi-thelial samples from PCD patients exhibit diverse ciliary ultrastructure [12] and motility pattern [13] especially in the presence of infection [14].
Up to date diagnostic testing for PCD relies on a combin-ation of tests which primarily includes nasal Nitric Oxide (nNO) [15], High Speed Video Microscopy (HSVM) [16,
17] and Transmission Electron Microscopy (TEM) [8,18].
Measurement of nNO is considered the simplest and fastest among the PCD diagnostics tests as it only involves air suc-tion from the nasal passage via an olive while the subject preferably maintains velum closure through active mouth exhalation against resistance [19]. The other two tests re-quire brushing of the inferior nasal turbinate and the col-lection of an adequate sample of respiratory epithelial cells in order to allow for the assessment of ciliary motility using HSVM and ciliary ultrastructure using TEM [20]. As no single test has 100% sensitivity and specificity [21], which is further complicated by the fact that many centers lack ei-ther the equipment or expertise to perform all required tests, some of which are quite laborious and time consum-ing, different diagnostic algorithms for diagnosis of PCD have been adopted by diagnostic centers across the world [22]. Recently, nNO has been proposed as the screening test of choice in cohorts of patients with PCD-suspect man-ifestations due to its high ability to discriminate between PCD and non-PCD subjects [15,23]. Although the cost of a (validated) chemiluminescence NO analyser is quite high (approximately€40,000 per piece), the recent development of handheld and cheaper electrochemical NO analysers [24] and publication of relevant technical guidelines by the American Thoracic Society (ATS) and the European Respiratory Society (ERS) [19] may further enhance the potential of nNO measurement to be used as a screening test in the clinical setting and especially in countries with limited resources or in areas that lack, or are distant from, PCD-specialist centers [25]. How-ever, the use of a non-perfect screening test such as nNO in isolation may allow for some PCD patients with false negative results to be missed entirely or
some non-PCD patients with false-positive results to undergo further diagnostic tests. For this reason, the diagnostic algorithm described as part of Standardized Operating Procedures for PCD diagnosis developed by the EU-funded Seventh Framework Program project BESTCILIA, in 2016, proposed standardized operating procedures for PCD diagnosis and a diagnostic algo-rithm which recommended that nNO should be per-formed in parallel with HSVM and confirmatory TEM assessment should follow in case of conflicting results (Additional file 1). Similarly, the recent ERS guidelines for the diagnosis of Primary Ciliary Dyskinesia also recommend a diagnostic algorithm which includes as a first step the parallel performance of both nNO and HSVM and confirmation with TEM in a second step [26]. The rationale of employing a diagnostic algorithm which proposes parallel performance of nNO and HSVM, is to take advantage of the ability of the one test to identify cases that the other test may have missed. Consequently, a positive result in both tests provides evidence that PCD is “highly likely”while a negative result in both tests, espe-cially in the absence of very strong clinical suspicion, pro-vides evidence to consider PCD diagnosis as “extremely unlikely” [26]. Nevertheless, such algorithms require the performance of a significantly higher number of nasal brushings for HSVM and result in higher costs compared to algorithms that only require the performance of a con-firmatory test (HSVM or TEM) following a positive screening test.
To better illuminate the decision-making process, the overall diagnostic accuracy of each algorithm, the associated costs as well as the resulting health bene-fits for PCD patients, need to be addressed and com-pared. This study aimed to evaluate the diagnostic accuracy, the effectiveness and incremental cost-effectiveness of three distinct diagnostic algorithms for patients referred for PCD diagnostic testing across the European Union through a probabilistic decision analysis framework.
Methods
Decision tree model
evaluated three diagnostic algorithms in this study is presented in Fig. 1. The starting population of referrals for PCD diagnosting testing that enters the model was defined as one thousand per year for the whole of the European Union (EU). To estimate the classification of patients under each diagnostic algorithm, Bayes’ The-orem was used. Bayes’ Theorem allows the calculation of probability of suffering from PCD given the pre-test probability of disease and given a positive or negative
diagnostic test [27]. The formula for estimating the prob-ability of disease given positive diagnostic test is:
P PCDð jTestþÞ ¼P Testð þ jPCDÞ P PCDP Testðð Þ þþ jPCDP Testð Þ þ jP PCDðnonPCDÞ Þ P nonPCDð Þ
Where P(Test+|PCD) is the probability of positive test given PCD is present (test sensitivity), P(PCD) is the preva-lence of PCD in the tested population, P(Test+|nonPCD) is
the probability of positive test given disease is not present (1-specificity of the test) and P(non-PCD) is the probability of not having PCD in the tested population. The formula can be rearranged accordingly to calculate probability of PCD given positive diagnostic test, probability of PCD given negative diagnostic test and probability of non-PCD given negative diagnostic test as well as probability of non-PCD given positive diagnostic test. To model the sequence of diagnostic tests in each diagnostic algorithm the resulting probability of PCD given a positive first test as calculated using Bayes’Theorem was used as the pre-test probability of PCD for the second test. The final modeled health out-puts regarding the effectiveness of each diagnostic algo-rithm included the number of PCD patients confirmed as PCD (True Positive - TP), PCD patients missed (False Negative - FN), non-PCD patients wrongly diagnosed as PCD (False Positive - FP), and non-PCD patients that had a diagnosis of PCD excluded (True Negative - TN). In addition, the annual total cost outcome (in Euros) was cal-culated for each diagnostic algorithm using a micro-costing approach. This approach involves the recognition of all underlying activities that make up a specific healthcare pro-cedure and the product of resource cost and resource use provides the total cost estimate for the procedure [28]. A detailed description of the diagnostic cost analysis is pre-sented in the Technical Appendix (Additional file2).
The Incremental Cost-Effectiveness Ratios (ICER) were calculated as the ratio of incremental costs to in-cremental effectiveness, i.e. [29]:
ICER¼EffectCostA−CostB A−EffectB
Here, CostA and CostB are the total annual per-patient
costs of performing test algorithms A and B, respectively, and EffectA and EffectB are the number of PCD patients
correctly diagnosed with PCD for the same diagnostic algorithms.
The costing perspective of this analysis is societal as it considers all relevant costs for the society (including costs borne by the patient, and/or social services) and not just the costs that are incurred by the healthcare sys-tem [30]. Ideally, the cost-effectiveness analysis should not be limited to diagnostic costs and outcomes but should include all expenditures as well as all effective-ness outcomes, preferably in terms of quality-adjusted life years (QALYs), a metric used broadly in the health economics literature [31]. For this reason, a secondary, extended analysis was performed, further described in Additional file3.
Model parameter inputs
The prevalence of PCD in the general population was assumed to be 1/15,000 births and the prevalence of
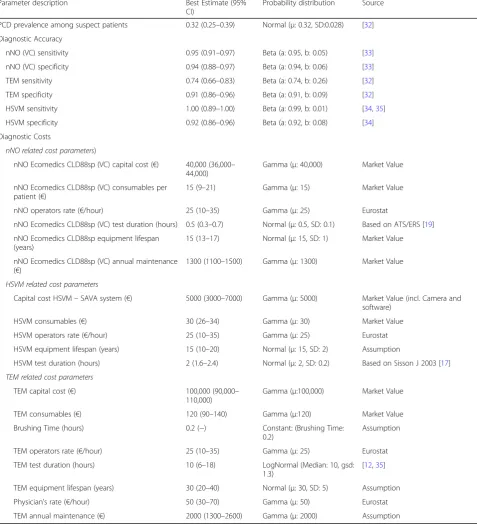
PCD among patients referred for diagnostic testing was allocated a probability of 0.32 (95% CI: 0.26–0.39) as re-ported before [32]. Data regarding the diagnostic accur-acy of each test were derived from systematic reviews and meta-analyses, when possible, and from alternative data sources such as large studies and multiple sources when meta-analytic estimates were not available. The parameter inputs for sensitivity and specificity of nNO during Velum Closure (VC) were 0.95 (95% CI: 0.91– 0.97) and 0.94 (0.88–0.97) respectively, based on pub-lished meta-analytic estimates [33]. For HSVM, the par-ameter inputs for sensitivity and specificity were 1.0 (95% CI: 0.89–1.00) and 0.92 (95% CI: 0.86–0.96) based on published evidence provided by Boon et al. 2013 and Jackson et al. 2016 [34, 35]. For assessment of ciliary ultrastructure with TEM, the parameter inputs for sensi-tivity and specificity were 0.74 (95% CI: 0.68–0.80) and 0.91 (95% CI: 0.86–0.96) respectively based on a recent meta-analysis of 11 studies [32]. Sensitivity and specifi-city values for HSVM and TEM following a positive nNO result were obtained from the study by Jackson et al. 2016 [35]. Table 1 summarizes all parameter values that were part of the basic model.
Characterization of uncertainty
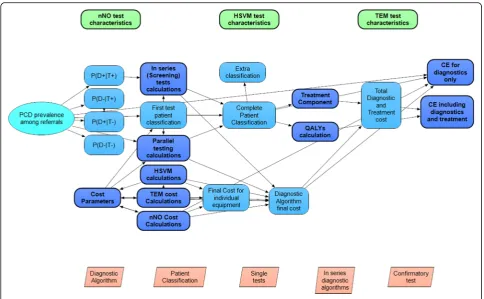
Reported uncertainty around pooled estimates of the meta-analyses of diagnostic effectiveness and uncertainties about the true value of costs and other parameters are reflected by the probability distributions around the par-ameter means which are used in this model. A Cost-Effectiveness Acceptability Curve was used to demon-strate the uncertainty in the estimation of the ICER [36] while the robustness of the estimated ICER was tested through the performance of one-way sensitivity analyses where the input parameters varied over their range. All parameters and equations constitute the final model which was developed with ANALYTICA 101 edition (Lu-mina decision systems, CA, United States). The model was executed with 3000 iterations per “model run” using Latin Hypercube sampling to generate samples from the underlying parameter probability distributions. The model can be assessed online (Additional file 4) and a model overview is presented in Fig.2.
Results
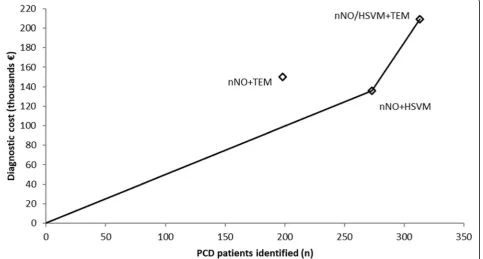
algorithm but also the costliest (313 PCD cases identified/ year, 209 thousand€/year). nNO + HSVM was the second most effective (273 PCD cases identified/year, 136 thou-sand €/year) while nNO + TEM was the least effective (198 PCD cases identified/year, 150 thousand€/year). The most cost-effective algorithm was nNO + HSVM with a CER of €653/PCD case identified, followed by nNO/ HSVM+TEM (€678/PCD case identified) and nNO +
TEM (€975/PCD case identified). The cost effectiveness frontier in presented in Fig.3and the resulting ICER for nNO/HSVM+TEM compared to nNO + HSVM, the sec-ond most effective algorithm, is€2097 per additional PCD case identified. The nNO + TEM algorithm is dominated (simple dominance) by nNO + HSVM as it is more expen-sive but less effective compared to nNO + HSVM. Figure4 presents the cost-effectiveness acceptability curve (CEAC)
Table 1Model parameter inputs
Parameter description Best Estimate (95% CI)
Probability distribution Source
PCD prevalence among suspect patients 0.32 (0.25–0.39) Normal (μ: 0.32, SD:0.028) [32] Diagnostic Accuracy
nNO (VC) sensitivity 0.95 (0.91–0.97) Beta (a: 0.95, b: 0.05) [33] nNO (VC) specificity 0.94 (0.88–0.97) Beta (a: 0.94, b: 0.06) [33] TEM sensitivity 0.74 (0.66–0.83) Beta (a: 0.74, b: 0.26) [32] TEM specificity 0.91 (0.86–0.96) Beta (a: 0.91, b: 0.09) [32] HSVM sensitivity 1.00 (0.89–1.00) Beta (a: 0.99, b: 0.01) [34,35] HSVM specificity 0.92 (0.86–0.96) Beta (a: 0.92, b: 0.08) [34] Diagnostic Costs
nNO related cost parameters)
nNO Ecomedics CLD88sp (VC) capital cost (€) 40,000 (36,000– 44,000)
Gamma (μ: 40,000) Market Value
nNO Ecomedics CLD88sp (VC) consumables per patient (€)
15 (9–21) Gamma (μ: 15) Market Value
nNO operators rate (€/hour) 25 (10–35) Gamma (μ: 25) Eurostat
nNO Ecomedics CLD88sp (VC) test duration (hours) 0.5 (0.3–0.7) Normal (μ: 0.5, SD: 0.1) Based on ATS/ERS [19] nNO Ecomedics CLD88sp equipment lifespan
(years)
15 (13–17) Normal (μ: 15, SD: 1) Market Value
nNO Ecomedics CLD88sp (VC) annual maintenance (€)
1300 (1100–1500) Gamma (μ: 1300) Market Value
HSVM related cost parameters
Capital cost HSVM–SAVA system (€) 5000 (3000–7000) Gamma (μ: 5000) Market Value (incl. Camera and software)
HSVM consumables (€) 30 (26–34) Gamma (μ: 30) Market Value
HSVM operators rate (€/hour) 25 (10–35) Gamma (μ: 25) Eurostat
HSVM equipment lifespan (years) 15 (10–20) Normal (μ: 15, SD: 2) Assumption
HSVM test duration (hours) 2 (1.6–2.4) Normal (μ: 2, SD: 0.2) Based on Sisson J 2003 [17]
TEM related cost parameters
TEM capital cost (€) 100,000 (90,000– 110,000)
Gamma (μ:100,000) Market Value
TEM consumables (€) 120 (90–140) Gamma (μ:120) Market Value
Brushing Time (hours) 0.2 (−) Constant: (Brushing Time: 0.2)
Assumption
TEM operators rate (€/hour) 25 (10–35) Gamma (μ: 25) Eurostat
TEM test duration (hours) 10 (6–18) LogNormal (Median: 10, gsd: 1.3)
[12,35]
TEM equipment lifespan (years) 30 (20–40) Normal (μ: 30, SD: 5) Assumption
Physician’s rate (€/hour) 50 (30–70) Gamma (μ: 50) Eurostat
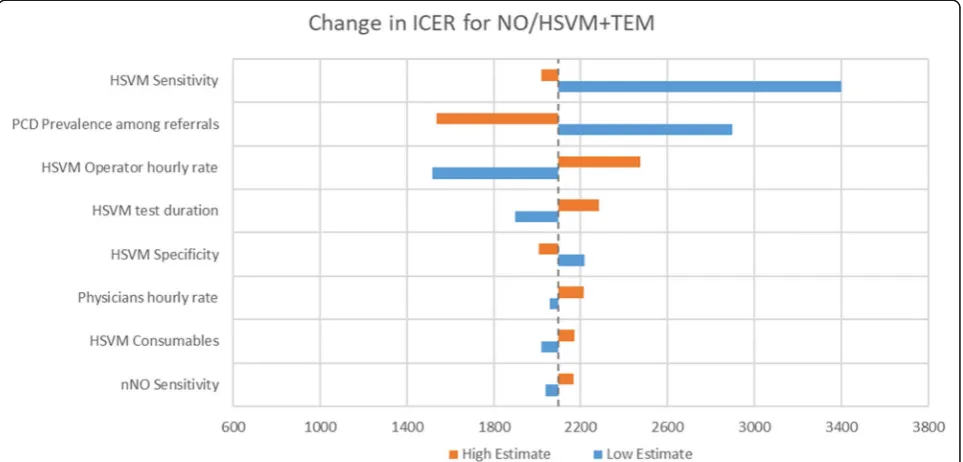
for nNO/HSVM+TEM. The CEAC demonstrates the un-certainty in the estimation of ICER and provides informa-tion about the probability of nNO/HSVM+TEM being more cost effective compared to nNO + HSVM for a range of potential monetary amounts (termed willingness to pay (WTP) thresholds) that a decision maker might be willing to pay to correctly diagnose an additional PCD case. For a WTP threshold equal to €2500 the probability of nNO/ HSVM+TEM being cost effective is over 70% and for a WTP threshold equal to€3500 the probability is over 97%. The results of one-way sensitivity analyses demonstrated that the modelled mean ICER for nNO/HSVM+TEM is
primarily affected by changes in the input value for HSVM sensitivity, followed by the changes in input values for the prevalence of PCD among suspect patients. Changes in the input values of other modelled parameters had smaller ef-fects on the ICER (Fig.5). Results of secondary analysis are presented in Additional file3.
Discussion
The high genetic heterogeneity that characterizes PCD and the resulting inability to rely on a single test to con-firm or exclude diagnosis of the disease has led to in-creased research interest in specialized diagnostic testing
Fig. 2Model Overview. Schematic Overview of ANALYTICA model
Table 2Diagnostic accuracy of nNO + TEM, nNO + HSVM and nNO/HSVM+TEM algorithms
Classification Diagnostic Algorithm
NO+TEM NO+HSVM NO/HSVM+TEM
PCD as PCD (% of PCD) 198 (62%) 273 (85%) 313 (98%)
PCD as non-PCD (% of PCD) 122 (38%) 47 (15%) 7 (2%)
Non-PCD as non-PCD (% of non-PCD) 678 (99.7%) 680 (100%) 674 (99%)
Non-PCD as PCD (% of non-PCD) 2 (0.003%) 0 (0%) 6 (1%)
Net Sensitivity 62% 85% 98%
Net Specificity 99.7% 100% 99%
Net PPV 99% 100% 98%
Net NPV 85% 94% 99%
for PCD in recent years. This study compares three diag-nostic strategies currently in use for diagnosing PCD and reports on their effectiveness and cost-effectiveness under a societal costing perspective. Data were drawn primarily from meta-analyses of diagnostic effectiveness or published estimates from large studies and were syn-thesized in a probabilistic cost effectiveness model.
The results presented here demonstrate that when the effectiveness outcome is defined as the number of PCD patients identified, nNO/HSVM+TEM is the most ef-fective diagnostic algorithm followed closely by nNO + HSVM. Both nNO/HSVM+TEM and nNO + HSVM are significantly more effective compared to the third diag-nostic strategy evaluated, nNO + TEM. Mean estimates of CERs demonstrate that nNO + HSVM was the most cost-effective option and a decision maker should expect
to pay on average an amount equal to €2097 per add-itional case identified if nNO/HSVM+TEM is imple-mented. Whether the effectiveness outcome is defined as the number of PCD patients identified or as the num-ber of QALYs saved nNO/HSVM+TEM was still the most effective algorithm followed by nNO + HSVM and nNO + TEM. Nevertheless, the results of the extended model, which are expressed in Euros per QALY saved, demonstrate that all three diagnostic algorithms appear to be very cost-effective. Compared to no screening, the cost per QALY gained for the three diagnostic algo-rithms examined here ranged from€6674 to€12,930, an estimate which is lower than WTP thresholds commonly used by regulatory authorities around the world. Such WTP thresholds range between £20,000 and £30,000 per QALY saved in the UK [37] or the more conventional
Table 3Diagnostic costs per year, identified PCD cases per year (mean and 95% Confidence Interval)
Diagnostic Algorithm
Diagnostic Cost per annum in thousand€
PCD cases identified per annum
ICER (€/PCD case identified)
Compared to No screening Compared to next most effective algorithma
Do nothing 0 0 -
-NO + HSVM 136 (109–177) 273 (105–335) 653 (385–1110) 653 (385–1110)
NO + TEM 150 (118–208) 198 (76–242) 975 (595–1605) Dominated
NO/HSVM + TEM 209 (173–261) 313 (231–373) 678 (508–1003) 2097 (770–3233)
a
ICER compared to next less expensive algorithm omits from consideration those algorithms that are“dominated”(make health worse and cost more). Hence, we compare NO/HSVM+TEM (last row) to NO+HSVM (2nd row) and not to NO+TEM (3rd row) because NO+TEM is dominated (it costs more than NO+HSVM but identifies fewer cases)
WTP threshold of $50,000 per QALY saved, commonly used in the US [38] or even more recently suggested WTP thresholds in the range of $100,000 to $200,000 per QALY [39].
Diagnostic algorithms including nNO measurement during VC as an initial screening could be cost-effective. However, our results demonstrate that nNO screening is more effective when the confirmatory test is HSVM and not TEM. Although in the past TEM was considered the
gold standard [13], it is now known to miss an important fraction of PCD patients [32], mainly those with biallelic mutations in DNAH11 gene [40] and those with specific ultrastructural abnormalities (nexin link defects) that are not easily detectable by standard TEM [41]. Furthermore, it requires access to a specialized lab with personnel expe-rienced in staining and interpretation of TEM micro-graphs and consequently involves considerable resource allocation [42]. At the same time, TEM studies are usually
Fig. 4Cost Effectiveness Acceptability Curve for nNO/HSVM+TEM. The probability that diagnostic algorithm nNO/HSVM+TEM is cost-effective for a range of WTP thresholds
time consuming and results are frequently obtained and communicated to patients considerably later than results of other tests thus contributing to patient distress [43]. HSVM is easier, considerably faster and cheaper than TEM as it is usually performed on the same day following nasal brushing and the equipment required consists of standard microscope, a high speed video camera and a standard computer loaded with specialized software. It has also been reported to be a highly sensitive and specific test [35] thus it significantly outperforms TEM as a con-firmatory test both in terms of overall effectiveness and cost. However, extra caution is required with HSVM as it may be affected by observer subjectivity and non-PCD specific findings which may interfere with the motility in-terpretation [22]. Overall, the parallel performance of two highly specific and sensitive tests such as nNO and HSVM during the first step of the diagnostic algorithm, followed by confirmatory TEM in only the few cases of conflicting findings, results in the identification of most PCD patients and does not require the performance of the more expen-sive and time consuming TEM analysis for the largest part of the cohort of suspect patients.
In this study we did not include diagnostic algorithms that included immunofluorescence (IF) and/or genetic test-ing for PCD. Although a recent study has reported the first diagnostic accuracy and cost estimates for immunofluores-cence testing in PCD [44], the use of this test is still very limited (as it is performed only in a small number of few highly specialized centers around the world). Genetic test-ing, on the other hand, is available in many centers around the world. However, as yet, there is little standardization of procedures for the conduct and interpretation of results. Different centers may use different technologies and may not test for the same number of genes [45,46]. Thus esti-mation of the effectiveness or the cost of genetic testing as diagnostic for PCD was not possible at this stage and it was not included in the diagnostic algorithms considered in our analysis. This approach is in line with the recent guidelines published by the ERS where genetic testing was recom-mended as a last step following abnormal TEM primarily for further characterization of the underlying defect or as a final diagnostic test if all other tests were inconclusive. For immunofluorescence there was no ERS recommendation towards its use as a diagnostic test given the scarcity of evi-dence [26].
The main strength of this study is that it makes use of evidence-based estimates and individual good quality stud-ies on the diagnostic accuracy of nNO, TEM and HSVM and the prevalence of PCD among cohorts of referred sus-pect patients. With the use of Bayes’Theorem, it was pos-sible to estimate the diagnostic effectiveness of sequential tests and to compare the effectiveness of diagnostic algo-rithms instead of simply comparing the effectiveness of iso-lated tests, as had been done in the past. In addition, our
analysis of the costs involved in diagnostic testing followed standard approaches for economic analysis of healthcare procedures [28] and made use of the extensive literature on the effort, equipment and consumables involved in the per-formance of nNO [47,48], HSVM [13,35] and TEM [18]. Based on this evidence, we were able to calculate effective-ness and economic outcomes (number of PCD patients identified, total diagnostic costs) as well as robust CERs, ICERs and identify the cost-effectiveness frontier.
Nonetheless, this study also has some limitations. In the main analysis, although our data on diagnostic ac-curacy are mostly based on meta-analyses of well con-ducted studies, these are characterized by a degree of heterogeneity [32, 33]. On the other hand, our data on diagnostic cost parameters are primarily based on realis-tic estimates of current market values, although these may not be uniform across all EU countries. The one-way sensitivity analyses for the diagnostic ICER for NO/ HSVM+TEM demonstrates that our results are most sensitive to variations in HSVM sensitivity and PCD prevalence among suspect patients. A recent, large study on diagnostic accuracy of HSVM reported a sensitivity of 100%, which is in line with the value used in our model [49]. Nevertheless, it is possible that PCD preva-lence among referred suspect patients varies consider-ably between countries, as different countries may utilize different diagnostic protocols and referral patterns [20, 50, 51]. Even so, these disparities between countries are expected to be reduced in the future with the increasing use of clinical scoring tools [52], the intercalation be-tween PCD clinicians in international networking pro-jects such as the BEAT-PCD COST project [53] and the establishment of European Reference Networks for rare diseases including PCD (ERN-LUNG) [54].
limitation, the underlying uncertainty in each parameter was characterized and included in the model. Through Latin Hypercube sampling and Monte Carlo analysis, these uncertainties in individual parameters were propa-gated through the model and are reflected in the uncer-tainty in final model outputs.
Evidence about treatment costs is especially weak. We found no evidence of the cost of treatment of PCD patients who remain undiagnosed; and only lim-ited evidence about the cost of treatment of PCD pa-tients who are properly diagnosed. A sensitivity analysis was conducted to determine whether differ-ences in the overall costs of treatment of diagnosed and undiagnosed PCD patients affected the estimates of cost-effectiveness from the extended model. The overall order of diagnostic algorithms was not affected and nNO/HSVM+TEM was the most cost efficient al-gorithm in all scenarios. However, the magnitude of the difference in the cost effectiveness of the three al-gorithms was significantly affected, with nNO/ HSVM+TEM becoming relatively more cost-effective when it was assumed that the cost of treating undiag-nosed PCD patients was at least 3 times greater than the treatment cost for properly-diagnosed PCD pa-tients. This highlights the importance of future stud-ies which address the economic cost of treatment in PCD patients before and after diagnosis.
We encountered a similar lack of data on the impact of PCD on life expectancy and the patients’ valuation of health status (health utility). Currently, PCD is considered a disease characterized by normal or near-normal life span, although cases of premature mortality among PCD patients are reported in the literature [8,60]. To date, no study has reported on patients’ life expectancy and this lack of information could be attributed to the fact that PCD has been studied primarily in small cohorts in the pediatric setting. The recently established prospective international PCD registry [61], which now includes sev-eral thousands of pediatric and adult patients, is expected in the next few years to provide data on disease progres-sion and life-expectancy. Likewise, to date no study has re-ported on health state utilities in PCD and thus we used in our calculations data on health utilities from mild Cys-tic Fibrosis patients that have been previously reported to have similar clinical severity with PCD [62]. The one-way sensitivity analyses in the extended model, which included treatment costs and outcomes, demonstrated that the most important parameter impacting the CER of nNO/ HSVM+TEM was PCD health utility followed by loss of productivity, reduction in life expectancy and antibiotics cost. In order to further improve our understanding of the disease and better inform the development and improve-ment of guidelines for PCD diagnosis and treatimprove-ment, fu-ture studies aiming to assess the real value of
cost-of-illness, healthcare utilization estimates and health state utilities are urgently needed.
Conclusions
Across the world, many PCD diagnostic centers follow a variety of algorithms for diagnosing PCD and, most likely, in some low income countries, there is a complete lack of specialized diagnostic testing. The results of this study suggest that a diagnostic algorithm which includes nNO during VC as a screening test followed by confirmatory HSVM identifies approximately 85% of PCD patients with a mean CER of €653per PCD case identified. The algo-rithm which maximizes the number of PCD patients iden-tified involves parallel performance of nNO and HSVM as the first step, followed by TEM as a confirmatory test for the few cases where nNO and HSVM yield conflicting re-sults, with a corresponding ICER of€2097 per additional PCD patient identified. Decision analysis methods and the evidence from this study can inform the dialogue on evidence-based guidelines for PCD diagnostic testing. Fu-ture studies in understudied aspects of PCD relating to quality of life, treatment efficiency and associated costs are urgently needed to help the better implementation of these guidelines across various healthcare systems.
Additional files
Additional file 1:BESTCILIA Diagnostic Algorithm for PCD. (PDF 188 kb)
Additional file 2:Technical Appendix. (DOCX 20 kb)
Additional file 3:Secondary Analysis. (DOCX 169 kb)
Additional file 4:Cost-effectiveness ANALYTICA model. (ANA 51 kb)
Abbreviations
ATS:American Thoracic Society; CEAC: Cost Effectiveness Acceptability Curve; CER: Cost Effectiveness Ratio; ERN: European Reference Networks;
ERS: European Respiratory Society; EU: European Union; HSVM: High Speed Video Microscopy; ICER: Incremental Cost Effectiveness Ratio; nNO: Nasal Nitric Oxide; PCD: Primary Ciliary Dyskinesia; QALY: Quality Adjusted Life Years; TEM: Transmission Electron Microscopy; VC: Vellum Closure; WTP: Willingness to pay
Acknowledgments
P.K. was supported by the European Union’s Seventh Framework Program EC-GA No. 305404 BESTCILIA.
Authors’contributions
Funding
This study was supported by EU 7th Framework Program EC-GA No. 305404 BESTCILIA. The sponsors had no role or involvement in study design; in the collection, analysis and interpretation of data.
Availability of data and materials
The datasets used and analyzed during the current study are available from the corresponding author on reasonable request.
Ethics approval and consent to participate Not applicable.
Consent for publication Not applicable.
Competing interests
The authors declare that they have no competing interests.
Author details
1
Respiratory Physiology Laboratory, Medical School, University of Cyprus, Nicosia, Cyprus.2Cyprus International Institute for Environmental and Public
Health, Cyprus University of Technology, Limassol, Cyprus.3Department of Epidemiology, Harvard T.H. Chan School of Public Health, Harvard University, Boston, MA, USA.4Department of Nursing, Cyprus University of Technology, Limassol, Cyprus.5Department of Electron Microscopy and Molecular
Pathology, Cyprus Institute of Neurology and Genetics, Nicosia, Cyprus.
6Cyprus School of Molecular Medicine, Nicosia, Cyprus.7Tufts Center for the
Study of Drug Development, Boston, USA.8Department of Environmental Health, Harvard T. H. Chan School of Public Health, Boston, USA.9Shiakolas
Educational Center of Clinical Medicine, Palaios Dromos Lefkosias-Lemesou 215/6, 2029 Aglantzia Nicosia, Cyprus.
Received: 17 January 2019 Accepted: 4 June 2019
References
1. Knowles MR, Daniels LA, Davis SD, Zariwala MA, Leigh MW. Primary ciliary dyskinesia. Recent advances in diagnostics, genetics, and characterization of clinical disease. Am J Respir Crit Care Med. 2013;188(8):913–22.
2. Noone PG, Leigh MW, Sannuti A, Minnix SL, Carson JL, Hazucha M, Zariwala MA, Knowles MR. Primary ciliary dyskinesia: diagnostic and phenotypic features. Am J Respir Crit Care Med. 2004;169(4):459–67.
3. Kurkowiak M, Zietkiewicz E, Witt M. Recent advances in primary ciliary dyskinesia genetics. J Med Genet. 2015;52(1):1–9.
4. Magnin ML, Cros P, Beydon N, Mahloul M, Tamalet A, Escudier E, Clément A, Pointe L, Ducou H, Blanchon S. Longitudinal lung function and structural changes in children with primary ciliary dyskinesia. Pediatr Pulmonol. 2012; 47(8):816–25.
5. Honoré I, Burgel P. Primary ciliary dyskinesia in adults. Rev Mal Respir. 2016; 33(2):165–189.3.
6. Coren M, Meeks M, Morrison I, Buchdahl R, Bush A. Primary ciliary dyskinesia: age at diagnosis and symptom history. Acta Paediatr. 2002;91(6):667–9. 7. Ellerman A, Bisgaard H. Longitudinal study of lung function in a cohort of
primary ciliary dyskinesia. Eur Respir J. 1997;10(10):2376–2379.4-6. 8. Yiallouros PK, Kouis P, Middleton N, Nearchou M, Adamidi T, Georgiou A,
Eleftheriou A, Ioannou P, Hadjisavvas A, Kyriacou K. Clinical features of primary ciliary dyskinesia in Cyprus with emphasis on lobectomized patients. Respir Med. 2015;109(3):347–56.
9. Vallet C, Escudier E, Roudot-Thoraval F, Blanchon S, Fauroux B, Beydon N, Boule M, Vojtek AM, Amselem S, Clément A, Tamalet A. Primary ciliary dyskinesia presentation in 60 children according to ciliary ultrastructure. Eur J Pediatr. 2013;172(8):1053–60.
10. Davis SD, Ferkol TW, Rosenfeld M, Lee HS, Dell SD, Sagel SD, Milla C, Zariwala MA, Pittman JE, Shapiro AJ, Carson JL, Krischer JP, Hazucha MJ, Cooper ML, Knowles MR, Leigh MW. Clinical features of childhood primary ciliary dyskinesia by genotype and ultrastructural phenotype. Am J Respir Crit Care Med. 2015;191(3):316–24.
11. Goutaki M, Meier AB, Halbeisen FS, Lucas JS, Dell SD, Maurer E, Casaulta C, Jurca M, Spycher BD, Kuehni CE. (2016) Clinical manifestations in primary ciliary dyskinesia: systematic review and meta-analysis. Eur Respir J. 2016; 48(4):1081–95.
12. Shoemark A, Dixon M, Corrin B, Dewar A. Twenty-year review of quantitative transmission electron microscopy for the diagnosis of primary ciliary dyskinesia. J Clin Pathol. 2012;65(3):267–71.
13. Raidt J, Wallmeier J, Hjeij R, Onnebrink JG, Pennekamp P, Loges NT, Olbrich H, Haffner K, Dougherty GW, Omran H, Werner C. Ciliary beat pattern and frequency in genetic variants of primary ciliary dyskinesia. Eur Respir J. 2014; 44(6):1579–88.
14. Hirst RA, Jackson CL, Coles JL, Williams G, Rutman A, Goggin PM, Adam EC, Page A, Evans HJ, Lackie PM, O’Callaghan C, Lucas JS. Culture of primary ciliary dyskinesia epithelial cells at air-liquid interface can alter ciliary phenotype but remains a robust and informative diagnostic aid. PLoS One. 2014;9(2):e89675.
15. Collins SA, Gove K, Walker W, Lucas JS. Nasal nitric oxide screening for primary ciliary dyskinesia: systematic review and meta-analysis. Eur Respir J. 2014;44(6):1589–99.
16. Chilvers MA, Rutman A, O'callaghan C. Ciliary beat pattern is associated with specific ultrastructural defects in primary ciliary dyskinesia. J Allergy Clin Immunol. 2003;112(3):518–24.
17. Sisson JH, Stoner J, Ammons B, Wyatt T. All-digital image capture and whole-field analysis of ciliary beat frequency. J Microsc. 2003;211(2):103–11. 18. Papon JF, Coste A, Roudot-Thoraval F, Boucherat M, Roger G, Tamalet A,
Vojtek AM, Amselem S, Escudier E. A 20-year experience of electron microscopy in the diagnosis of primary ciliary dyskinesia. Eur Respir J. 2010; 35(5):1057–63.
19. American Thoracic Society/European Respiratory Society. ATS/ERS recommendations for standardized procedures for the online and offline measurement of exhaled lower respiratory nitric oxide and nasal nitric oxide, 2005. Am J Respir Crit Care Med. 2005;171:912–30.
20. Barbato A, Frischer T, Kuehni CE, Snijders D, Azevedo I, Baktai G, Bartoloni L, Eber E, Escribano A, Haarman E, Hesselmar B, Hogg C, Jorissen M, Lucas J, Nielsen KG, O'Callaghan C, Omran H, Pohunek P, Strippoli MPF, Bush A. Primary ciliary dyskinesia: a consensus statement on diagnostic and treatment approaches in children. Eur Respir J. 2009;34(6):1264–76. 21. Lucas JS, Burgess A, Mitchison HM, Moya E, Williamson M, Hogg C. National
PCD service U: diagnosis and management of primary ciliary dyskinesia. Arch Dis Child. 2014;99(9):850–6.
22. Lucas JS, Leigh MW. Diagnosis of primary ciliary dyskinesia: searching for a gold standard. Eur Respir J. 2014;44(6):1418–22.
23. Marthin JK, Nielsen KG. Choice of nasal nitric oxide technique as first-line test for primary ciliary dyskinesia. Eur Respir J. 2011;37(3):559–65. 24. Marthin JK, Nielsen KG. Hand-held tidal breathing nasal nitric oxide
measurement–a promising targeted case-finding tool for the diagnosis of primary ciliary dyskinesia. PLoS One. 2013;8(2):e57262.
25. Rumman N, Jackson C, Collins S, Goggin P, Coles J, Lucas JS. Diagnosis of primary ciliary dyskinesia: potential options for resource-limited countries. Eur Respir Rev. 2017;26(143).https://doi.org/10.1183/16000617.0058-2016
Print 2017 Jan.
26. Lucas JS, Barbato A, Collins SA, Goutaki M, Behan L, Caudri D, Dell S, Eber E, Escudier E, Hirst RA, Hogg C, Jorissen M, Latzin P, Legendre M, Leigh MW, Midulla F, Nielsen KG, Omran H, Papon JF, Pohunek P, Redfern B, Rigau D, Rindlisbacher B, Santamaria F, Shoemark A, Snijders D, Tonia T, Titieni A, Walker WT, Werner C, Bush A, Kuehni CE. European Respiratory Society guidelines for the diagnosis of primary ciliary dyskinesia. Eur Respir J. 2017; 49(1).https://doi.org/10.1183/13993003.01090-2016Print 2017 Jan. 27. Sox HC. Medical decision making. Philadelphia: ACP Press; 1988. 28. Xu X, Nardini HKG, Ruger JP. Micro-costing studies in the health and medical
literature: protocol for a systematic review. Systematic reviews. 2014;3(1):47. 29. Owens DK. Interpretation of cost-effectiveness analyses. J Gen Intern Med.
1998;13(10):716–7.
30. Gray AM, Clarke PM, Wolstenholme JL, Wordsworth S. Applied methods of cost-effectiveness analysis in healthcare, vol. 3. Oxford: Oxford University Press; 2011.
31. Neumann PJ, Thorat T, Shi J, Saret CJ, Cohen JT. The changing face of the cost-utility literature, 1990–2012. Value Health. 2015;18(2):271–7.
32. Kouis P, Yiallouros PK, Middleton N, Evans JS, Kyriacou K, Papatheodorou SI. Prevalence of primary ciliary dyskinesia in consecutive referrals of suspect cases and the transmission electron microscopy detection rate: a systematic review and meta-analysis. Pediatr Res. 2017;81(3):398–405.
34. Boon M, Jorissen M, Jaspers M, Cuppens H, De Boeck K. Is the sensitivity of primary ciliary dyskinesia detection by ciliary function analysis 100%? Eur Respir J. 2013;42(4):1159–61.
35. Jackson CL, Behan L, Collins SA, Goggin PM, Adam EC, Coles JL, Evans HJ, Harris A, Lackie P, Packham S, Page A, Thompson J, Walker WT, Kuehni C, Lucas JS. Accuracy of diagnostic testing in primary ciliary dyskinesia. Eur Respir J. 2016;47(3):837–48.
36. Van Hout BA, Al MJ, Gordon GS, Rutten FF. Costs, effects and C/E-ratios alongside a clinical trial. Health Econ. 1994;3(5):309–19.
37. Judgements SV. Principles for the development of NICE guidance. London: National Institute for health and care excellence; 2008. p. 478.
38. Shiroiwa T, Sung Y, Fukuda T, Lang H, Bae S, Tsutani K. International survey on willingness-to-pay (WTP) for one additional QALY gained: what is the threshold of cost effectiveness? Health Econ. 2010;19(4):422–37. 39. Neumann PJ, Cohen JT, Weinstein MC. Updating cost-effectiveness—the
curious resilience of the $50,000-per-QALY threshold. N Engl J Med. 2014; 371(9):796–7.
40. Schwabe GC, Hoffmann K, Loges NT, Birker D, Rossier C, De Santi MM, Olbrich H, Fliegauf M, Failly M, Liebers U. Primary ciliary dyskinesia associated with normal axoneme ultrastructure is caused by DNAH11 mutations. Hum Mutat. 2008;29(2):289–98.
41. Olbrich H, Cremers C, Loges NT, Werner C, Nielsen KG, Marthin JK, Philipsen M, Wallmeier J, Pennekamp P, Menchen T. Loss-of-function GAS8 mutations cause primary ciliary dyskinesia and disrupt the nexin-dynein regulatory complex. Am J Hum Genet. 2015;97(4):546–54.
42. Leigh MW, O'callaghan C, Knowles MR. The challenges of diagnosing primary ciliary dyskinesia. Proc Am Thorac Soc. 2011;8(5):434–7. 43. Behan L, Dunn Galvin A, Rubbo B, Masefield S, Copeland F, Manion M,
Rindlisbacher B, Redfern B, Lucas JS. Diagnosing primary ciliary dyskinesia: an international patient perspective. Eur Respir J. 2016;48(4):1096–107. 44. Shoemark A, Frost E, Dixon M, Ollosson S, Kilpin K, Patel M, Scully J, Rogers
AV, Mitchison HM, Bush A: Accuracy of immunofluorescence in the diagnosis of primary ciliary dyskinesia. Am J Respir Crit Care Med. 2017; 196(1):94–101.
45. Boaretto F, Snijders D, Salvoro C, Spalletta A, Mostacciuolo ML, Collura M, Cazzato S, Girosi D, Silvestri M, Rossi GA. Diagnosis of primary ciliary dyskinesia by a targeted next-generation sequencing panel: molecular and clinical findings in Italian patients. J Mol Diagn. 2016;18(6):912–22. 46. Kim RH, A Hall D, Cutz E, Knowles MR, Nelligan KA, Nykamp K, Zariwala MA,
Dell SD. The role of molecular genetic analysis in the diagnosis of primary ciliary dyskinesia. Ann Am Thorac Soc. 2014;11(3):351–9.
47. Leigh MW, Hazucha MJ, Chawla KK, Baker BR, Shapiro AJ, Brown DE, LaVange LM, Horton BJ, Qaqish B, Carson JL. Standardizing nasal nitric oxide measurement as a test for primary ciliary dyskinesia. Ann Am Thorac Soc. 2013;10(6):574–81. 48. Harris A, Bhullar E, Gove K, Joslin R, Pelling J, Evans HJ, Walker WT, Lucas JS.
Validation of a portable nitric oxide analyzer for screening in primary ciliary dyskinesias. BMC Pulm Med. 2014;14(1):18.
49. Rubbo B, Shoemark A, Jackson CL, Hirst R, Thompson J, Hayes J, Frost E, Copeland F, Hogg C, O'Callaghan C, Reading I, Lucas JS. National PCD service, UK. Accuracy of high-speed video analysis to diagnose primary ciliary dyskinesia. Chest. 2019.https://doi.org/10.1016/j.chest.2019.01.036. 50. O’Callaghan C, Chilvers M, Hogg C, Bush A, Lucas J. Diagnosing primary
ciliary dyskinesia. Thorax. 2007;62:656–7.
51. Kuehni CE, Frischer T, Strippoli MP, et al. ERS task force on primary ciliary dyskinesia in children. Factors influencing age at diagnosis of primary ciliary dyskinesia in European children. Eur Respir J. 2010;36:1248–58.
52. Behan L, Dimitrov BD, Kuehni CE, Hogg C, Carroll M, Evans HJ, Goutaki M, Harris A, Packham S, Walker WT, Lucas JS. PICADAR: a diagnostic predictive tool for primary ciliary dyskinesia. Eur Respir J. 2016;47(4):1103–12. 53. Rubbo B, Behan L, Dehlink E, Goutaki M, Hogg C, Kouis P, Kuehni CE, Latzin
P, Nielsen K, Norris D, Nyilas S, Price M, Lucas JS. Proceedings of the COST action BM1407 inaugural conference BEAT-PCD: translational research in primary ciliary dyskinesia-bench, bedside, and population perspectives. BMC Proc. 2016;10(Suppl. 9):66 BioMed Central.
54. Héon-Klin V. European reference networks for rare diseases: what is the conceptual framework? Orphanet J Rare Dis. 2017;12(1):137.
55. Kobbernagel HE, Buchvald FF, Haarman EG, Casaulta C, Collins SA, Hogg C, Kuehni CE, Lucas JS, Omran H, Quittner AL. Study protocol, rationale and recruitment in a European multi-Centre randomized controlled trial to determine the efficacy and safety of azithromycin maintenance therapy for 6 months in primary ciliary dyskinesia. BMC Pulm Med. 2016;16(1):104.
56. Chevreul K, Michel M, Brigham KB, López-Bastida J, Linertová R, Oliva-Moreno J, Serrano-Aguilar P, Posada-de-la-Paz M, Taruscio D, Schieppati A, Iskrov G, Pentek M, von der Schulenburg JMG, Kanavos P, Persson U, Fattore G. BURQOL-RD research network. Social/economic costs and health-related quality of life in patients with cystic fibrosis in Europe. Eur J Health Econ. 2016;17(1):7–18.
57. NHS Reference Costs (National Health Service, UK)https://www.gov.uk/ government/collections/nhs-reference-costs
58. Federal Health Monitoring (Germany)http://www.gbe-bund.de/gbe10/pkg_ isgbe5.prc_isgbe?p_uid=gast&p_aid=13634762&p_sprache=E
59. World Health Organization CHOICE database (World Health Organization)
https://www.who.int/choice/cost-effectiveness/en/
60. Frija-Masson J, Bassinet L, Honoré I, Dufeu N, Housset B, Coste A, Papon JF, Escudier E, Burgel PR, Maître B. Clinical characteristics, functional respiratory decline and follow-up in adult patients with primary ciliary dyskinesia. Thorax. 2017;72(2):154–60.
61. Werner C, Lablans M, Ataian M, Raidt J, Wallmeier J, Grosse-Onnebrink J, Kuehni CE, Haarman EG, Leigh MW, Quittner AL, Lucas JS, Hogg C, Witt M, Priftis KN, Yiallouros P, Nielsen KG, Santamaria F, Uckert F, Omran H. An international registry for primary ciliary dyskinesia. Eur Respir J. 2016;47(3): 849–59.
62. Cohen-Cymberknoh M, Simanovsky N, Hiller N, Hillel AG, Shoseyov D, Kerem E. Differences in disease expression between primary ciliary dyskinesia and cystic fibrosis with and without pancreatic insufficiency. Chest. 2014;145(4):738–44.
Publisher’s Note