R E S E A R C H
Open Access
On the inclusion of learners with visual
impairment in computing education programs
in Brazil: practices of educators and
perceptions of visually impaired learners
Leandro Luque
1,2*†, Leônidas O. Brandão
3, Elisabeti Kira
3and Anarosa A. F. Brandão
1†Abstract
Background: Individuals with visual impairment face varied challenges when attending education programs in many fields and levels. In computing education programs, the frequent required use of charts, graphs, and diagrams poses additional challenges to their inclusion. In order to inform and to establish appropriate action plans for a more inclusive scenario, it is important to gather information from the parties involved. In this context, this work presents the practices of educators and the perceptions of visually impaired learners regarding such inclusion.
Methods: The practice and perceptions were gathered from a survey with 56 computing educators and with 19 visually impaired learners who have attended computing education programs.
Results and discussion: The results suggest educators have limited access to knowledge related to the inclusion of visually impaired learners in lectures and feel unprepared to this scenario. On the other hand, visually impaired learners do not feel included in computing education programs.
Keywords: Computing education, Inclusion, Visual impairment, Blind, Perception, Survey
Background
Blindness and low vision are together the world’s second most common impairment, only after hearing loss [1–3]. In Brazil, they are the most common impairment, affect-ing about 3.5% of the population [4], which corresponds to 582 thousand blind people and 6 million people with low vision.
As any other person, individuals with visual impairment have the right, as provided by law, to fully participate into society. Article 5 of the Brazilian Federal Constitution (Constituição Federal) [5] states that:
“All individuals are equal, without any kind of distinction, guaranteeing [...] the inviolability of the
*Correspondence:[email protected] †Equal contributors
1Escola Politécnica, University of Sao Paulo, Prof. Luciano Gualberto Av. T3-158, 05508-010 Sao Paulo, SP, Brazil
2Sao Paulo State Technological College - Fatec, Carlos Barattino St. 908, 08773-600 Mogi das Cruzes, SP, Brazil
Full list of author information is available at the end of the article
right to life, liberty, equality, security, and property [...]” (translated by the authors)
Regarding education, there are various legal instru-ments that assure people with impairinstru-ments the right to an inclusive scenario [6–8]. Among these, the administrative ordinance (Portaria) no. 1679 [6] defines the require-ments for accessibility in higher education and the Statute of People with Disabilities (Lei Brasileira de Inclusão da Pessoa com Deficiência) [7] highlights the right to an inclusive education at all levels, as quoted next.
“Education is a right of individuals with impairments that must be secured at all educational levels [...], in order to achieve the maximum possible development of their talents and their physical, sensory, intellectual, and social skills, according to their characteristics, interests and learning needs [...]. It is a public authority incumbency to ensure, create, develop, implement, encourage, monitor and evaluate: [...] XIII - Access to higher and technological education in equal
opportunities and conditions [...]” (translated by the authors)
Unfortunately, the scenario as provided by law does not correspond to reality. Courses in many educational lev-els and fields of knowledge are still inaccessible to visually impaired learners [9–13] due to institutions’ internal and external factors.
When considering higher education, the main exter-nal factors that influence learner enrollment are related to selection exam accessibility, quality of lower education levels, and transportation accessibility. In Brazil, candi-dates to higher education must be approved in a selection exam [14]. To give equal conditions in such exams to individuals with visual impairment, the selection exam must be accessible. In addition, the education at lower levels must have been effective so that the candidate has equal conditions to compete. Transportation accessibil-ity is important not only prior to learner enrollment, but during the whole course period. Internal factors include the lack of accessibility in the physical environment, edu-cational material, pedagogical methods, cultural aspects such as prejudice, among others.
Amiralian [15] and Mrech [16] consider two pedagogical conceptions to the inclusion of learners with impairments in education programs. The first concep-tion, called normalizaconcep-tion, is aimed at making learners with impairments similar to other classmates. In this conception, the educator is not generally supported by an expert in special education. Learners with impairments have to show their ability to attend regular classes. The other conception seeks to understand how they are con-stituted and perceive the world in order to adapt material and pedagogical methods. This conception does not seek to normalize them or to impose concepts, standards, and values of sighted people.
Several studies have shown that inclusive education is more beneficial than segregated education for all students [17–20]. These surveys, focused on K12 education, show that both learners with impairments and sighted learners gain from this coexistence, and there are no records of any adverse effects on learning or socialization processes. Adverse effects, however, are noticeable when learners with impairments are simply enrolled and attend regu-lar programs, without an environment that welcomes and values differences.
In this work, we consider that the same is true in higher education and our focus of interest is related to computing education programs.
Inclusion of visually impaired learners in the computing field
In computing education programs, the frequent required use of charts, graphs, and diagrams creates additional
obstacles to visually impaired learners. Some exam-ples of graphical notations and disciplines that use them are (i) BPMN—business process model and nota-tion, MSD—module structure diagram, DFD—data flow diagram, MHD—module hierarchy diagram, IDEF— integrated DEFinition methods, SysML—systems mod-eling language, and UML—unified modmod-eling language (Software Engineering); (ii) flowcharts (Software Engi-neering, Algorithms, and Data Structures, and Program-ming Language); (iii) graphs and their subtypes, such as trees (Algorithms and Data Structures, Analysis of Algorithms, Graph Theory, Artificial Intelligence, Perfor-mance Analysis, Compilers, Formal Languages, Software Testing, and Automata and Computability); (iv) Petri nets (Distributed Systems); and (v) ERD—entity-relationship diagram (Database and Software Engineering)
Educators use such graphical representations to teach and to exemplify concepts [21], and visually impaired learners are sometimes not allowed to express their knowledge through alternative tasks [22]. In order to con-vey information in graphical representations to visually impaired learners in classroom activities, educators would have to receive support from assistants or use low-/high-tech assistive low-/high-technologies [23]. Examples of low-tech assistive technologies are tools such as pens or tactile drawings [24] and physical objects with specific semantics [25,26]. Examples of high-tech assistive technologies are tactile displays [27], optical character recognition (OCR) [28], screen readers [29], among others.
In addition to the accessibility of graphical content, the accessibility of software systems used in computing education programs, such as IDE—integrated develop-ment environdevelop-ment and CASE—computer-aided software engineering, is also important to make inclusion possible. Over the last 20 years, many studies on the inclu-sion of visually impaired learners in the computing field have been published. Some of them reported experiences related to teaching computing topics, such as object-orientation, graphs, and the UML, to visually impaired learners [21, 25, 30–33]. Other studies focused on hap-tic and multimodal interaction with computing diagrams for individuals with visual impairment [34–39]. Yet, other studies covered textual and audio-based interfaces to con-vey the content of computing diagrams to individuals with visual impairment [40–47]. These studies considered both linear and hierarchical access to diagram content. Finally, other studies covered collaborative diagram-based activities involving individuals with visual impairment [48–52].
required to establish appropriate action plans by institu-tions, educators, and decision makers.
Considering this context and the absence of such information for computing education in Brazil, this work presents the results of a survey with visu-ally impaired learners and educators in computing education programs. This survey was conducted to gather information about the practice and percep-tions of learners regarding their inclusion and of edu-cators when visually impaired learners attend their lectures.
In the “Discussion” section, we talk about some alterna-tives to promote a more inclusive scenario. In addition, we believe the information present in this paper may guide and support the definition of procedures and policies to promote a more inclusive scenario.
Methods
We conducted a survey using questionnaires aimed at identifying the practice and perceptions of educators and visually impaired learners regarding their inclusion in computing education programs. Particularly, we aimed at gathering information about the following aspects:
• Institutional provision for educators and learners;
• Changes in didactic methods (lecture style,
accessibility of graphical representations, assessment, and group activities); and
• Perception of changes in didactic methods.
The research was carried out by sending electronic questionnaires, with multiple choice and short answer questions, targetting two distinct groups: (i) educators in the field who have taught visually impaired learners and (ii) visually impaired learners who have attended courses in the field. The questionnaires for educators and learners may be found athttps://github.com/leluque/jbcs.
Educators were contacted through the Brazilian Computer Society (SBC) general list [54]. An invitation e-mail was sent to everyone in the list. The list has about 7650 members, which comprises professionals, educators, and students in the computing field. There is no available data regarding the number of educators in the list. Visually impaired learners, on the other hand, were contacted through the Blind Programmers list [55], which has individuals with visual impairment working in the computing field. An invitation e-mail was sent to everyone in the list. The list has about 180 individuals with visual impairment that are in the computing field.
The questionnaire for educators was created using Google Docs forms [56], and SurveyMonkey [57] was used for learners considering the lack of accessibility of the former to individuals with visual impairment [58]. Survey-Monkey advertises its compliance with Section 508 [59]
and WCAG 2 [60, 61]. In addition, other studies in the literature use SurveyMonkey to apply questionnaires to individuals with visual impairment [62, 63]. Finally, we had already assessed the SurveyMonkey accessibility in previous surveys.
The questionnaires were released to receive responses from June 12 to October 16, 2015. The responses were analyzed through descriptive statistics—generation of contingency tables and calculation of percentages.
Results: educators’ practices and visually impaired learners’ perceptions
In this section, we present the results of the survey. First, we present the results for the questionnaire filled in by educators. Then, in the second subsection, we present the results for the questionnaire filled in by learners.
Results for educators
The questionnaire received 56 responses. All respondents have had experience of teaching computer science sub-jects to visually impaired learners.
Institutional provision
Regarding institutional provision, we asked educators if they had received any kind of information or training from the institution to teach visually impaired learners.
From the 56 respondents, only 12, which corresponds to 21%, declared to have received institutional provision in terms of training or information. The majority of edu-cators, 44, which corresponds to 79%, declared not having received such provision.
Among the educators’ comments regarding institutional provision, we can quote:
“Teaching students with visual impairment was a challenge for me. I have not received instructions (...) and I had to (handle the situation all by myself ).”
“It was an interesting experience dealing with this situation. I could see how unprepared we are to receive students with any kind of difficulty. Anyway, my adaptation to the new situation was quick and I believe for other educators as well, but it is necessary to rethink the teaching strategies to improve inclusion.”
“[...] I understand that many educators feel unprepared to carry out the task of teaching students with visual impairment. Teaching professionals need to receive training and to develop the skills required to teach students with special needs.”
Learner assessment and group work
Out of 56 educators, the majority, 47, which corre-sponds to 84%, declared to have involved visually impaired learners in group activities with other learners. The other 9 educators declared not to have involved such learners in group activities.
Regarding learner assessment, out of 56 educators, 27, which corresponds to 48%, declared to have assessed visu-ally impaired learners differently from sighted learners. The other 29 educators declared not to have assessed them differently.
Lecture style and educational material
From the 56 educators, 47, which corresponds to 84%, have used the blackboard in their lectures. Since visually impaired learners cannot access the blackboard content, we asked educators if they have changed the lecture style when teaching visually impaired learners. From these 47 educators, 6 did not change anything in their lectures when teaching visually impaired learners. Among the 41 educators who have changed the lecture style, we identi-fied five strategies they used. These strategies are listed next.
• Using a specific part of the blackboard (for learners with low vision);
• Changing font size (use of larger fonts);
• Delivering accessible material after the lecture;
• Delivering accessible material prior to the lecture; and
• Changing verbalization—repetitively verbalized the blackboard content;
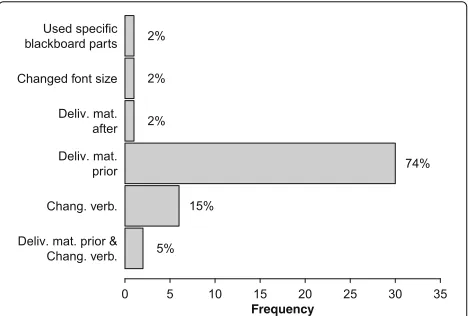
Figure1presents the frequency of use of each strategy (individually and combined).
The most common strategy used by educators was delivering material prior to the lecture. This was the only strategy used by 30 educators. Changes in verbalization
Fig. 1Strategy usage frequency. The figure presents the frequency of use of each strategy individually and in combination by 41 educators who kept using blackboards in their lectures
was the only strategy used by 6 educators. Two (2) other educators combined delivering material prior to the lec-ture with changes in verbalization. Other strategies were mentioned only once.
Approaches to make graphical representations accessible From the 56 educators, 40, which corresponds to 71%, taught subjects that involved the use of graphical rep-resentations. For those who use graphical representa-tions, we inquired about the approaches used to make graphical representations accessible to visually impaired learners. From these 40 educators, 3 answered they did not know any approach to make graphical representa-tions accessible to visually impaired learners. Among the remaining 37 educators that knew some approach, 2 did not use any. The remaining 35 educators mentioned six different approaches they used. These approaches can be classified according to the sensory perception they are based on (hearing, touch, and sight), as described next.
The approaches based on hearing comprise (i) textual description, in which a textual description of the graphical content was provided to learners prior to the lecture—the textual description was synthesized by screen readers; (ii) verbal description, in which the graphical representation content was read aloud by the educator during the lecture; and (iii) assistant support, in which the graphical repre-sentation content was read aloud by an assistant during the lecture.
Regarding touch, the following approaches were used: (iv) physical objects, in which physical objects were used to represent the graphical representation content and (v) tactile representations in paper, in which raised repre-sentations, both printed and created with special pens, were used to represent the graphical representation con-tent. Some educators also used Braille to represent textual elements of the graphical representation.
For learners with low vision, amplification (sight) was used to make the access feasible to the graphical represen-tation in its original represenrepresen-tation.
Fig. 2Frequency of use of each approach. The figure presents the frequency of use of each approach used by 35 educators to accessibilize graphical representations
Influence of institutional provision in other aspects
In order to investigate if institutional provision may influ-ence inclusion in group activities, appropriate assessment, change in lecture style over the blackboard, and accessi-bility of graphical representation, we constructed contin-gency tables (Tables1,2,3, and4).
As shown in Table 1, from those educators who had institutional provision, 10 out of 12 (83%) involved visu-ally impaired learners in group activities. For those who not had institutional provision, 37 out of 44 (84%) involved such learners in group activities. Such small difference indicates that it is not possible to perceive a statistical rela-tion between institurela-tional provision and the inclusion of visually impaired learners in group activities.
With respect to assessing visually impaired learners (Table 2), about 50% of the educators, with or without institutional support, declared to use different assessment strategies.
Therefore, by Tables1and2, the institutional provision does not have influence over the educator with respect to including visually impaired learners in group activities and to assessing them differently.
However, institutional provision seems to influence the classroom dynamics in terms of changing lecture style over blackboard and making graphical representa-tions accessible. In fact, all educators with institutional
Table 1Contingency table of institutional provision by including learners in group activities
Involved in group activities
No Yes
Institutional No 7 37 44
Provision Yes 2 10 12
9 47 56
Table 2Contingency table of institutional provision by use of different assessment strategies for visually impaired learners
Assessed learners differently
No Yes
Institutional No 22 22 44
Provision Yes 7 5 12
29 27 56
provision declared to have made these changes, as shown in Tables3and4. In contrast, from those educators who had not had institutional provision, 84% declared to have made these changes.
Results for learners
In this subsection, we present the results for the question-naire filled in by learners.
There were 31 respondents to the visually impaired learner’s questionnaire, of whom 19 were considered valid. We considered invalid those responses that were incom-plete and contained only information about the learner’s degree of visual impairment.
The respondents include 7 learners that are currently attending a computing education program, corresponding to 37% of all respondents, and 12 learners that previously attended a program in the field, corresponding to 63%. From those that have already attended a program in the field, only one did not complete the program.
Regarding their degree of visual impairment, 16 learn-ers (84%) declared to be completely blind and 3 (16%) as having low vision.
About 50% of the learners have more than 12 years of experience using computers and 1 year as professionals in the field. All of them have at least 5 years of experience as users. The most experient user has been using computers for 16 years.
Educational level and institutions
When considering the educational level they attended, 14, corresponding to 74%, attended higher education programs. The other 5, corresponding to 26%, attended certification (known as “technical” in Brazil) or profes-sionalizing programs.
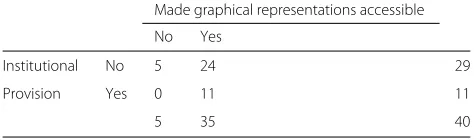
Table 3Contingency table of institutional provision by using some strategies to make graphical representations accessible
Made graphical representations accessible
No Yes
Institutional No 5 24 29
Provision Yes 0 11 11
Table 4Contingency table of institutional provision by changes in lecture style for educators that have used the blackboard
Changed lecture style over blackboard
No Yes
Institutional No 6 33 39
Provision Yes 0 8 8
6 41 47
Higher education institutions in five different states were attended by learners: (i) MT—Mato Grosso: UNIVAG—Várzea Grande University Center; (ii) PR— Paraná: UNICESUMAR—Maringa University Center and UTFPR—Federal University of Technology of Parana; (iii) RS—Rio Grande do Sul: UCS—University of Caixas do Sul; (iv) RJ—Rio de Janeiro: Estácio de Sá Univer-sity; and (v) SP—Sao Paulo: Anhanguera Faculty, Impacta Faculty, SENAC, UNICAMP—University of Campinas, UNICID—University of the City of Sao Paulo, UNIP— Paulista University, and USP—University of Sao Paulo. This group includes two of the best Brazilian universities considering international rankings [64].
Difficulties due to visual impairment
The learners were asked if they faced any difficulty due to their impairment in the courses. Only one of them answered he/she did not face any difficulty due to the impairment. This learner is completely blind and attended a short professionalizing course in a non-regular educa-tional institution. All learners in universities and certifica-tion institucertifica-tions reported difficulties.
One learner highlighted the lack of institutional provison in terms of infrastructure and assistance.
“(I felt a) lack of proper (institutional) support ... They provided the minimum ... I ... filled in the questionnaire about disabilities ..., asking (for) a(n) (assistant) to help me in the classroom, so that I could (have a better interaction) ..., but I did not receive any support. (The results of the education process) depended mainly on the good will of the (educators). There were no tactile floors and means to locate myself ...”
In addition to the lack of institutional provision, another learner highlighted a lack of educator’s
knowledge about the peculiarities of visual impairment.
“(I noticed a) ... lack of (educators) knowledge about the peculiarities of visual impairment. For example, the educators have an ingrained habit of pointing the items in the slides without mentioning their names or giving more details about the layout of the content.
(Additionally, there were) laboratories with computers
without screen readers and EAD platforms (that did not meet) the minimum accessibility requirements.”
Accessible books and assistant support
The learners were asked about the availability of accessible books and of assistant support during the program. They had to answer using a Likert scale, from Strongly Disagree (1) to Strongly Agree (5), the following statements: “All books in my course syllabus were accessible” and “I have had assistant support in all lectures in my course.”
Figures3and4present their responses. Out of 19 learn-ers, 2 did not answer these questions. Among the 17 respondents, 4 learners, corresponding to 24%, reported to have had access to accessible versions of all the books used in the program or to assistant support in all lectures. In fact, 3 of them answered “Strongly Agree” to both ques-tions. Two others chose this answer to only one of the questions. On the other hand, 5 learners, corresponding to 29% of the respondents, reported to have had no access to accessible versions of all the books used in the program. Regarding assistant support, 4 learners, which corre-sponds to 24%, reported not to have had access to assistant support in all lectures. Other 4 learners reported to have had access to assistant support in all lectures.
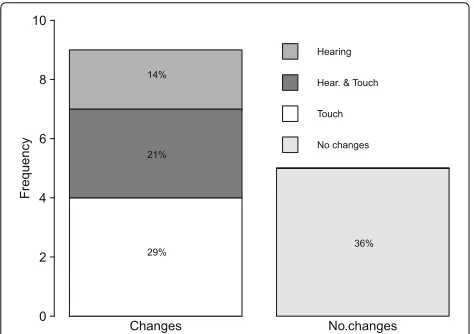
Approaches educators used to make graphical representations accessible
We asked learners about the approaches their educa-tors used to make graphical representations accessible. Among the 19 learners, 5 of them did not answer the question. Among the 14 who responded, 5, correspond-ing to 36%, answered that no approach was used, so that they did not have access to any graphical represen-tation. The other 9 respondents mentioned five differ-ent strategies used by educators. As for educators, these
Fig. 4Availability of assistant support. The figure presents the frequency and percentage of responses to the statement “I have had assistant support in all the lectures in my course”
strategies can be grouped by sensory perception. Hearing-based approaches comprise textual and verbal descrip-tion. Touch-based approaches comprise multiplan, tactile drawings, and Braille impressions.
In Fig. 5, we present the frequency of response. The most widely used sense was touch. It was used individu-ally by 4(29%) educators and in combination with hearing by 3(21%) educators. Among the touch-based approaches, tactile drawings was the most often mentioned.
Collaboration with classmates related to graphical representations
Regarding collaboration among visually impaired learn-ers and classmates in lectures that involved the use of graphical representations, 4 learners did not answer
Fig. 5Sense usage frequency. The figure presents the frequency of approaches by sensory perception their educators used to make graphical representations accessible
the question. From the 15 respondents, 7, which corre-spond to 47%, reported they were not involved in group activities and did not interact with classmates, and 8 reported to use textual descriptions, tactile representa-tions, or counted on classmate support, as shown in Fig.6. The most widely used approach was textual and verbal description together, answered by 5 respondents, which correspond to 33% of all question respondents. Class-mate help was used by 2 learners and tactile drawing by 1 learner.
Assessment
The learners were also asked about the way they were assessed in subjects that involved the use of graphical rep-resentations. As 4 learners did not answer this question, we present the results for 15 respondents in Fig.7.
Among the 15, 6(40%) were assessed regarding their conceptual knowledge about the subject. Other 5 respondents, which correspond to 33% answered they were not assessed at all. Classmate/assistant help was answered by 2 respondents. Finally, oral assess-ment and tactile drawings were assess-mentioned by 1 learner each.
Problematic topics
We asked visually impaired learners about the top-ics they consider the most challenging in the courses they have taken. The following topics were mentioned by learners: (i) Applied Math; (ii) Analytical Geometry; (iii) Linear Algebra; (iv) Discrete Math; (v) Computer Graphics; (vi) Physics; (vii) Formal Languages; (viii) Automata and Computability; (ix) Software Engineering; (x) Database; (xi) Web Technology; (xii) Calculus; (xiii) Mobile Programming; (xiv) Computer Networks; (xv)
Fig. 7Graphical representations and learner assessment. The figure presents the strategies used to assess learners in subjects that involved the use of graphical representations
Digital Circuits; (xvi) Algorithms; and (xvii) Visual Pro-gramming Languages.
The number of subjects mentioned by learners comprises a significant part of computing education programs. In courses such as Computer Science and Computing Engineering, learners mentioned theo-retical topics that form the foundation of the field (e.g., Discrete Math, Formal Languages, and Automata and Computability). In courses such as Information Systems and Systems Analysis and Development, cen-tral disciplines (Software Engineering, Database, Web Technology, Visual Programming Languages, and Mobile Programming) were mentioned by learners. This amplitude of challenges reinforces the necessity of further research and technological development effort.
Discussion
In the following subsections, we discuss the aforemen-tioned results.
Result contextualization
The results we present are related to institutions in five different Brazilian states: (i) MT—Mato Grosso, (ii) PR— Paraná, (iii) RS—Rio Grande do Sul, (iv) RJ—Rio de Janeiro, and (v) SP—Sao Paulo. While one must ana-lyze the results considering its spatial contextualization, the aforementioned five states contain about 48% of the main computing-related undergraduate courses in Brazil (Computer Science, Computer Engineering, Infor-mation Systems, and System Analysis and Development) [65]. Furthermore, 9 of the 15 best Brazilian educational institutions according to the Times Higher Education [66] are located in these states and we gathered data about 2 of them. In addition, they include four of the
five most rich Brazilian states, considering their gross domestic products [67]. Considering that, it is expected that the inclusion scenario in these institutions repre-sent part of the best scenario in educational institutions in Brazil.
Class style and material
It is well known that blackboard content is not acces-sible to visually impaired learners. Most educators used blackboards in their lectures. The most widely used strategy by educators to deliver material to learners is “delivery of material prior to lecture,” and despite being useful to allow visually impaired learners to fol-low explanations, this may result in inflexibility in the class content, which can harm the teaching and learning process.
This inflexibility may prevent free interactions between learners and educators, negatively influencing the educa-tional processes. Also, it may increase the sense of dis-tance between participants [51]. For instance, content and examples based on situations raised in class, which could increase the learner’s motivation, can hardly be applied in such an inclusive scenario.
Approaches that could be adopted to keep the black-board lecture style, without creating inflexibility would be:
• Use of smartboards: some smartboards have integrated OCR and its content can be accessed in real-time. Despite being an interesting approach, it can be expensive;
• Use of multimedia projector real-time collaborative text editors: instead of using the blackboard, educators can project documents and share them with learners using real-time collaborative text editors. The visually impaired learners would be able to access the content of the virtual “blackboard” in real time during the lecture.
Despite being useful for textual content, these approaches are not useful to graphical content, as discussed next.
Accessibility of graphical representations
According to the learners surveyed, the main challenge they faced was when graphical representations were used to convey and to discuss concepts.
These representations are inaccessible to visually impaired learners in their original format; they repre-sent concepts and knowledge that can be conveyed to learners in different formats. The two most widely used approaches, both by educators and learners, were con-verting them to textual and tactile representations. While textual representations may consider only concepts, tac-tile representations often take into account graphical aspects. We have not found any empirical study that compares the effectivity of these approaches with exper-iments. Without this information, we could consider the usage of tactile maps as a normalization pedagogical tool, since it tries to just allow visually impaired learn-ers to access graphical representations the same way sighted learners do. In other words, it does not take into account the mental model visually impaired learners cre-ate when interacting with graphical representations and how it could be represented in order to maximize their performance.
Regarding tools to make these representations acces-sible in real-time collaborative activities, such as in a classroom, there have been some recent researches that have delivered tools to support collaborative interaction between people with visual impairment and sighted peo-ple with graphical representations, some of them in real time. Model2gether [52], CCmi [68], and [48] are exam-ples of these tools.
Another aspect that represents a great challenge to inclusion, as cited by learners, is the availability of acces-sible books, as discussed next.
Accessible books
Without being able to access the same material avail-able to sighted learners, it is not possible to offer equal learning conditions to visually impaired learners. The stu-dents’ answers indicate that, in most cases, only part of the official bibliography was made available in an accessible format.
Some approaches can contribute to changing this sce-nario. To understand these approaches, it is worth noting that many books, in different fields, do not have equiva-lent digital editions. This is the case of books published before the emergence of the digital book market.
To make already published non-digital material accessi-ble to visually impaired learners, universities could have departments responsible for making material accessible. This is the case in many universities [69–71]. Using cur-rent high-speed scanning and quality OCR techniques, this is not as difficult as it used to be. This could also be a government initiative. The Brazilian government took this initiative regarding books used at lower education levels [72]. A partnership with representative societies of each field could result in a joint effort, which could be shared by public and private institutions, to produce a better
result than each institution by itself. The most recent law related to the inclusion of individuals with impairment in society [7] does not require the existence of specialized departments with the aforementioned role.
For new books, a legislation to guarantee the publica-tion of accessible edipublica-tions of every published book would ensure accessible material for the future, since publishers have electronic versions of their books. While the article 68 of the Statute of People with Disabilities (Lei Brasileira de Inclusão da Pessoa com Deficiência) [7] specifies that the government must adopt mechanisms to promote the production, edition, and distribution of accessible books, it is still not mandatory in Brazil the publication of digital versions for new books.
Institution training
The lack of training was a concern for most educators, who do not have access to knowledge related to the inclu-sion of people with visual impairment in lectures. The inclusion in such cases depends only on the educator’s ini-tiative to search for approaches and tools that can help them during the process. It is more aligned with the nor-malization conception aforementioned. In some cases, the educator does not change his/her lecture style and just counts on the help of volunteer sighted learners or assis-tants to “translate” what is being said into an accessible format. Again, the existence of departments specialized in accessibility in universities could contribute with train-ing programs to educators. Furthermore, the inclusion of accessibility-related content in graduate courses to educa-tors could also contribute to change the existing scenario. There are some initiatives to offer courses related to accessibility that can be used by educators to compensate the lack of institution training. The University of Brasilia offers an open online course on accessible materials for the Moodle that can be accessed at https://moodle.ead. unb.br. Another initiative, by the UNICAMP—University of Campinas, is dedicated to specialized educational ser-vice educators, but it is only available to invited users, at http://tnr.nied.unicamp.br/.
Base of knowledge to inclusion
An initiative that could contribute to changing the inclu-sion scenario in Brazil is establishing an electronic base of knowledge, with scientific articles and tools, related to the inclusion of visually impaired learners in comput-ing education programs. The USA, as an example, has a project funded by the government and maintained by the University of Washington, called Access Computing [73]. It is a collection of resources to include learners with impairments in the computing field.
make this inclusion possible. If a central repository with such information were available, this could contribute to changing in this scenario.
Conclusions
This work presented the results of surveys conducted with visually impaired learners and educators in computing education programs.
In addition to educators and visually impaired learn-ers, institutions and sighted students that take part in the inclusion process are important as well. This research does not present data related to these parties. While edu-cational institutions could be surveyed, we understand that information gathered by educators and learners is more faithful, since institutions are obliged to offer min-imal conditions to learners with impairments and admit the absence of these conditions could cause problems to the institutions. Regarding sighted students, there is no group or specific mean to find them. One approach to gather data about sighted students is to follow them dur-ing a course in which they have a classmate with visual impairment.
In our view, it is important to collect information about the inclusion of visually impaired learners in computing education programs to establish appropriate action plans by institutions, educators, and decision makers. We con-sider this work relevant in this context because the type of information present herein may guide and support the definition of procedures and policies to promote a more inclusive scenario.
Despite any effort by educators and institutions to pro-mote a more inclusive scenario, most learners do not feel included at all.
The results indicate that further research and tech-nological development efforts are required to produce a more inclusive scenario. A method to guide institu-tions, educators, and learners in this scenario would be of great contribution to the field. We discussed some alter-natives that could be adopted to produce this inclusive scenario.
Abbreviations
BPMN: Business process model and notation; CASE: Computer-aided software engineering; DFD: Data flow diagram; IDE: Integrated development environment; IDEF: Integrated definition methods; MER: Entity-relationship diagram; MHD: Module hierarchy diagram; MSD: Module structure diagram; MT: Mato Grosso State; OCR: Optical character recognition; PR: Paraná State; RJ: Rio de Janeiro State; RS: Rio Grande do Sul State; SBC: Brazilian Computer Society; SP: Sao Paulo State; SysML: Systems modeling language; UCS: University of Caixas do Sul; UML: Unified modeling language; UNICAMP: University of Campinas; UNICESUMAR: Maringa University Center; UNICID: University of the City of Sao Paulo; UNIP: Paulista University; UNIVAG: Várzea Grande University Center; USP: University of Sao Paulo; UTFPR: Federal University of Technology of Parana
Funding
This work received funding from the TOSHIBA Scholarship Program via the Escola Politécnica, University of Sao Paulo, grant 2014/Dr-02 (TOSHIBAEPUSP). It was also supported by Google, Research Awards for Latin America (LATAM).
Authors’ contributions
LL and AAFB designed and conducted the survey and wrote the text. LOB and EK reviewed the survey questionnaires, helped with the statistical analysis, and contributed to the final version of the text. All authors read and approved the final manuscript.
Ethics approval and consent to participate
The method used in this work was approved by the USP University Hospital Research Ethics Committee (CAAE 49264815.3.0000.0076).
Competing interests
The authors declare that they have no competing interests.
Publisher’s Note
Springer Nature remains neutral with regard to jurisdictional claims in published maps and institutional affiliations.
Author details
1Escola Politécnica, University of Sao Paulo, Prof. Luciano Gualberto Av. T3-158, 05508-010 Sao Paulo, SP, Brazil.2Sao Paulo State Technological College - Fatec, Carlos Barattino St. 908, 08773-600 Mogi das Cruzes, SP, Brazil.3The Institute of Mathematics and Statistics, University of Sao Paulo, Matao St. 1010, 05508-090 Sao Paulo, SP, Brazil.
Received: 1 April 2017 Accepted: 19 January 2018
References
1. Grue J, Johannessen LEF, Rasmussen EF (2015) Prestige rankings of chronic diseases and disabilities: a survey among professionals in the disability field. Soc Sci Med 124:180–186
2. World Health Organization (2014) Visual impairment and blindness: fact sheet. Technical Report FS282. Accessed 16 Jan 2018
3. World Health Organization (2015) Deafness and hearing loss: fact sheet. Technical Report FS300. Accessed 16 Jan 2018
4. Brazil Cartilha do Censo 2010 - pessoas com deficiência [In Portuguese].
http://www.pessoacomdeficiencia.gov.br/app/sites/default/files/ publicacoes/cartilha-censo-2010-pessoas-com-deficienciareduzido.pdf. Accessed 16 Jan 2018
5. Brazil Constituição da República Federativa do Brasil de 1988 [In Portuguese].www.planalto.gov.br/ccivil_03/constituicao/constituicao. htm. Accessed 16 Jan 2018
6. Brazil Portaria 1.679 de 2 de dezembro de 1999 [In Portuguese].http:// portal.mec.gov.br/sesu/arquivos/pdf/c1_1679.pdf. Accessed 16 Jan 2018 7. Brazil Lei 13.146 de 6 de julho 2015 - Estatuto das Pessoas com
Deficiência [In Portuguese]. www.planalto.gov.br/ccivil_03/_ato2015-2018/2015/lei/l13146.htm. Accessed 16 Jan 2018
8. Brazil Lei 9.394, de 20 de dezembro de 1996 - Lei de Diretrizes e Bases da Educação Nacional (LDB).www.planalto.gov.br/ccivil_03/leis/L9394.htm. Accessed 16 Jan 2018
9. Albino IB (2010) Acesso e permanência na Universidade Federal do Rio Grande do Norte sob o ponto de vista do docente e do estudante com deficiência [In Portuguese], Master’s thesis, Universidade Federal do Rio Grande do Norte, Natal
10. Chahini THC (2005) Os desafios do acesso e da permanência de pessoas com necessidades especiais nas instituições de educação superior de São Luís [In Portuguese]. Master’s thesis, Universidade Federal do Maranhão, São Luís
11. Cruz RL (2012) Inclusão no ensino superior: um estudo das
representações sociais dos acadêmicos com deficiência visual da UFPB [In Portuguese]. Master’s thesis, Universidade Federal da Paraíba, João Pessoa 12. Guerreiro EMBR, Almeida MA, da Silva Filho JH (2014) Avaliação da
satisfação do aluno com deficiência no ensino superior [In Portuguese]. Avaliação: Revista da Avaliação da Educação Superior 19(1):31–60 13. Negry KC (2012) Situação de deficiência: a realidade de instituições de
ensino superior do Distrito Federal à luz do atendimento prestado aos jovens estudantes com deficiência visual (cegos) [In Portuguese]. Master’s thesis, Universidade Católica de Brasília, Brasília
15. Amiralian MLTM (2002) O psicólogo e as pessoas com deficiência visual [In Portuguese]. In: Masini EFS (ed). Do Sentido, Pelos Sentidos, Para O Sentido: Sentidos Das Pessoas Com Deficiência Sensorial. Vetor Editora Pedagógica, São Paulo. pp 201–208
16. Mrech LM (1998) O que é educação inclusiva [In Portuguese]. Revista Integração 10(20):37–40
17. Wang M (1997) Atendendo alunos com necessidades especiais: equidade e acesso [In Portuguese]. In: Ainscow M, Porter G, Wang M (eds). Caminhos Para as Escolas Inclusivas. Instituto de Inovação Educacional, Lisboa. pp 49–67
18. Odom SL, Deklyen M, Jenkins JR (1984) Integrating handicapped and nonhandicapped preschoolers: developmental impact on nonhandicapped children. Except Child 51(1):41–48
19. Pastells AA (1993) La integración de alumnos deficientes en la escuela ordinaria [In Spanish]. Revista de Educación Especial, Barcelona (12):44–57 20. Sekkel MC (2003) A construção de um ambiente inclusivo na educação
infantil: relato e reflexão sobre uma experiência [In Portuguese]. Phd thesis, Universidade de São Paulo, São Paulo
21. Owen CB, Coburn S, Castor MJ (2014) Teaching modern object-oriented programming to the blind: an instructor and student experience. In: Proceedings of the 121st ASEE Annual Conference. ASEE
22. Müller K (2012) How to make unified modeling language diagrams accessible for blind students. In: Miesenberger K, KarshmerPetr A, Zagler P (eds). Computers helping people with special needs. Springer, Austria 23. Dell AG, Newton DA, Petroff JG (2016) Assistive technology in the
classroom: enhancing the school experiences of students with disabilities 3rd edn. Pearson, New York
24. Loitsch C, Weber G (2012) Viable haptic UML for blind people. In: Miesenberger K, KarshmerPetr A, Zagler P (eds). Computers helping people with special needs. Springer, Austria
25. Brookshire RG (2006) Teaching UML database modeling to visually impaired students. Issues Inf Syst 7(1):98–101
26. McMullen D, Fitzpatrick D (2009) Autonomous access to graphics for visually impaired learners. In: Proceedings of the EdTech 2009 - changing learning futures through technology, ILTA, Ireland. p 41
27. Gilkes AM, Cowens MW, Taylor LA (1996) Electronic refreshable tactile display for braille text and graphics. Google Patents. US Patent 5,580,251 28. Charles PK, Harish V, Swathi M, Deepthi CH (2012) A review on the various
techniques used for optical character recognition. Int J Eng Res Appl 2(1):659–662
29. Borodin Y, Bigham JP, Dausch G, Ramakrishnan IV (2010) More than meets the eye: a survey of screen-reader browsing strategies. In: Proceedings of the 2010 International Cross Disciplinary Conference on Web Accessibility (W4A). ACM, Raleigh. p 13
30. Cohen RF, Meacham A, Skaff J (2006) Teaching graphs to visually impaired students using an active auditory interface. ACM SIGCSE Bull 38(1):279–282. ACM
31. Connelly R (2010) Lessons and tools from teaching a blind student. J Comput Sci Coll 25(6):34–39
32. Pansanato LTE, Silva CE, Rodrigues L (2012) Uma experiência de inclusão de estudante cego na educação superior em computação [In Portuguese]. In: Proceedings of the Workshop Sobre Educação em Computação, Curitiba
33. Silva CE, Pansanato LTE, Fabri JA (2010) Ensinando diagramas UML para estudantes cegos [In Portuguese]. In: Proceedings of the 36th Latin American Informatics Conference, Asunción, Paraguay
34. Blenkhorn P, Evans DG (1998) Using speech and touch to enable blind people to access schematic diagrams. J Netw Comput Appl 21(1): 17–29
35. Iglesias R, Casado S, Gutierrez T, Barbero JI, Avizzano CA, Marcheschi S, Bergamasco M (2004) Computer graphics access for blind people through a haptic and audio virtual environment. In: Proceedings of the 3rd IEEE International Workshop on Haptic, Audio and Visual Environments and Their Applications. IEEE, Ottawa. pp 13–18 36. Lötzsch J (1994) Computer-aided access to tactile graphics for the blind.
In: Zagler W, Busby G, Roland W (eds). Computers for handicapped persons. Springer, Austria. pp 575–581
37. Oliveira F, Cowan H, Fang B, Quek F (2010) Enabling multimodal discourse for the blind. In: Proceedings of the International Conference on Multimodal Interfaces and the Workshop on Machine Learning for Multimodal Interaction. ACM, Beijing. p 18
38. Ramloll R, Yu W, Brewster S, Riedel B, Burton M, Dimigen G (2000) Constructing sonified haptic line graphs for the blind student: first steps. In: Proceedings of the Fourth International ACM Conference on Assistive Technologies. ACM, Arlington. pp 17–25
39. Yu W, Brewster S (2003) Evaluation of multimodal graphs for blind people. Univ Access Inf Soc 2(2):105–124
40. King A (2008) Accessible UML.http://www.alasdairking.me.uk/tedub/ index.htm. Accessed 16 Jan 2018
41. King A Accessible UML reference manual.http://access.uoa.gr/manuals/ tedub/Accessible%20UML%20Manual.doc. Accessed 16 Jan 2018 42. Cohen RF, Yu R, Meacham A, Skaff J (2005) PLUMB: displaying graphs to
the blind using an active auditory interface. In: Proceedings of the 7th International ACM SIGACCESS Conference on Computers and Accessibility. ACM, Baltimore. pp 182–183
43. Kennel AR (1996) Audiograf: a diagram-reader for the blind. In: Proceedings of the 2nd Annual ACM Conference on Assistive Technologies. ACM, Vancouver. pp 51–56
44. King A, Blenkhorn P, Crombie D, Dijkstra S, Evans G, Wood J (2004) Presenting UML software engineering diagrams to blind people. In: Miesenberger K, Klaus J, Zagler WL, Burger D (eds). Computers helping people with special needs. Lecture Notes in Computer Science. Springer, France. pp 522–529
45. Metatla O, Bryan-Kinns N, Stockman T (2008) Constructing relational diagrams in audio: the multiple perspective hierarchical approach. In: Proceedings of the 10th International ACM SIGACCESS Conference on Computers and Accessibility. ACM. pp 97–104
46. Petrie H, Schlieder C, Blenkhorn P, Evans G, King A, O’Neill AM, Ioannidis GT, Gallagher B, Crombie D, Mager R, et al. (2002) Tedub: a system for presenting and exploring technical drawings for blind people. In: Miesenberger K, KarshmerPetr A, Zagler P (eds). Computers helping people with special needs. Springer, Austria. pp 537–539
47. Vieritz H, Schilberg D, Jeschke S (2014) Access to UML diagrams with the HUTN. In: Automation, communication and cybernetics in science and engineering 2013/2014. Springer, Germany. pp 751–755
48. Grillo FDN, deMattos Fortes RP (2014) Accessible modeling on the web: a case study. Procedia Comput Sci 27:460–470
49. Grillo FDN, de Mattos Fortes RP, Lucrédio D (2012) Towards collaboration between sighted and visually impaired developers in the context of model-driven engineering. In: Joint Proceedings of Co-located Events at the 8th European Conference on Modelling Foundations and Applications (ECMFA 2012), Lyngby. pp 241–251
50. Luque L, Brandão LO, Tori R, Brandão AAF (2014) Are you seeing this? what is available and how can we include blind students in virtual UML learning activities. In: Proceedings of the XXV Brazilian Conference of Informatics in Education, Dourados Vol. 25. pp 204–213
51. Luque L, de Oliveira Brandão L, Tori R, Brandão AAF (2015) On the inclusion of blind people in UML e-learning activities. Braz J Inf Educ 23(02):18 52. Luque L, Brandão LO, Brandão AAF (2016) Model2gether: uma ferramenta
de apoio ao ensino e a aprendizagem de modelos por cegos [In Portuguese]. In: Anais Dos Workshops do Congresso Brasileiro de Informática na Educação, Uberlândia Vol. 5. p 257
53. Capovilla D, Mühling A, Hubwieser P (2015) How learning styles in CS can foster inclusion of visually impaired students. In: Proceedings of the 2015 International Conference on Learning and Teaching in Computing and Engineering (LaTiCE). IEEE, Taipei. pp 187–192
54. UFRGS Lista Geral da SBC [In Portuguese].https://listas.ufrgs.br/mailman/ listinfo/Sbc-l/. Accessed 16 Jan 2018
55. Forum G Cegos Programadores [In Portuguese].https://groups.google. com/forum/#!forum/cegos_programadores. Accessed 16 Jan 2018 56. Google Google Docs.https://docs.google.com. Accessed 16 Jan 2018 57. SurveyMonkey.https://pt.surveymonkey.com/. Accessed 16 Jan 2018 58. Buzzi MC, Buzzi M, Leporini B, Mori G, Penichet VMR (2010) Accessing google docs via screen reader. In: Miesenberger K, Klaus J, Zagler WL, Karshmer A (eds). Computers helping people with special needs. Springer, Austria. pp 92–99
59. Mueller J (2008) Accessibility for everybody: understanding the Section 508 accessibility requirements. Apress, USA
60. Consortium WWW, et al. Web content accessibility guidelines (WCAG) 2.0.
https://www.w3.org/TR/WCAG20/. Accessed 16 Jan 2018
62. Wentz B, Lazar J (2009) Email accessibility and social networking. Online Communities Soc Comput 5621:134–140
63. Wentz B, Lazar J (2011) Usability evaluation of email applications by blind users. J Usability Stud 6(2):75–89
64. QS QS university rankings - Latin America.http://www.topuniversities. com/university-rankings/latin-american-university-rankings/2016. Accessed 16 Jan 2018
65. MEC (2017) Sistemas eletrônico do Ministério da Cultura e Educação [In Portuguese].http://emec.mec.gov.br/emec/nova. Accessed 16 Jan 2018 66. Education TH Times higher education universities ranking.https://www.
timeshighereducation.com/. Accessed 16 Jan 2018
67. Wikipedia Lista de unidades federativas do Brasil por PIB [In Portuguese].
https://pt.wikipedia.org/wiki/
Lista_de_unidades_federativas_do_Brasil_por_PIB. Accessed 16 Jan 2018 68. Metatla O, Bryan-Kinns N, Stockman T, Martin F (2012) Supporting
cross-modal collaboration in the workplace. In: Proceedings of the 26th Annual BCS Interaction Specialist Group Conference on People and Computers. British Computer Society, Birmingham. pp 109–118 69. Disability Resource Center - University of Reno.http://www.unr.edu/drc.
Accessed 16 Jan 2018
70. Disability Resource Center - University of Kentucky.https://www.uky.edu/ DisabilityResourceCenter/. Accessed 16 Jan 2018
71. Disability Resource Centre - University of Cambridge.http://www. disability.admin.cam.ac.uk/. Accessed 16 Jan 2018
72. MEC - Ministério da Educação Projeto Livros Acessíveis [In Portuguese].
https://goo.gl/Yprw5h. Accessed 16 Jan 2018