Type of the Paper (Research Article)
A Machine Learning Solution for Data Center
Thermal Characteristics Analysis
Anastasiia Grishina 1, Marta Chinnici2,*, Ah-Lian Kor 3, Eric Rondeau 4 andJean-Philippe Georges5
,1 ENEA, R. C. Casaccia; [email protected] 2,* ENEA, R. C. Casaccia; [email protected]
3 Leeds Beckett University, Leeds, UK; [email protected]
4 Université de Lorraine, CNRS, CRAN, F-54000, Nancy, France; [email protected]
5 Université de Lorraine, CNRS, CRAN, F-54000, Nancy, France; [email protected] * Correspondence: [email protected]; Tel.: +39-349-3553790 (M.C.)
Abstract: Energy efficiency of Data Center (DC) operations heavily relies on IT and cooling systems performance. A reliable and efficient cooling system is necessary to produce a persistent flow of cold air to cool servers that are subjected to constantly increasing computational load due to the advent of IoT- enabled smart systems. Consequently, increased demand for computing power will bring about increased waste heat dissipation in data centers. In order to bring about a DC energy efficiency, it is imperative to explore the thermal characteristics analysis of an IT room (due to waste heat). This work encompasses the employment of an unsupervised machine learning modelling technique for uncovering weaknesses of the DC cooling system based on real DC monitoring thermal data. The findings of the analysis result in the identification of areas for energy efficiency improvement that will feed into DC recommendations. The methodology employed for this research includes statistical analysis of IT room thermal characteristics, and the identification of individual servers that frequently occur in the hotspot zones. A critical analysis has been conducted on available big dataset of ambient air temperature in the hot aisle of ENEA Portici CRESCO6 computing cluster. Clustering techniques have been used for hotspots localization as well as categorization of nodes based on surrounding air temperature ranges. The principles and approaches covered in this work are replicable for energy efficiency evaluation of any DC and thus, foster transferability. This work showcases applicability of best practices and guidelines in the context of a real commercial DC that transcends the set of existing metrics for DC energy efficiency assessment.
Keywords: Data Center; Thermal Characteristics Analysis; Machine Learning, Energy Efficiency, Hotspots, Clustering Technique, Unsupervised Learning
1. Introduction
Over the past decade, Data Centers (DC) have made considerable efforts to ensure energy efficiency and reliability, and the size and stability of their facilities have been upgraded because of the enormous increase in demand [1,2]. Currently, the amount of data to be processed is expanding exponentially due to the growth of the information technology (IT) industry, advent of IoT, and AI technologies. Consequently, new DC construction and smart DC management is on the rise to meet this demand. If a data center experiences system failure or outage, it becomes challenging to ensure a stable and continuous IT service provision (particularly smart businesses, social media, etc.). If such a situation occurs on a large scale, it could lead to chaos to particularly the business sector and other sectors (e.g. health, manufacturing, entertainment, etc…). In other words, a data center has emerged as a mission-critical infrastructure [30] to the survival of businesses and other smart technologies supported sectors. Therefore, it warrants a critical necessity for backup system management and uninterruptible power supply (UPS) systems so that compute system stability can be maintained even in emergency situations. DCs maintain their stability by having redundant power supply
paths, including emergency generators, UPSs, etc. IT servers require uninterruptible supplies of not only power but also cooling [3, 4]. For this purpose, in liquid cooling, central cooling systems are designed and manage to allow for chilled water supply during cooling system outages by including cooling buffer tanks for stable cooling of IT equipment. If the chillers are interrupted, the emergency power and cooling system are activated, and then the chilled water is supplied again. Consequently, the mission-critical facility management for the stable operation of DC leads to huge cost increases, and careful reviews must be performed starting from the initial planning stage [5, 6]. Considering that the number of times that such emergency situations occur during a DC life cycle is very small and IT servers tolerance to various operational thermal environments has vastly improved compared to that in the past due to the development of IT equipment, there is considerable room for reducing the operating times and capacities of chilled-water storage tanks. Specifications of every IT equipment are expressed as (but not limited to) different admissible ranges for temperature, humidity, periods of overheating before automatic power off. Additionally, maintaining healthy operational conditions is a complex task because IT devices might have different recommended specifications for operation. Undeniably, covert factors such as bypass, recirculation, hotspots and partial rack overheating could negatively affect the health of IT and power equipment that is critical for efficient DC operations. For example, in the case where an IT room is divided into cold and hot aisles, improper partitioning of the aisles may result in recirculation of hot air or cold air bypass [7]. Consequently, such emerging challenges call for the need for optimized thermal conditions within a DC facility. Thermal management involves the reduction of excess energy consumption by cooling
systems, servers’ load processing, and their internal fans. It encompasses compliance of IT facility environment to temperature requirements and standards that will inevitably result in reliability, availability, and overall improved server performance. Thermal management in a DC could be the primary contributor to IT infrastructure inefficiency due to hardware degradation and for this reason, it is necessary to disperse dissipated waste heat so that there will be an even distribution of waste heat within a premise to avoid overheating [31]. This work explores the thermal characteristics analysis of an IT room (due to waste heat) using data mining techniques for the purpose of relevant knowledge discovery. The primary goal is to use an unsupervised machine learning modelling technique to uncover weaknesses in the DC cooling system based on real DC monitoring thermal data. Analysis in this research leads to identification of areas for energy efficiency improvement that will feed into DC recommendations. The proposed methodology includes statistical analysis of IT room thermal characteristics, and identification of individual servers that frequently occur in the hotspot zones. The reliability of the analysis has been enhanced due to the availability of big dataset of ambient air temperature in the hot aisle of ENEA Portici CRESCO6 computing cluster. In brief, clustering techniques have been used for hotspots localization as well as nodes categorization based on surrounding air temperature ranges. The principles and approaches employed in this work are replicable for energy efficiency evaluation of any DC and thus, foster transferability. This work showcases applicability of best practices and guidelines in the context of a real commercial DC that transcends the typical set of existing metrics for DC energy efficiency assessment.
The remainder of the paper is organized as follows: Section 1 is dedicated to introduction; Section 2 is focuses on background and discussion of Background and Related Work; Section 3 presents the Methodology adopted for this work; Section 4 covers Results and Discussion; while Section 5 concludes the paper with future work.
2. Background and Related Work
In recent years, a small number of theoretical and practical studies have been conducted on DC thermal management to understand the cooling systems under fault conditions, including system thermal and energy performance, system distribution optimization, and simulation study. Thermal management involves the reduction of excess energy consumption by cooling systems, servers’ load
highlight the primary challenges of cooling high power density DCs [8]; recommend a list of thermal management strategies based [9]; experiment the effect of a cooling approach on PUE, using direct air with a spray system that evaporates water to cool as well as humidify incoming air [10]; investigate thermal performances of air-cooled data centers with raised and non-raised floor configurations [11] and quantification of thermos-fluid processes through performance metrics [12]; propose a thermal model for joint cooling and workload management [13] while [14] explore thermal-aware job scheduling, dynamic resource provisioning and cooling; utilise real thermal information about servers, inlet/outlet air temperature, air mover speed to create thermal and power maps to monitor the real-time status of a data center [15]. Majority of the previously listed research focuses on simulations or numerical modelling [9-14], empirical research involving R&D or small scale data center [10, 15] and thus there is a need for more empirical research involving real relevant thermal-related data for big scale data centers. Undeniably, it is tremendously beneficial to identify hotspots and air dynamics (particularly negative effects) within a DC IT room. Such useful evidence-based information will help DC operators improve their DC thermal design and ensure uninterrupted steady compute system operations. Additionally, it will be an added value if thermal management related research adheres to [16] recommended thermal management framework at varying granularity of DCs. Thermal metrics have been created by the research and enterprise DC community to facilitate DC thermal management [7]. The employment of metrics aims to reveal the underlying causes of thermal-related challenges within a DC IT room and to assess the overall thermal conditions of the room. Finally, [28] proposes a holistic data centre assessment method based on biomimicry by integrating data on energy consumption for powering and cooling ICT equipment. This research work focuses on the analysis of a DC IT room thermal characteristics analysis with machine learning techniques to uncover ways to render a more effective cooling system as well as ways to effect even distribution of server waste heat within a DC.
This work focuses on the identification of individual servers in an IT room of a DC cluster that frequently occurs in the hotspot zones applying a clustering algorithm to an available dataset with thermal characteristics of ENEA Portici CRESCO6 computing cluster. This paper represents the completion of the previous authors' work [7, 17, 18, 19, 20, 21, 31] in terms of exploring the intricacies of deploying the theoretical framework applied in a real DC. Appropriate data analytics techniques have been based on real server-level sensors data to identify potential risks caused by the possible presence of negative covert factors related to the cooling strategy. This work is based first of all on the statistical analysis of available real thermal data and to provide a complete thermal characteristic analysis through machine learning techniques. However, ML has been generally employed for VM allocation, global infrastructure management, prediction of electricity consumption and availability of renewable energy [22]. Thus far, there is work on ML for thermal characteristics assessment and weather conditions prediction but only limited work on thermal management. Typically, Computational Fluid Dynamics (CFD) techniques have been employed for the exploration of DC thermal management. Their drawbacks are high computational power and memory requirements. Therefore, the added value of this research is utilization of less power demanding techniques for thermal characteristics analysis (i.e. namely, hotspot localization).
Additionally, this paper aims to increase DC thermal awareness and provide recommendations for thermal management based on the study of thermal characteristics of DC IT room environment and IT equipment energy consumption of ENEA Portici CRESCO6 cluster using real monitored thermal data. This work exploits machine learning analysis of IT room thermal characteristics. To achieve this aim, the following research objectives are addressed:
RO.1. To identify the clustering (grouping) algorithm that is appropriate for the purpose of this research;
RO.2. To determine the criteria for features selection in cluster analysis of the thermal characteristics;
RO.4. To perform sequential clustering and interpretation of results for repeated time series clustering;
RO.5. To identify the IDs of servers that most frequently occur in clusters of colder and hotter zones;
RO.6. To provide recommendations related to the thermal management of the IT room appropriately address servers overheating resulting in local hotspots related issues.
3. Methodology
This section discusses the thermal characteristics analysis of ENEA cluster, CRESCO 6. A Machine Learning clustering technique is chosen for a more in-depth analysis of hotspots localization based on available dataset of CRESCO6 nodes temperature measurements. The drawback of this the analysis of temperature measurements is that it could not pinpoint specific nodes which cause rack hotspots. Hence, to address this gap, we have applied Machine Learning techniques for node clustering to localize hotspots. Locating hotspots in the CRESCO6 group of nodes (the term “group of nodes” stands for the DC “cluster” and note this term is not used to avoid its confusion with clusters of data) is achieved through grouping of sequential sets of nodes into clusters with higher or lower hot aisle and internal server temperatures.
3.1. Cluster and Dataset Description
were consistently monitored, and other 1-2 nodes had missing values or were turned off. The monitoring the system consisted of energy meter, power meter of CPU, RAM and the entire IT system utilization of every node, CPU temperature for both processing units of each node with thermal sensors installed inside the servers, inlet and exhaust in cold and hot aisle respectively placed in the front and rear parts of every node.
Figure 1. Period of available measurements data in May-December 2018 and January-February 2019
3.1. Data Analytics
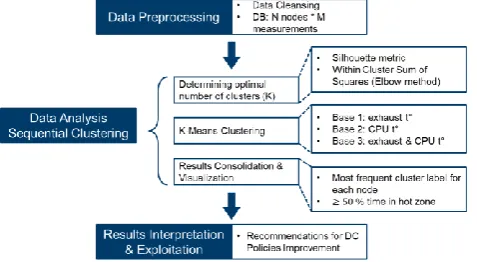
Data analytics encompasses the investigation on temperature variation in different parts of the IT room and evaluation of thermal metrics. However, the variability of thermal data and uncertainties in defining temperature thresholds for hotspots (identified via statistical analysis) has invoked a need for unsupervised learning. Therefore, a K-means clustering algorithm has been employed to address the limitations of typical statistical techniques. With Machine Learning techniques, the number of clusters is determined using two indices (Silhouette metric and Within-Cluster Sum of Squares), and available thermal characteristics (i.e. exhaust temperature, CPUs temperatures) are inputs to a clustering algorithm. Subsequently, a series of clustering results are intersected to unravel nodes (identified by IDs) that frequently fall into high-temperature areas of the cluster racks. As depicted in Figure 2, an adapted data lifecycle methodology has been employed for this work. The methodology comprises stages of data preprocessing, data analysis as well as results interpretation and exploitation in the form of recommendations for the DC.
Figure 2. Data Analytics lifecycle methodology adapted to sequential clustering based on DC thermal characteristics.
localization and applied to the dataset of CRESCO6 nodes temperature measurements. All data analytics stages represented in the Figure 2 are described in detail below.
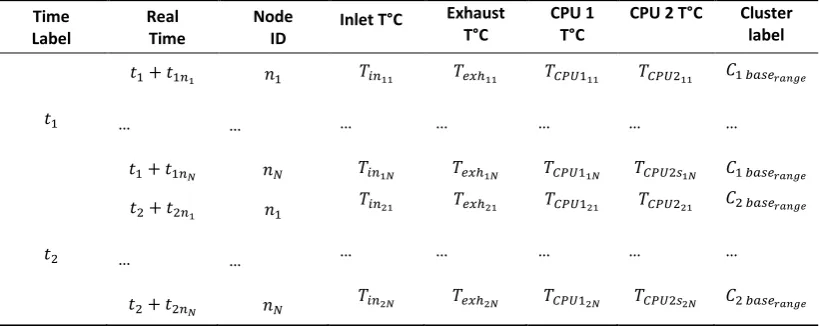
Data preprocessing step consists of data cleansing and data set organization. This data set is cleansed of zero and missing values. It is organized as shown in Table 1. This table summarizes both the results of monitoring of the overall number of nodes in CRESCO6, N. In addition, data preprocessing involves timestamps, user information formatting for further exploitation. The system is configured so that with an interval of around 15 minutes, the monitoring system records the thermal and other measured data for every node with a slight latency between each node readings. The readings result in a set of N rows with information for every node ID. As shown in Table 1, data preprocessing, includes extracting important thermal data features and removing direly incomplete or erroneous data. The Data Analysis stage includes several substages. In the Data Analysis stage, sequential clustering involves the following: determining the optimal number of clusters (done with the use of two indices); actual clustering of servers into groups with low, medium and high surrounding air temperature ranges; and consolidation of results to ascribe the most frequently occurred cluster label for each server (i.e. low, medium or high). The analysis is based on the aforementioned data preprocessing step, Table 1. Clustering is performed M times, where M is the overall number of time labels at which measurements are taken from all cluster nodes. Each new set of monitoring system readings is labelled with a time label. The exact timestamp for the extracted information is marked with for every node l. Depending on the available dataset, a number of relevant features describe the state of every node and their different combinations can be used as a basis for clustering (RO.2 will be more considered in detail in Section 3).
Time Label
Real Time
Node
ID Inlet T°C
Exhaust T°C
CPU 1 T°C
CPU 2 T°C Cluster label
𝑡1
𝑡1+ 𝑡1𝑛1
…
𝑡1+ 𝑡1𝑛𝑁
𝑛1
…
𝑛𝑁
𝑇𝑖𝑛11
…
𝑇𝑖𝑛1𝑁
𝑇𝑒𝑥ℎ11
…
𝑇𝑒𝑥ℎ1𝑁
𝑇𝐶𝑃𝑈111
…
𝑇𝐶𝑃𝑈11𝑁
𝑇𝐶𝑃𝑈211
…
𝑇𝐶𝑃𝑈2𝑠1𝑁
𝐶1 𝑏𝑎𝑠𝑒𝑟𝑎𝑛𝑔𝑒
…
𝐶1 𝑏𝑎𝑠𝑒𝑟𝑎𝑛𝑔𝑒
𝑡2
𝑡2+ 𝑡2𝑛1
…
𝑡2+ 𝑡2𝑛𝑁
𝑛1
…
𝑛𝑁
𝑇𝑖𝑛21
…
𝑇𝑖𝑛2𝑁
𝑇𝑒𝑥ℎ21
…
𝑇𝑒𝑥ℎ2𝑁
𝑇𝐶𝑃𝑈121
…
𝑇𝐶𝑃𝑈12𝑁
𝑇𝐶𝑃𝑈221
…
𝑇𝐶𝑃𝑈2𝑠2𝑁
𝐶2 𝑏𝑎𝑠𝑒𝑟𝑎𝑛𝑔𝑒
…
𝐶2 𝑏𝑎𝑠𝑒𝑟𝑎𝑛𝑔𝑒
Table 1. Dataset using for clustering analysis.
In Table 1, in the last column, base is an indicator of one of the three combinations of measurements used as the basis for clustering and corresponds to the temperature of the cluster centroid. In this work, the K-Means algorithm is chosen for clustering the nodes for several reasons (RO.1):
- The number of features used for clustering is small. Therefore, the formulated clustering problem is simple and does not require complex algorithms;
- K-Means has linear computational complexity which renders it fast to use for the type of problem in question. While the formulation of the problem is simple, it requires several thousands of repetitions of clustering for each set of N nodes. From this point of view, the speed of the algorithm becomes an influential factor;
The number of clusters K, i.e. number of ranges for Ci baserange, is an unknown parameter which is
estimated for each of the three combinations separately using two metrics: average Silhouette Coefficient and Within Cluster Sum of Squares (WCSS) metric [91], [92] (RO.3). The methods of these two indices application are shown in Appendix A. In brief, Silhouette coefficient is computed for each clustered sample and shows how much the clusters are isolated from each other or the quality of clustering. The +1 value of Silhouette index for a specific number of clusters K indicates the high density of clusters, -1 shows incorrect clustering; and 0 stands for overlapping clusters. Therefore, we focus on local maxima of this coefficient. WCSS is used in the Elbow method of determining the number of clusters and is used here to support the decision obtained from Silhouette coefficient estimation. It measures the compactness of clusters, and the optimal value of K is the one that results in
the “turning point” or an “elbow” of the WCSS(K) graph. In other words, increasing the number of clusters after reaching the elbow point does not result in significant improvement of clusters compactness. Although it could be argued that other indices could be additionally used for determining the number of clusters, the combination of the two aforementioned methods has converged on the same values of K, which is assumed to be sufficient for this current research. Once the optimal number of clusters is obtained, actual clustering is performed for the chosen bases. For every cluster base, we further examine how frequently every node is assigned to each cluster and deduce the final cluster label as one of Cbaserange and corresponding sets of nodes as Nbaserange. Subsequently, sets of nodes in the hot range for every cluster base are intersected to unravel nodes that
are clustered to be in “danger” or hot zone with the highest frequency by three clustering algorithms:
Nhot= ⋂bases{Nbasehot range} (RO.4). The next section will discuss results of this clustering procedure and list the nodes that fall in the hot zone.
4. Results and Discussions
High-granularity Analysis of this work has considered temperature ranges of the surrounding air of individual servers to identify and localize frequently overheated servers. A machine learning
technique, K-Means clustering, has been applied to sequential sets of thermal measurements for all the cluster servers. To reiterate, before clustering, the number of possible clusters has been evaluated with
the use of two methods: Within-Cluster Sum of Squares and Silhouette index. Sequential clustering has been performed several times with different combinations of measured data. For every combination of
measured thermal data, the results of servers clustering into cold, medium and hot temperature ranges have been further analyzed to calculate the frequency of occurrences of each node in each cluster and
determine their final frequency label (i.e. cluster label or temperature range). These labels are further intersected for labels obtained with different bases. Sequential clustering is further performed for each set of N=216 samples based on three combinations of available thermal data: exhaust (base 1), CPU
(base 2), exhaust and CPU temperature measurements (base 3) (RO.2). The full dataset consists of M=15569 sets of temperature monitoring data where each set consists of 216 node samples with data
from sensors installed in different locations: in the front (inlet), rear (exhaust) of every node and two sensors inside each node (CPU temperature). The optimal number of clusters depends on the base
chosen for clustering. Two metrics are computed for random sets to be clustered. Their visualization can be found in Appendix A. Identified optimal number of clusters K is 3, 5 and 3 for bases 1-3
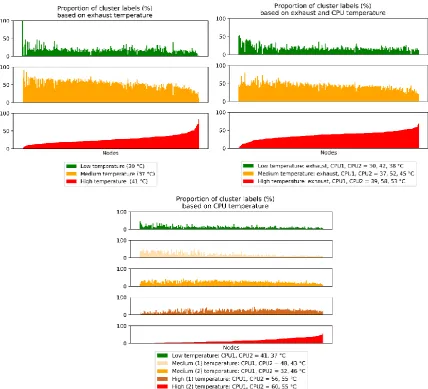
Figure 2. Proportion of nodes clustered into different temperature ranges based on (a) Exhaust temperature, (b) Exhaust and CPU temperature, (c) CPU temperature
During sequential clustering, each node has been labelled with a certain temperature range cluster.
Since clustering is repeated for each set of measurements grouped by time label, every node is clustered several times and tagged with different labels while the algorithm is in progress (RO.4).
Figure. 2 (a-c) shows the frequency of occurrence of every node in a particular cluster based on
available measurements and clustering algorithm. This information indirectly implies “duration” of a
particular node exists in a certain temperature range (see legend in Figure 2 (a-c)). Here, the majority of
the nodes frequently occur in the medium temperature range for all cluster bases. However, some nodes remain in the hot range for more than 50% of clustering cases. When nodes remain in the hot
range for a prolonged period or frequently fall in this range, it implies that they are overheated. Consequently, this brings about hardware degradation where the nodes have reduced reliability and
accessibility as they automatically switch to lower power mode when overheated. Therefore, we continue with the analysis to identify the actual node IDs that have most frequently been clustered
within the hot ranges. Table 2 provides an insight into the ratio of nodes with the highest frequency of occurrences in cold, medium or hot range (RO.5). Depending on the cluster base, 50 to 86% of all nodes
clustering, we have taken the intersection of nodes clustered into cold, medium and hot ranges. Only one node (or 0.5% of all nodes) has been clustered in the cold range for all three bases algorithms; the
medium-range has the highest intersection range while 8% (or 18 nodes) are captured in the hot range. The principle result of this analysis is the identification of the hot range node IDs, and this could be exploited by DC operators to improve thermal conditions in the cluster IT room. Possible solutions
could comprise nodes localization in the room, upgrading the cooling system to directional cooling with pumps that could push cold air to the hottest nodes in addition to existing natural convection
approach, and improving load scheduling to avoid overloading and overheating of identified nodes.
𝑵𝒆𝒙𝒉𝒄𝒐𝒍𝒅 𝑵𝒆𝒙𝒉𝒎𝒆𝒅 𝑵𝒆𝒙𝒉𝒉𝒐𝒕
Ratio, % 2.8 86.0 11.2
𝑵𝑪𝑷𝑼𝒄𝒐𝒍𝒅 𝑵𝑪𝑷𝑼𝒎𝒆𝒅𝟏 𝑵𝑪𝑷𝑼𝒎𝒆𝒅𝟐 𝑵𝒆𝒙𝒉𝒉𝒐𝒕𝟏 𝑵𝒆𝒙𝒉𝒉𝒐𝒕𝟐
Ratio, % 4.2 20.0 28.4 31.2 16.2
𝑵𝒆𝒙𝒉_𝑪𝑷𝑼𝒄𝒐𝒍𝒅 𝑵𝒆𝒙𝒉_𝑪𝑷𝑼𝒎𝒆𝒅 𝑵𝒆𝒙𝒉_𝑪𝑷𝑼𝒉𝒐𝒕
Ratio, % 2.0 63.0 35.0
𝑵𝒄𝒐𝒍𝒅 𝑵𝒎𝒆𝒅 𝑵𝒉𝒐𝒕
Ratio, % 0.5 40.0 8.0
Hot Range
Node ID
- -
30, 31, 32, 45, 46, 48, 68,
79, 94, 96, 105, 117, 118,
120, 182, 183, 189, 198
Table 2. . Ratio of cluster sizes and intersection of node labels from three bases.
The present work has contributed to thermal characteristics analysis of the DC cluster addressing an issue of hotspots. It has two positive effects in terms of sustainability. Firstly, being a thermal design pitfall, hotspots impose a risk of local overheating and deterioration of servers exposed to high temperature for prolonged periods. In this regard, localization of hotspots is crucial for better overview and control of the IT room temperature distribution. It provides a direction of future thermal management improvements that would mitigate the mentioned risk. Secondly, a clustering technique used in this phase requires less computational resources than computational fluid dynamics modelling and/or simulations performed on existing simulation packages. Such models provide an overview of the entire IT room ambient temperature distribution, whereas racks and their immediate proximity limit the area of interest. Therefore, with less computational power (and thus energy consumption) analysis techniques of this phase have brought about sufficient information to incentivize improvement of thermal conditions in data centers. Finally, the results infer that the majority of the servers operated in the medium and hot temperature ranges. Given that 8% of all cluster servers have been labelled as most frequently hot range nodes, a list of recommendations is suggested below to address the issue of hotspots (RO.6).
The proposed methodology for IT room thermal characteristics assessment of an air-cooled DC cluster (located in the region where free air cooling is unavailable) comprises:
- Locate nodes by identified hot range IDs and find possible underlying patterns in overheated nodes (e.g. position in the rack, and proximity to the PDUs);
- Tune load sharing so that these ‘hot’ nodes are not overloaded in the future; - Add directional cooling, for example, spot cooling;
4. Conclusion
Analysis of IT and cooling systems is necessary for the investigation of DC operations-related energy efficiency. A reliable cooling system is essential to produce a persistent flow of cold air to cool the servers due to increasing demand on computational load. Energy efficiency has been addressed in this work from the point of thermal characteristics analysis of an IT room. In particular, a machine learning technique applied to a real DC monitoring data has resulted in the identification of areas for energy efficiency improvement that feed into appropriate DC recommendations. The research methodology discussed in this paper, includes statistical analysis of IT room thermal characteristics, thermal metrics evaluation. and the identification of individual servers that frequently occur in the hotspot zones (using a machine learning algorithm). Clustering techniques are used for effective hotspots localization as well as categorization of nodes based on surrounding air temperature ranges. This methodology has been applied to available big dataset with thermal characteristics of ENEA Portici CRESCO6 computing cluster. The concepts covered in this work are useful for energy efficiency evaluation of any DC and ensures a high degree of transferability. This work showcases applicability of best practices and guidelines to a real DC and goes beyond the set of existing metrics for DC energy efficiency assessment.
Acknowledgments: In this section you can acknowledge any support given which is not covered by the author contribution or funding sections. This may include administrative and technical support, or donations in kind (e.g., materials used for experiments). EMJMD PERCCOM Project [29]. Moreover, the authors would like to express their gratitude to the research HPC group at the ENEA-R.C. Portici for the useful advice on modelling and control of ENEA-Data Center.
Appendix A
A number of clusters could be determined employing several approaches that are currently used widely by data scientists. However, none of them is considered accurate as they merely provide an approximate value. This work utilizes two methods: Within Cluster Sum of Squares (WCSS) or an elbow method, and average Silhouette Index. These indices are computed for a range
of cluster numbers K and an optimal value is then chosen based on the indices’ values. WCSS is a measure of the cluster’s compactness, and it calculates as follows:
𝑊𝐶𝑆𝑆(𝐾) = ∑ ∑ ‖𝑥 − 𝜇𝑗‖
2
𝑥∈𝐶𝑗 𝐾
𝑗=1
, (1)
Where K is the number of clusters, C is a set of clusters (C1, C2, …Cj), is the cluster, and µj denotes a
particular cluster sample mean. WCSS should be minimized and, in practice, an optimal value is a turning point of the graph where the rate of WCSS decrease slows down or an elbow of the graph. The method is based on the idea that increasing the number of clusters after the turning point or an elbow is not meaningful since WCSS decreases only slightly and the positive impact of every next is low. In the Average Silhouette method, a Silhouette index is computed for every data point (or every member of every cluster) and then is averaged over all data points. It estimates consistency of the data within clusters and should be maximized for better separation of the clusters. The Silhouette index is calculated for every data point as follows:
𝑠(𝑖) = 𝑏(𝑖) − 𝑎(𝑖)
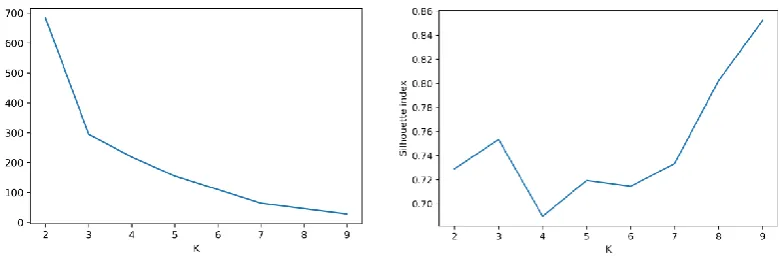
Where, a is the mean intra cluster distance (i.e. mean distance between a data point and all other points in the same cluster), while b is the mean nearest cluster distance (i.e. distance between a sample and all other points in the next nearest cluster). Example of these indices utilization is shown in Figure 3. for one step of sequential clustering based on the exhaust air temperature. The optimal elbow point of WCSS is =3 and the same for Silhouette index local maximum.
Figure 3. a) WCSS estimation for clustering based on exhaust temperature; b) Average Silhouette Index estimation for clustering based on exhaust temperature.
References
1. Hashem, I.A.T., Chang, V., Anuar, N.B., Adewole, K., Yaqoob, I.,Gani, A., et al. The role of big data in smart city. International Journal of Information Management 2016; 36(5):748–758.
2. Zhang, K.; Zhang, Y.; Liu, J.; Niu, X. Recent advancements on thermal management and evaluation for data centers. Appl. Therm. Eng. 2018, 142, 215–231.
3. Nadjahi, C.; Louahlia, H.; Lemasson, S. A review of thermal management and innovative cooling strategies for data center. Sustain. Comput. Inf. Syst. 2018, 19, 14–28.
4. ASHRAE, Data Center Power Equipment Thermal Guidelines and Best Practices. Tech. Rep; 2016.
5. Hartmann, B.; Farkas, C. Energy efficient data centre infrastructure—Development of a power loss model.
Energy Build. 2016, 127, 692–699.
6. He, Z.; Ding, T.; Liu, Y.; Li, Z. Analysis of a district heating system using waste heat in a distributed cooling data center. Appl. Therm. Eng. 2018, 141, 1131–1140.
7. Capozzoli, A., Serale, G., Liuzzo, L., Chinnici, M.., Thermal Metrics for Data Centers: A Critical Review.
Energy Procedia, 2014; 62:391–400.
8. Bash, C.E., Patel, C.D., Sharma, R.K.. Efficient thermal management of data centers—immediate and long-term research needs. HVAC&R Research 2003;9(2):137–152.
9. Zhang, K., Zhang, Y., Liu, J., Niu, X.. Recent advancements on thermal management and evaluation for data centers. Applied Thermal Engineering 2018;142:215 – 231.
10. Fredriksson, S., Gustafsson, J., Olsson, D., Sarkinen, J., Beresford, A., Käufeler, M., et al. Integrated thermal management of a 150kw pilot open compute project style data center. In: 2019 IEEE 17th International Conference on Industrial Informatics (INDIN) 2019,vo.l, p. 1443–1450.
11. Srinarayana, N., Fakhim, B., Behnia, M., Armfield, S.W.., Thermal performance of an air-cooled data center with raised floor and non-raised-floor configurations. Heat Transfer Engineering 2014;35(4):384–397. 12. Schmidt, R.R., Cruz, E.E., Iyengar, M.. Challenges of data center thermal management. IBM Journal of
Research and Development 2005;49(4.5):709–723.
13. Mirhoseini Nejad, S., Moazamigoodarzi, H., Badawy, G., Down, D.G.. Joint data center cooling and workload management: A thermal-aware approach. Future Generation Computer Systems 2020; 104:174-186. 040.
14. Fang, Q., Wang, J., Gong, Q., Song, M.. Thermal-aware energy management of an hpc data center via two-time-scale control. IEEE Transactions on Industrial Informatics 2017;13(5):2260–2269.
16. Sharma, R.K., Bash, C.E., Patel, C.D., Friedrich, R.J., Chase, J.S.. Balance of power: dynamic thermal management for internet data centers. IEEE Internet Computing 2005;9(1):42–49.
17. Capozzoli, A., Chinnici, M., Perino, M., Serale, G.. Review on performance metrics for energy efficiency in data center: The role of thermal management. Lecture Notes in Computer Science (including subseries Lecture Notes in Artificial Intelligence and Lecture Notes in Bioinformatics) 2015;8945:135–151.
18. Grishina, A., Chinnici, M., De Chiara, D., Guarnieri, G., Kor, A.L., Rondeau, E., et al. DC Energy Data Measurement and Analysis for Productivity and Waste Energy Assessment. In: 2018 IEEE International
19. Conference on Computational Science and Engineering (CSE). Bucharest, Romania: IEEE. ISBN 978-1-5386-7649-3; 2018, p. 1– 11.
20. Grishina, A., Chinnici, M., De Chiara, D., Rondeau, E., Kor, A.L.. Energy-Oriented Analysis of HPC Cluster Queues: Emerging Metrics for Sustainable Data Center. Applied ph ed. Dubrovnik, Croatia: Springer; 2019, p. 286–300.
21. Grishina, A., Chinnici, M., Kor, A.L., Rondeau, E., Georges, J.P., De Chiara, D.. Data Center for Smart Cities: Energy and Sustainability Issue. Chapter book In: Pop, F., editor. Big Data Platforms and Applications - Case Studies, Methods, Techniques, and Performance Evaluation; Springer; 2020.
22. Athavale, Jayati, Minami Yoda, and Yogendra Joshi., Comparison of data driven modeling approaches for temperature prediction in data centers, International Journal of Heat and Mass Transfer, 135 (2019): 1039-1052. 23. L. Kaufman and P. J. Rousseeuw, Finding Groups in Data: An Introduction to Cluster Analysis. Hoboken,
NJ, USA: John Wiley & Sons, Inc., 1990.
24. A. Kassambara, Determining The Optimal Number Of Clusters: 3 Must Know Methods, [Online]. Available:https://www.datanovia.com/en/lessons/determining-the-optimal-number-of-clusters-3-must-kn ow-methods/. [Accessed: 06-May-2019].
25. Chinnici, M., Capozzoli, A., Serale, G.. Measuring energy efficiency in data centers. In: Pervasive Computing: Next Generation Platforms for Intelligent Data Collection; chap. 10. ISBN 9780128037027; 2016, p. 299–351.
26. Quintiliani, A., Chinnici, M., De Chiara, D.. Understanding workload-related metrics for energy efficiency in Data Center. In: 2016 20th International Conference on System Theory, Control and Computing (ICSTCC). Sinaia, Romania: IEEE. ISBN 978-1- 5090-2720-0; 2016, p. 830–837.
27. Chinnici, M., Chiara, D.D., Quintiliani, A. Data Center, a Cyber-Physical System: Improving Energy Efficiency Through the Power Management. In: DASC/PiCom/DataCom/CyberSciTech. Orlando, FL, USA: IEEE. ISBN 978-1-5386-1956-8; 2017, p. 269– 272.
28.
S. Kubler, E. Rondeau, J.P Georges, P. Lembi Mutua, M. Chinnici, Benefit-Cost model for
comparing data center performance from a Biomimicry perspective, Journal of Cleaner
Production, Vol 231, 817-834, 10 Sept 2019.
29.
A.L. Kor, E. Rondeau, K. Andersson, J. Porras, J.P. Georges, Education in Green ICT and Control
of Smart Systems: A First Hand Experience from the International PERCCOM Masters
Programme, 12th Symposium on Advances in Control Education (ACE 2019), 7-9 July 2019,
Philadelphia, USA.
30. https://www.datacenterknowledge.com/industry-perspectives/critical-look-mission-critical-infrastructure