R E S E A R C H A R T I C L E
Open Access
The influence of the internet for
pedagogical innovation: using twitter to
promote online collaborative learning
Maite Fernández-Ferrer
*and Elena Cano
** Correspondence:
[email protected]; Departament de Didàctica i Organització Educativa, Universitat de Barcelona, Passeig de la Vall d’Hebron, 171, 08035 Barcelona, Spain
Abstract
This article analyses a practice of formative peer-assessment based on an experience in university teaching innovation. From a review of the literature on feedback for self-regulation, the traits of formative assessment practices are determined and a task and the assessment criteria are designed in a consistent way with these traits. After the application of the experience, the results are discussed in terms of students’ involvement; activity performance of said experience and of the whole subject; motivation and self-perception of learning and of the competency-based development of the students. The results show positive effects on the involvement, motivation and learning perception but not on performance improvement, suggesting that future research should address the effects of self-regulating feedback on the estimated learning from objective measurements and should expand the studies of the effects of these practices on the immediate and future self-regulating capacity.
Keywords:Feedback, Formative assessment, Higher education, Self-regulation, Innovation
Introduction
Feedback, a key component of formative assessment
Providing feedback is one of the most powerful educational strategies that is connected with student success (Boud, 2000; Nicol, Thomson, & Breslin, 2014). The feedback can be provided both by teachers and students. Even if it is true that the research assures
that teacher’s feedback tends to be more accurate and provides more information,
studies show that peer feedback has unique attributes like, for example, collaborative learning and increasing students’self regulation competencies (Boekaerts, Pintrich, & Zeidner, 2000; Dippold, 2009; Van Gennip, Segers, & Tillema, 2010).
Students who participate in collaborative learning processes co-build their knowledge from interactions related to the exchange of ideas and opinions, to the sharing of rele-vant information and/or to providing this feedback between peers (Strijbos, Narciss, & Dunnebier, 2010; Ware & O’Dowd, 2008). This type of learning develops the commu-nicative competencies of students and the social consciousness to engage in the dis-course of knowledge building, to negotiate the meanings of ideas and to generate criteria for the assessment and resolution of different situations (Scardamalia, 2002; Stahl, Koshmann, & Suthers, 2006). Peer-feedback or peer review is a form of formative
assessment where students can provide feedback, including warnings or suggestions to improve their work. In this sense, this kind of feedback can have benefits in terms of improving the self-regulation of learning (Shute, 2008), since it makes students meet the assessment criteria, to take ownership of them, and to implement and com-municate their point of view, whereby a meta-cognitive and personal reflection process occurs.
This is self-formative assessment: to reflect on your own work and to know or have a narrow perception of what is right and what needs to be improved upon (Boud, Lawson, & Thompson, 2013). It is the ability to criticize how something was done, the ability to know the mistakes and to use the next time more of what worked and less of what did not work. It is an assessment that allows asking about what has been done (work) and about how good it has been done (performance). Self-regulation can be described as a process that helps students structure their learning activities through performing the ap-propriate cognitive, affective and behavioural adjustments (Boekaerts, 1999; Karoly, 1993).
Information and communication technologies in the processes of feedback
In this context of formative assessment, and in particular in a peer feedback context, the development and implementation of information and communication technolo-gies (ICTs) have generated an added value (IEA, 2013). The increased accessibility to technology provides opportunities to develop learning experiences and motivators assess-ment (Osborne & Dillon, 2007). In this regard, in recent years, ICT has been introduced within the classroom to provide and improve student self-directed and collaborative learning (Dillenbourg & Hong, 2008; Jonassen, Howland, Marra, & Crismond, 2008; Shewbridge, Ikeda, & Schleicher, 2006). It is important to consider approaches for more open and participatory learning through basically applying and adapting the existing tech-nologies and social networks such as weblogs (blogs), wikis or other popular social net-works like Facebook or Twitter. In this context, these new technologies in recent years have been characterized by placing the student at the centre of the process of teaching and learning and have enhanced students’competencies (Friesen & Lowe, 2012).
Using twitter
Twitter, a technology within Web 2.0, is considered a microblogging service with social networking features. A microblog is a service that allows users to write brief text up-dates (140 characters in the case of Twitter) from mobile devices or personal com-puters to publish them on the Web (Oulasvirta, Lehtonen, Kurvinen, & Raento, 2009). Individual participants in Twitter create their personal and unique networks in which learning occurs (Veletsianos, 2012).
Recently one of the uses that is being given to this new technology is related with the opportunities offered by Web 2.0 to enhance the interactivity between students in learning environments and to promote talks between them (Gao, Luo, & Zhang, 2012). The availability of this microblog platform (Twitter), as Luo and Gao (2014) call it, al-lows students to become immediately involved so it can become an ideal environment to enhance the feedback between learners.
professionals claimed that more than 35 % of them, from 1,372 participants, used this social media (Faculty Focus, 2010).
In this context, despite the fact that research regarding Twitter is at an early stage, there is a significant number of studies that can help us understand the different pos-sible activities of the university in this kind of platform (Veletsianos, 2012). Ebner, Lienhardt, Rohs, and Meyer (2010), for example, found that students could use Twit-ter to ask questions, give opinions, exchange ideas, share resources or reflect. At the same time, Dunlap and Lowenthal (2009) found that the fact of incorporating their students to Twitter allowed them to be part of virtual communities and to interact with other professionals and gain professional exposure. In any case, it is true that sometimes students do not feel comfortable or at ease with Twitter and they do not seem to be willing to use these informal tools as the sole teaching tool for learning (Manca & Ranierit, 2013).
Methodology
The work presented here is part of the project“Design, implementation and assessment
of proposals for sustainable feedforward” (reference REDICE2014-966) funded by the Intitut de Ciències de l’Educació (ICE) of the Universitat de Barcelona (UB). This study is intended to design and implement feedforward practices in different degrees and in different Spanish universities involved in the project, with the aim to find out if these practices can improve the performance in the activity assessed under feedforward methods and in the subject as a whole and, secondly, to know the perception of stu-dents and their teachers on this type of practice. This article specifically presents one of these experiences carried out in the compulsory subject on the Organization and Management of Educational Institutions of the second year of the degree in pedagogy at the University of Barcelona (UB).
This subject has incorporated the use of Twitter as a learning activity. The aim has been that students analyse the different key elements of the subject, as well as to in-crease the performance in this subject, the motivation and the perceived competency development as well as the ability to assess their peers. Therefore, a process of peer re-view has been incorporated so that students have provided, using a form made with Google Forms, regular feedback to their peers about the quality of their tweets and of the resources or materials that have been linked to them.
In this context, this paper aims to examine:
How have students been involved in the experience? What is the type of tweets made by students?
What role has feedback played in improving students’academic performance? How have students used the information received through the feedback from
their peers?
Are students satisfied with this experience which incorporates the use of Twitter and peer review?
The research results of this study arise from the use of various instruments to collect information:
The satisfaction survey of students The satisfaction survey of teachers The pattern of analysis of feedback
The responses from the peer review Google Drive form
Specifically in this article, the analysis of the results of the satisfaction surveys of stu-dents and of the responses from the peer review Google Drive form are presented in this methodology section.
Results
How have students been involved with the experience?
Regarding the participation of students in the experience of Twitter, finally from the 69 students enrolled in the course, 62 have created a username in this online tool and have begun the activity. Despite this, it is true that in relation to peer review in some cases, student engagement has not been so satisfactory. As we can see in Fig. 1 presented herewith, students have assessed their peers in 90.3 % of cases in the first three issues of the subject. However, in the last issue, perhaps due to time constraints and other factors related to the end of the semester period (with tests and assignments to
de-liver in other subjects), students’ participation in peer feedback has decreased
sig-nificantly (67.7 %).
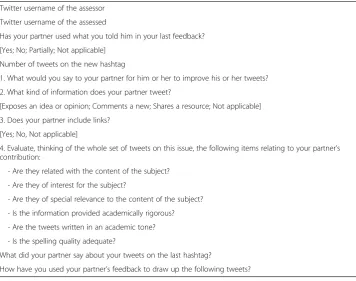
Table 1Google Drive list of questions administered for peer review
Twitter username of the assessor
Twitter username of the assessed
Has your partner used what you told him in your last feedback?
[Yes; No; Partially; Not applicable]
Number of tweets on the new hashtag
1. What would you say to your partner for him or her to improve his or her tweets?
2. What kind of information does your partner tweet?
[Exposes an idea or opinion; Comments a new; Shares a resource; Not applicable]
3. Does your partner include links?
[Yes; No, Not applicable]
4. Evaluate, thinking of the whole set of tweets on this issue, the following items relating to your partner’s contribution:
- Are they related with the content of the subject?
- Are they of interest for the subject?
- Are they of special relevance to the content of the subject?
- Is the information provided academically rigorous?
- Are the tweets written in an academic tone?
- Is the spelling quality adequate?
What did your partner say about your tweets on the last hashtag?
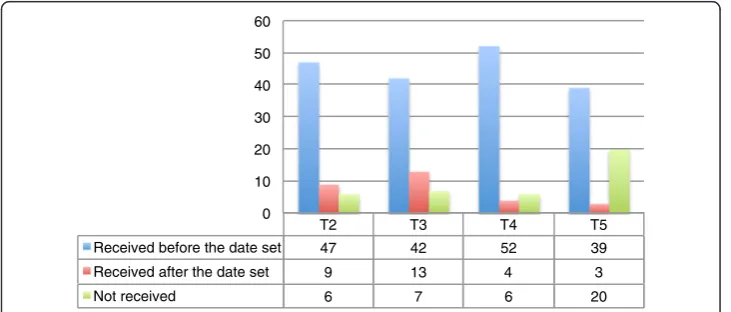
On the other hand, students, in many cases, have not sent their feedback on time. In the following figure, for example, we can see that in the second issue peers provided much of the feedback later. However, there was a great improvement in issues 3 and 4 (although in issue 4, it has already been seen that many students have not given any peer feedback because of the reasons already outlined) Fig. 2.
Part of the involvement of the students can be analysed from the established
interac-tions between them. These interacinterac-tions have been analysed through the Replies, Likes
and Retweetsgiven to the Tweets of their colleagues. Figure 3 shows the level of these interactions, which does not indicate a great deal of participation regardless of the de-mands of the subject:
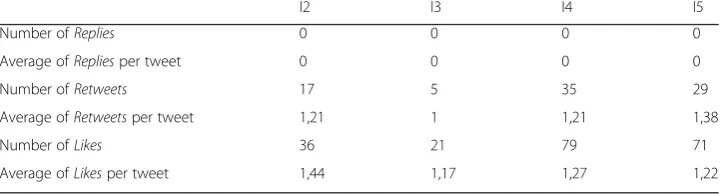
As shown in the figure presented, the total number of interactions among the partici-pants of this experience has not been very high. The table below shows the specific data about it Table 2:
First of all, the number of Replies to a tweet (which is a possibility that Twitter al-lows) has been nil. Secondly, relating to the number ofRetweets, that is the number of times students repeat the content of their peers to also share it with their followers, an increase is observed. They began as few given that issues 2 and 3 generated 17 and 5
Retweetsrespectively, but they increased considerably in issues 4 and 5, with 35 and 29 90,30%
90,30%
90,30%
67,70% Issue 2
Issue 3
Issue 4
Issue 5
Fig. 1Student participation in peer review
T2 T3 T4 T5
Received before the date set 47 42 52 39
Received after the date set 9 13 4 3
Not received 6 7 6 20
0 10 20 30 40 50 60
Retweets. It is also important to take into account that the average of these Retweets
per tweet oscillates poorly in a range from 1 (the third issue) and 1.38 (in the last
issue). This means that if students have used the possibility to make a Retweet, this
has been done practically on a single occasion. Finally, with regard to the number of Likes, which is another way for students to interact and to show interest in the contributions of their partners, this has been the largest element of the experience.
Likes started being 36 and 21 in the first two issues and ended being 79 and 71 in
the last ones. Specifically, the average of these Likes per tweet has been between
1.17 and 1.44, that is, somewhat higher than the average of Retweets but equally
low.
What is the type of tweets made by students?
Firstly, it is important to analyse the increase in the number of tweets as the experience has progressed over time. As it can be seen in the figure below, if at first an average of 2.9 Twitter contributions were made at a certain time of the experience, this number increased to 5.6, specifically during issue 4 where the subject content was longer and broader. In the last issue, the number of tweets decreased again perhaps because of the reasons already outlined Fig. 4.
0 10 20 30 40 50 60 70 80 90
T2 T3 T4 T5
Number of Replies Number of Retweets Number of Likes
Fig. 3Evolution of total interactions established among the students participating in the experience
Table 2Analysis of the interaction among students from the experience of Twitter:Answers,
RetweetsandLikesgiven on the different issues of the subject
I2 I3 I4 I5
Number ofReplies 0 0 0 0
Average ofRepliesper tweet 0 0 0 0
Number ofRetweets 17 5 35 29
Average ofRetweetsper tweet 1,21 1 1,21 1,38
Number ofLikes 36 21 79 71
Regarding the quality of the spelling of the tweets, students have perceived that it has been very good from the very beginning, and during the course this perception has even increased Fig. 5.
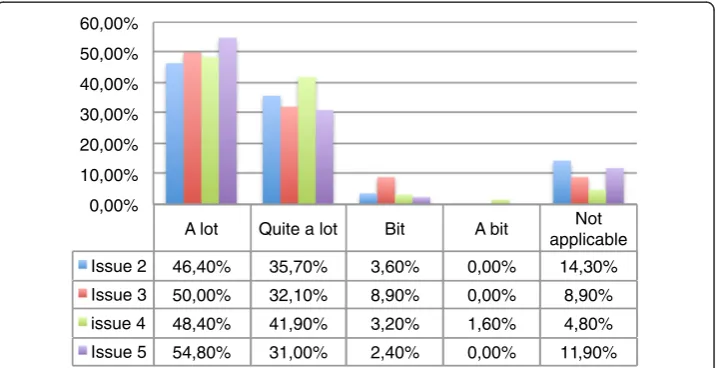
The academic rigor of the tweets of the students has not been highly valued by them during the first weeks of the semester, but over time, and after the feedback that stu-dents had received from their peers, it can be affirmed that there has been a significant change in this perception going from 14.30 % in issue 2 to 40.50 % in the last issue, number 5 Fig. 6.
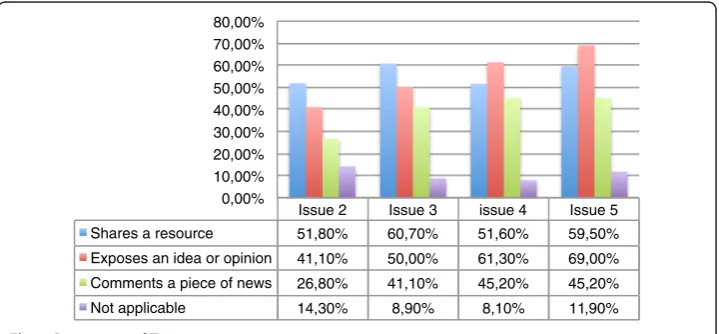
In this experience, students have performed an average of 3.9 tweets per issue and in the first two issues, the content was to provide some kind of resources while in the last two they tried, basically, to expose any idea or opinion, being sometimes accompanied by links as can be seen in Figs. 7 and 8 below.
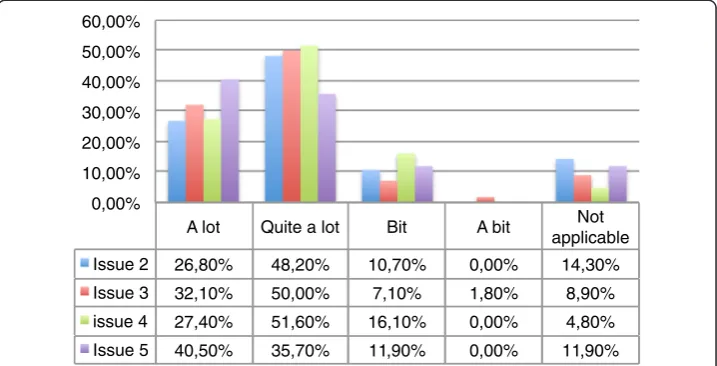
The relevance of tweets has been an element that has not been rated as positively as others in the context of this experience. The greatest contributions of the students about this topic are in ‘quite a lot’and not so many have opted for ‘a lot’ (26.80 %).
2,9
3
5,6
4,2 Issue 2
Issue 3
Issue 4
Issue 5
Fig. 4Evolution of the number of tweets during the subject
A lot Quite a lot Bit A bit Not
applicable
Issue 2 46,40% 35,70% 3,60% 0,00% 14,30%
Issue 3 50,00% 32,10% 8,90% 0,00% 8,90%
issue 4 48,40% 41,90% 3,20% 1,60% 4,80%
Issue 5 54,80% 31,00% 2,40% 0,00% 11,90%
0,00% 10,00% 20,00% 30,00% 40,00% 50,00% 60,00%
Although it is true that these ratings have increased along the semester (40.50 %). It is also interesting to note that in the last issue valuations have declined with respect to the relevance of the tweets since 11.90 % of the students stated that these were irrele-vant against 10.70 % of students who stated the same at the beginning of the experi-ence. Therefore, in this case, the peer assessment received seems to have had no impact Fig. 9.
Regarding the interest in tweets, this has been a highly valued element from the beginning (41.10 %) to the end (38.10 %) with no major differences during the se-mester. It is still important to highlight the certain evolution of students who con-sidered as rather uninteresting the contributions on Twitter for the subject at baseline (8.90 %) compared to only 2.40 % who considered the same at the end of the experience Fig. 10.
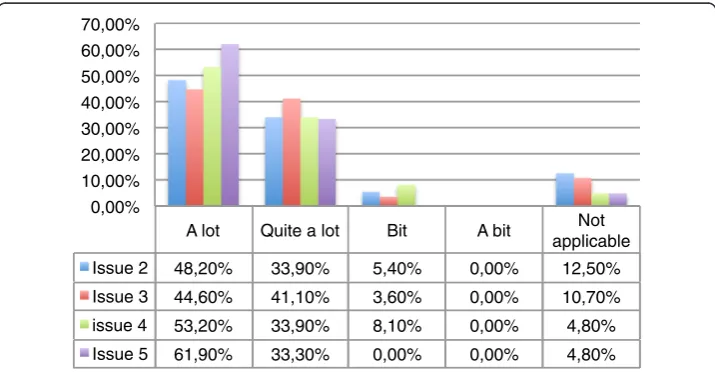
Finally, with respect to the linking between the contributions on Twitter and the con-tent of the subject, this has been an item tht is also highly valued by all students. Although it is true that there has also been an evolution from the beginning with issue 2 (48.20 %) to the end with issue 5 (61.90 %), which could be due to the peer feedback
A lot Quite a lot Bit A bit Not
applicable
Issue 2 14,30% 55,40% 12,50% 3,60% 14,30%
Issue 3 28,60% 50,00% 12,50% 0,00% 8,90%
issue 4 30,60% 43,50% 19,40% 1,60% 4,80%
Issue 5 40,50% 35,70% 11,90% 0,00% 11,90%
0,00% 10,00% 20,00% 30,00% 40,00% 50,00% 60,00%
Fig. 6Evolution of students’perception of the academic quality of tweets during the semester
Issue 2 Issue 3 issue 4 Issue 5
Shares a resource 51,80% 60,70% 51,60% 59,50%
Exposes an idea or opinion 41,10% 50,00% 61,30% 69,00%
Comments a piece of news 26,80% 41,10% 45,20% 45,20%
Not applicable 14,30% 8,90% 8,10% 11,90%
0,00% 10,00% 20,00% 30,00% 40,00% 50,00% 60,00% 70,00% 80,00%
provided by students that could incite them to make changes on their future tweets in order to improve them Fig. 11.
What role has feedback played in improving students’academic performance?
The improvement of students’ performance has been addressed by analysing both
scores on the activity of Twitter and the final grade of the subject comparing it from the one of the previous year.
In the context of this experience, the scores of the tweets from every issue are avail-able and therefore it can be analysed whether they have increased during the semester or not. In the following table, it can be seen, in particular, how from issue 2 to 3, most students have improved their academic performance, as well as from issue 3 to 4. This aspect could be due to the influence of the peer feedback received which could have motivated and assisted them in improving their future tasks, although we have no
Issue 2 Issue 3 issue 4 Issue 5
Yes 80,40% 91,10% 87,10% 78,60%
No 7,10% 1,80% 9,70% 11,90%
Not applicable 12,50% 7,10% 3,20% 9,50%
0,00% 10,00% 20,00% 30,00% 40,00% 50,00% 60,00% 70,00% 80,00% 90,00% 100,00%
Fig. 8Evolution of students’perception in relation to the links provided through Twitter
A lot Quite a lot Bit A bit Not
applicable
Issue 2 26,80% 48,20% 10,70% 0,00% 14,30%
Issue 3 32,10% 50,00% 7,10% 1,80% 8,90%
issue 4 27,40% 51,60% 16,10% 0,00% 4,80%
Issue 5 40,50% 35,70% 11,90% 0,00% 11,90%
0,00% 10,00% 20,00% 30,00% 40,00% 50,00% 60,00%
evidence to attribute it directly. Contrary to this view, however, it is surprising the evo-lution of the academic performance in the last issue since most of the students lower their ratings. This could be due to aspects that have already been discussed so far, such as lack of time or the incompatibility of this kind of activity with the end of the semes-ter and not to mention the delivery of assignments of other subjects and the need to study for the final exams. It could also be due to some effect of accommodation with regard to the activity. In any case, these results suggest the need, in future experiences, to include a review of the quality of tweets by the teachers of the subject and the as-signment of a rating by them. This would allow the analysis of the degree of discrep-ancy between the students’and teachers’scores Fig. 12.
Moreover, the average of students’grades at the end of the course was 6.69 against 6.05 on average in the same subject the previous year, in which the experience of Twitter was
A lot Quite a lot Bit A bit Not
applicable
Issue 2 41,10% 37,50% 8,90% 0,00% 12,50%
Issue 3 41,10% 46,40% 3,60% 0,00% 8,90%
issue 4 43,50% 43,50% 8,10% 0,00% 4,80%
Issue 5 38,10% 47,60% 2,40% 0,00% 11,90%
0,00% 5,00% 10,00% 15,00% 20,00% 25,00% 30,00% 35,00% 40,00% 45,00% 50,00%
Fig. 10Evolution of students’perception of the interest of tweets during the semester
A lot Quite a lot Bit A bit Not
applicable
Issue 2 48,20% 33,90% 5,40% 0,00% 12,50%
Issue 3 44,60% 41,10% 3,60% 0,00% 10,70%
issue 4 53,20% 33,90% 8,10% 0,00% 4,80%
Issue 5 61,90% 33,30% 0,00% 0,00% 4,80%
0,00% 10,00% 20,00% 30,00% 40,00% 50,00% 60,00% 70,00%
not performed. Despite this increase, no apparent relationship has been found between this activity and the overall rating since the correlation coefficient isr= 0.32.
How have students used the information received through the feedback from their peers?
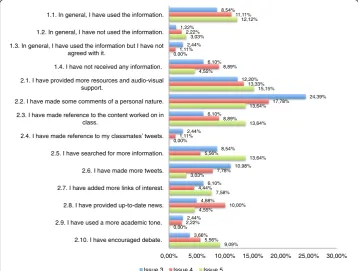
When asked about the implementation that students gave to the information and sug-gestions given by their peers, they overwhelmingly stated they had used ‘some’ of this information they were given Fig. 13.
When asked“How have you used the information your partner gave you for the
elab-oration of your next tweets?”; the responses (which despite being open have been clas-sified based on their similarity) indicate that the main change that is generated as a result of what classmates affirm is to progressively show their personal opinion on their
0,00% 10,00% 20,00% 30,00% 40,00% 50,00% Issue 3 Issue 4 Issue 5 Academic performance improves Academic performance worsens
Academic performance does not change
Fig. 12Evolution of students’performance during the semester
8,54% 1,22% 2,44% 6,10% 12,20% 24,39% 6,10% 2,44% 8,54% 10,98% 6,10% 4,88% 2,44% 3,66% 11,11% 2,22% 1,11% 8,89% 13,33% 17,78% 8,89% 1,11% 5,56% 7,78% 4,44% 10,00% 2,22% 5,56% 12,12% 3,03% 0,00% 4,55% 15,15% 13,64% 13,64% 0,00% 13,64% 3,03% 7,58% 4,55% 0,00% 9,09%
0,00% 5,00% 10,00% 15,00% 20,00% 25,00% 30,00% 1.1. In general, I have used the information.
1.2. In general, I have not used the information.
1.3. In general, I have used the information but I have not agreed with it.
1.4. I have not received any information.
2.1. I have provided more resources and audio-visual support.
2.2. I have made some comments of a personal nature.
2.3. I have made reference to the content worked on in class.
2.5. I have searched for more information.
2.6. I have made more tweets.
2.7. I have added more links of interest.
2.8. I have provided up-to-date news.
2.9. I have used a more academic tone.
2.10. I have encouraged debate.
Issue 3 Issue 4 Issue 5
tweets. The second consequence in terms of frequency (in fact, it is the most important in the last issue) is the provision of resources that accompany each tweet. Both ele-ments (showing their opinion and linking tweets to relevant outside resources) are aligned with the criteria given on the first day of the subject regarding the proper use of Twitter.
Are students satisfied with this experience which incorporates the use of twitter and peer
review?
Regarding students’satisfaction, the survey asked the participants of the experience to express their satisfaction evaluating from 1 to 6 the following elements:
The data received from my partner to assess my tweets was adequate The timing of the return of peer feedback was adequate
This feedforward experience has helped me to improve my competencies This feedforward experience has helped me to improve my learning process The feedback received has been useful to improve future activities
The experience has increased my participation and involvement in the classroom activities
The experience of feedback has improved my motivation towards the subject The workload has been adequate
The most valued element was the first item: (“The data received from my partner to
assess my tweets was adequate.”), which received an average of 4.94 out of 6 points.
While the lowest score obtained was in the element: “This feedforward experience has
helped me to improve my competencies (with 3.5). This calls into question the rele-vance of this innovation that was made relating to the ultimate objective of every teach-ing and learnteach-ing process, which is the development of competencies.
Discussion
The opportunities to provide feedback to students and to provide additional communi-cation on this feedback are often limited due to the difficulties of interacting between teachers and students as well as among the students themselves. The objective of this experience was to increase these opportunities to provide this feedback from different resources and this required additional communication through the use of new technologies.
This experience highlights the good and bad points about the usefulness of Twitter. On the one hand, a positive assessment regarding the technology is obtained as a tool to promote peer review, something that has also been very little explored in previous studies (Luo & Gao, 2014). However, this innovation promoted by Twitter does not achieve an improved perception of learning by the participants nor objectively of the total performance in the subject. Even so, it is true that it improves students’ satisfac-tion on the subject.
microblog systems (Luo & Gao, 2014) that allow us to consider how to design and fa-cilitate peer assessment activities using new technologies.
Moreover, it is important to take into account the explicit aim of knowing whether the practice of peer review led to an improved performance in activities under feed-forward and in the subject. On the one hand, one progressive improvement (but not sustained as it decreases in the last issue) would be in carrying out the activity that students attribute to receiving feedback from their peers, indicating in which specific aspects they have improved their future Twitter tasks. But on the other hand, the mark obtained in this activity has a low correlation with the final score and performance in the whole subject has improved just slightly compared to previous years.
There is a need for a better understanding of how to finally use Twitter in education. The experience presented in this article is similar to what happened in the experience of Lee, Tsai, Chait, and Koht (2014). While students were very productive in the use of computers as productivity tools (Internet search, creating PowerPoints slides for a pres-entation, use of the Word editor, etc.), the technological competency and the wide-spread provision of ICT access at the school and at home did not lead to a responsible use of technology for learning in general. In our experience, despite the positive valu-ation of the use of the tool, this use has not resulted in noticeable improvements in the learning process.
Regarding the extent to which students are involved in the experience, the assess-ment is positive in that, on average, 84.65 % of those students assigned to continuous assessment participated in it. It is important to take into account that this number is due to the decline in the participation of students during the last weeks of the subject, when this participation usually exceeded 90 %. That is certainly a positive aspect. Not so with the commitment of students to assess their peers within the stipulated period that even suffers a worsening in answering the peer review form by Google Drive, which does not show an improvement in the responsibility within this practice.
If it is analysed how students use Twitter, an increasingly complex use is perceived as a single tweet incorporates several elements (opinions, resources, links…), as is appar-ent from the assessmappar-ent of the type of contappar-ent that studappar-ents have made of the tweets to their peers. This is corroborated by the students’own perception that report having increasingly progressed in the expression of their personal opinions and in providing resources that accompany their tweets. This result suggests that the quality of tweets has improved and it has adjusted more to the key academic requirements of this kind of experience in the context of Higher Education.
the final grades, as outlined, have not either. This calls into question the relevance of this innovation that was made relating to the ultimate objective of every teaching and learning process, which is the development of competencies.
Authors’information
Maite Fernández-Ferrer has a degree in Education and a master’s degree in International Studies and in Social and Educational Action from the University of Barcelona. She is a member of the research group Interactive Media Lab led by Doctor Antonio Bartolomé. Since 2010 she has been part of various studies about competencies and assessment in higher education. Since 2011 she has participated in several scientific conferences on the subject, both national and international. From all this research experience various publications have arisen, both book chapters and journal articles. Among her international research experience there are her stays at the University of Cape Town and at the Universität zu Köln. Nowadays, and thanks to a pre doctoral fellowship from the Catalan government, she is a research assistant at the University of Barcelona and she is working on her international doctoral program about the Massive Open Online Courses and their assessment.
Elena Cano is a Professor at the Department of Didactics and Educational Organization. Degree and PhD in Philosophy and Education. PhD Extraordinary Award of the University of Barcelona 1995-1996. Degree in Economics and Business Administration.
She teaches courses in different degrees and postgraduate studies of Pedagogy and Teacher Training, basically about school organization and educational assessment subjects.
She researches mainly on the assessment in higher education. She is currently coordinating a R & D project on evaluation of competences of university students.
Acknowledgements
This paper has had a supplementary support from the Department of Teaching and Educational Organisation at the University of Barcelona who provided help on the writing assistance and proof reading the article.
Received: 30 November 2015 Accepted: 18 February 2016
References
Boekaerts, M. (1999). Self-regulated learning: Where we are today.International Journal of Educational Research, 31, 445– 457.
Boekaerts, M., Pintrich, R., & Zeidner, M. (2000).Handbook of self-regulation. London: Academic.
Boud, D. (2000). Sustainable assessment: rethinking assessment for the learning society.Studies in Continuing Education, 22(2), 151–167.
Boud, D., Lawson, R., & Thompson, D. (2013). Does student engagement in self-assessment calibrate their judgment over time?Assessment & Evaluation in Higher Education, 38(8), 941–956.
Dillenbourg, P., & Hong, F. (2008). The mechanics of CSCL macro scripts.International Journal of Computer- Supported Collaborative Learning, 3, 5–23.
Dippold, D. (2009). Peer feedback through blogs: Student and teacher perceptions in an advanced German class.
ReCALL, 21(1), 18–36.
Dunlap, J., & Lowenthal, P. (2009). Horton hears a tweet.EUCAUSE Quarterly, 32, 1–10.
Ebner, M., Lienhardt, C., Rohs, M., & Meyer, I. (2010). Microblogs in higher education–a chance to facilitate informal and process-oriented learning?Computers and Education, 55, 92–100.
Faculty Focus (2010).Twitter in Higher Education 2010: Usage Habits and Trends of Today’s College Faculty. Retrieved from https://library.educause.edu/resources/2010/10/twitter-in-higher-education-2010-usage-habits-and-trends-of-todays-college-faculty
Friesen, N., & Lowe, S. (2012). The questionable promise of social media for education: connective learning and the commercial imperative.Journal of Computer Assisted Learning, 28, 183–194.
Gao, F., Luo, T., & Zhang, K. (2012). Tweeting for learning: A critical analysis of research on microblogging in education published in 2008–2011.British Journal of Educational Technology, 43(5), 783–801. doi:10.1111/j.1467-8535.2012. 01357.x
IEA. (2013).PREES RELEASE. Brussels: International Association for the Evaluation of Educational Achievement (IEA). Jonassen, D. H., Howland, J., Marra, R., & Crismond, D. (2008).Meaningful learning with technology(3rd ed.). Upper
Saddle River, NJ: Pearson.
Karoly, P. (1993). Mechanisms of self-regulation: A systems view.Annual Review of Psychology, 44, 23–52. Lee, K., Tsai, P. S., Chait, C. S., & Koht, J. H. L. (2014). Students’percetions of self-directed learning and collaborative
learning with and without technology.Journal of Computer Assisted Learning, 30, 425–437.
Luo, T., & Gao, F. (2014).Enabling Twitter-Mediated Peer Feedback in Face- to-Face Classrooms. AERA: AERA Online Paper Repository.
Manca, S., & Ranierit, M. (2013). Is it a tool suitable for learning? A critical review of the literature on Facebook as a technology-enhanced learning environment.Journal of Computer Assisted Learning, 29, 487–504.
Nicol, D., Thomson, A., & Breslin, C. (2014). Rethinking feedback practices in higher education: a peer review perspective.Assessment & Evaluation in Higher Education, 39(1), 102–122.
Osborne, J., & Dillon, J. (2007). Research on learning in informal contexts: Advancing the field?International Journal of Science Education, 29, 1441–1445.
Oulasvirta, A., Lehtonen, E., Kurvinen, E., & Raento, M. (2009). Making the ordinary visible in microblogs.Personal and Ubiquitous Computing, 14, 237–249.
Shewbridge, S., Ikeda, M., & Schleicher, A. (2006).Are students ready for a technology-rich world?: What PISA studies tell us. Paris: OECD.
Shute, V. J. (2008). Focus on formative feedback.Review of Educational Research, 78(1), 153–189.
Stahl, G., Koshmann, T., & Suthers, D. (2006). Computer-supported collaborative learning. In R. K. Sawyer (Ed.),
The Cambridge handbook of the learning sciences(pp. 409–426). Cambridge, UK: Cambridge University Press.
Strijbos, J. W., Narciss, S., & Dunnebier, K. (2010). Peer feedback content and sender’s competence level in academic writing revision tasks: are they critical for feedback perceptions and efficiency?Learning and Instruction, 20(4), 291–303. Van Gennip, N. A. E., Segers, M. S. R., & Tillema, H. H. (2010). Peer assessment as a collaborative learning activity: the role
of interpersonal variables and conceptions.Learning and Instruction, 20(4), 280–290.
Veletsianos, G. (2012). Higher education scholars’participation and practices on Twitter.Journal of Computer Assisted Learning, 28, 336–349.
Ware, P. D., & O’Dowd, R. (2008). Peer feedback on language form in telecollaboration.Language, Learning & Technology, 12(1), 43–63.
Submit your manuscript to a
journal and benefi t from:
7Convenient online submission
7Rigorous peer review
7Immediate publication on acceptance
7Open access: articles freely available online
7High visibility within the fi eld
7Retaining the copyright to your article