ISSN (e): 2250-3021, ISSN (p): 2278-8719
Vol. 09, Issue 1 (January. 2019), ||V (I) || PP 01-14
Protocol for Evaluating Sand Dam Water Quality in Semi-Arid
Areas: A Case Study of Makueni County
D. Ndunge
1, D.O. Mbuge
2and C.T. Omuto
31
Dept. of Environmental and Biosystems Engineering, University of Nairobi, Nairobi, Kenya
2Dept. of Environmental and Biosystems Engineering, University of Nairobi, Nairobi, Kenya
3Dept. of Environmental and Biosystems Engineering, University of Nairobi, Nairobi, Kenya
Corresponding Author:D. Ndunge
Abstract:
Sand dams have been recommended in many places as a feasible technology for the ASAL areas due to their ability to store water with minimal evaporation, recharge underground water and raise water table, among others. In Kenya, adoption of sand dam technology has been steadily increasing. Water from the sand dams is used for drinking, domestic uses, livestock watering, and for irrigation. Water quality is paramount for drinking water. However, much emphasis is being done on the sand dam technical aspects namely hydrologic measurement and analysis, and determination of the quantity of water that will be harvested with less or no concern on the water quality and how the water quality can be affected. The focus of this study therefore was to determine water quality parameters for evaluating potability of water from sand dams, and development of a protocol for evaluating potability of water from sand dams in semi-arid areas. Water samples were collected from the sampled existing sand dams’ water abstraction points within Makueni County and analyzed for heavy metals, microbiological, physical and chemical quality. Laboratory test results showed that all tested sand dams within the study area have unsafe water for drinking in its raw form. A protocol for determining the potability of sand dams was developed. The protocol provides information on how to assess the quality of raw water from sand dams; to determine the need and extent of the water treatment to make it safe for drinking; and to examine the finished water to ascertain that it conforms to the recommended drinking water standards.Keywords:
Sand dams, Water Quality, Protocol, Potability, Minimum Data Set, Makueni County.--- --- Date of Submission: 18-12-2018 Date of acceptance: 03-01-2019 ---
---I.
INTRODUCTION
ASALs are characterized by extremely limited spatially distributed precipitation and high evaporation losses with poorly available ground water supply. Sand storage dam technique (sub surface storage dam) is used to reduce the evaporation effect [1]. Sand dam is typical embankment or wall built across an ephemeral (seasonal) stream. During the rainy season, the wall harvest sand and 20-40% of its total volume is water as shown in Figure 1. The water is then abstracted using various methods depending on the intended use by the communities. There are three common methods of water abstraction from sand dams including traditional scoop holes, an infiltration gallery either leading a tank behind the dam and/or piped through the dam leading to a tap and an infiltration gallery leading to a sealed shallow well in the valley side – topped with a hand pump.
Figure 1: Typical illustration of sand dams
Sand dams have over time been recommended as the most feasible technology for the ASAL areas due to their ability to store water with minimal evaporation, recharge underground water and raise water table, rehabilitate gullies and harvest sand which can be used for construction [3]. To this effect, sand dam technology adoption is on the rise worldwide with Kenya being recorded as a country with the highest concentration of sand dams. In Kenya, various government agencies, non-governmental organizations (NGOs), faith based organizations (FBOs) and community based organizations (CBOs) have been promoting the adoption of sand dams through funding and capacity building. Water from the sand dams is used for drinking, other domestic uses, livestock watering and irrigation purposes. Water quality is paramount for drinking water. However, much emphasis is being done on the sand dams technical aspects namely hydrologic measurement and analysis, and determination of the quantity of water that will be harvested with less or no concern on the water quality and how the water quality can be affected. Maddrell and Neal [4] outlined a practical guideline for the situation, design and construction of sand dams. ERHA and RAIN Foundation [3] published a Manual on Sand Dams in Ethiopia focusing on the practical approach on sand dam site selection, design and construction.
Over the years it has been cited in literature [5, 6, 3] that water from sand dams is of very good quality owing to the fact that being an underground storage, water is protected from surface contaminants and as the water moves through the sand it is filtered and therefore the quality improves over time. However, there is no guideline on sand dam design parameters, location and method of abstraction for optimal water quality. Despite sand dam technology of harvesting rainwater in the ASALs having been in use for many decades, there is scanty data and studies on the water quality. There are only three studies that have been done recently on water quality from sand dams:
i. A microbiological water quality assessment for sand dams in Machakos and Makueni counties, Kenya [5]. The analysis was done for water contained in sand dam through test holes and abstracted from it through covered wells and scoop holes. The assessment was specifically for thermotolerant coliform (TTC) concentration, turbidity, conductivity and PH indicators of water quality. A few samples (about 17%) of the samples collected tested positive for TTCs contrary to WHO and KEBs requirements that drinking water should have zero levels of TTC. Water from test holes and covered wells proved to be of better microbiological quality as compared to that from scoop holes. Turbidity levels for water from both scoop holes and covered wells exceeded WHO guideline levels. About 26% of the sampled scoop holes and 26% of covered wells indicated and exceedance of the conductivity levels based on WHO guidelines.
ii. An experimental investigation was conducted on the effect of sand storage dams on water quality, where a model was designed to simulate a sand dam water reservoir [6]. A perforated pipe was used to discharge water from the model. Two types of soils were used to simulate the soil of sand dam reservoir. Raw water (rainfall) was added to the model by nozzles to the soil samples and left to settle for three (3) days and then emptied from the soil samples and collected as water samples for analysis. The tests were done for PH, Electrical conductivity, turbidity, sodium chloride, calcium, magnesium, bicarbonates, sodium and potassium water quality indicators to determine its suitability for human, livestock, and irrigation uses. The analysis indicated medium salinity and low sodium levels hence the water recommended suitable for irrigation purposes.
iii. Kitheka studied the variations of salinity levels and associated physico-chemical parameters in sandbeds of seasonal rivers in Kitui, Kenya [7]. The physico-chemical parameters studied included salinity, TDS, and conductivity. The interaction between water in the seasonal river channels and that in the bank storage and or groundwater aquifers was also studied. Salinity, conductivity and TDS levels were found to be higher during the dry season as compared to those of wet season. Water in shallow wells and sand dams showed high levels of physico-chemical parameters. However, in general the salinity levels were within the minimum allowable limit for drinking water except in the extended drought periods.
This paper therefore focusses on assessing potability and developing a protocol for evaluating potable water quality of sand dams.
II.
STUDY SYSTEM
2.1 Study Area DescriptionThis study was conducted in Makueni County to form a representation of other ASALs in Kenya. Makueni County was selected as the study area because;
It is a county where sand dam technology adoption is high as compared to other ASALs within the country and there is no report on water quality from the sand dams.
Makueni County, located within Kenya’s arid and semi-arid lands (ASALs) is one of the driest counties in Kenya. Only 36 percent of the county’s residents use improved water sources with the rest relying on unimproved sources including unprotected dug well, unprotected spring, dams, water pans and sand dams [8]. Makueni County lies within the arid and semi-arid ecological zones of the eastern region of Kenya. It lies between Latitude 1º 35´ and 30 00 South and Longitude 37º10´ and 38º 30´East and covers an area of 8,034.7 Km2 (Makueni CIDP, 2013). The County is divided into six (6) sub-counties including Makueni, Mbooni, Kaiti, Kibwezi East, Kibwezi West and Kilome. The county experiences bimodal rainy seasons, with the long rains occurring in March /April and the short rains in November/December. The hilly parts of Mbooni and Kilungu receive between 800-1400mm of rainfall per year which has high potential for crop production. There are extremely high temperatures of 35.80C which are experienced in the low-lying areas of the County leading to high evaporation which worsens the dry conditions [8]. Normally, the rains are sometimes unreliable, erratic and inadequate.
The main river in Makueni County is Athi River, which is perennial and fed by tributaries such as Kambu, Kiboko, Kaiti, Thwake and Mtito Andei, which drain from various parts of the county. A few other streams flow from the Mbooni and Kilungu Hills but their flow becomes irregular as they move to the low-lying areas. These rivers provide a high potential for both large and small-scale irrigation [8]. Water demand in the county is estimated at 22,113m3/day with supply being 13,607m3/day, 63 percent lower than the demand. Households walk an average of eight (8) kilometers to and from water sources and only 36 percent of residents use improved water sources with the rest relying on unimproved sources which include unprotected dug well, unprotected spring, surface water (dams, water pans and sand dams) [8].
2.2 Data Requirements and Data Types
Assurance of drinking water safety is a foundation for the prevention and control of waterborne diseases [9]. Potable water quality is regulated by set quality standards; which describe the quality parameters set for drinking water, this study was based on the international World Health Organization standards (WHO) guidelines and the national Kenya Bureau of Standards (KEBs) for potable water. Various water quality parameters are tested to determine its potability based on the area of study’s drinking water regulating guidelines and standards. These parameters are categorized as microbiological, physical or chemical.
The microbiological analysis of all the water samples was based on Fecal Coliforms (FC) and E. Coli (FCECL) concentration (cfu/100 ml) as they are indicators of recent contamination of the water by human sewage or animal droppings which could contain other bacteria, viruses, or disease-causing organisms.
For physicochemical analysis turbidity (TUB), PH (pH), electrical conductivity (EC), chlorides (Cl), fluorides (Fl), ammonium (NH4), nitrates (NO3), calcium (Ca), magnesium (Mg), sodium (Na), potassium (K),
nitrate N (NO3N), phosphorus (P), Sulphur (S), bicarbonate (HCO3), sulphate (SO4), silicon (Si), silica (SiO2),
phosphate (PO4) and hardness (CaCO3) were analyzed for all the water samples.
Due to the interaction of water with sand within sand dams, it is important to do heavy metals analysis to check the presence of toxic metals, and those that have no health risk but can make the water unpleasant to drink such as poor taste resulting from high iron levels. To this effect, analysis of manganese (Mn), iron (Fe), zinc (Zn), copper. (Cu), boron (B) and molybdenum (Mo) was done on all the water samples.
2.3 Sampling and Data Collection
Owing to the expansive nature of the Makueni County, limitations of time and cost, it was not possible to study all the existing sand dams, and therefore sampling was done. A two-stage cluster sampling technique was used. Makueni County has one major permanent river which is Athi River. Athi River has various tributaries including Kambu, Kaiti, Kiboko, Mtito Andei, Thwake, Thange, Uani, Muooni, Tawa and Kiangini. The County was therefore divided into ten (10) clusters based on these sub-catchments. Four (Kaiti, Uani, Tawa and Thwake) of the ten clusters were selected to form a sampling frame. A sample size of five was determined and divided equally among the selected clusters. Random selection of the sand dams was done within each of the chosen cluster as indicated in Table 1.
Table 1: Sampled Sand Dams
Site/Sand Dam River
Basin
GPS Location Method of Water
Abstraction
Remark Northing
(m)
Easting (m)
Elevation (m)
A. Kaiti Sand Dam
Kaiti River 9804061 346910 1105 Scoop hole Mature
B. Kaiti Sand Dam
Kaiti River 9803755 347170 1129 Piped with a Tap Mature
Wa Mwau Sand Dam
River a hand pump
D. Kiaoni Sand Dam
Tawa River
9826723 338377 1182 Scoop hole Mature
E. Kwa Veleki Sand Dam
Kikumu River
9828575 326377 1387 Scoop hole Mature
Note: Kaiti Sand Dam currently has two methods of water abstraction and therefore it was treated as two different sites so as to determine the effect of method of water abstraction on the water quality
To determine the standard potable water quality, water samples were collected from the five sampled sand dams’ abstraction points and tested for 30 key drinking water quality indicators comprising of microbiological, physicochemical and heavy metals parameters to determine whether they meet international World Health Organization (WHO) guidelines and the national Kenya Bureau of Standards (KEBs) for potable water. To avoid contamination, the water samples were collected in sterile bottles and great care taken to prevent accidental contamination of the sterile bottle or water sample during sampling and transportation to the water testing laboratory. All sampling bottles were labelled appropriately and stored in a coolant with well-regulated temperatures during transportation from Makueni County to the testing laboratory; CropNuts Laboratory Services in Nairobi.
2.4 Data Analysis
Potability assessment is done to determine if the water is safe to drink and the amount and types of impurities present. Potability analysis was done on 30 key water quality parameters for the five (5) sand dam sites based on WHO guidelines and KEBs standards drinking water quality. For purposes of the protocol for evaluating sand dam water quality, principle component analysis (PCA) was used to establish a minimum data set (MDS) with the most appropriate indicators for potable water quality and only factors with eigenvalues >1 considered.
2.5 Development of a Protocol for Evaluating Potability of Water from Sand Dams
A protocol for evaluating potability of water from sand dams was prepared based on the findings from this study. This covered the key indicators/parameters for potable water quality, guidelines for evaluating potability of water from sand dams and recommendations on the appropriate water treatment process required where necessary.
Guidelines on how to use the water quality parameter/indicators to determine whether water from sand dams is safe are described in the protocol. Major components of a protocol including the protocol’s purpose, materials, methods, standards, data interpretation and references are also included.
III.
RESULTS AND DISCUSSIONS
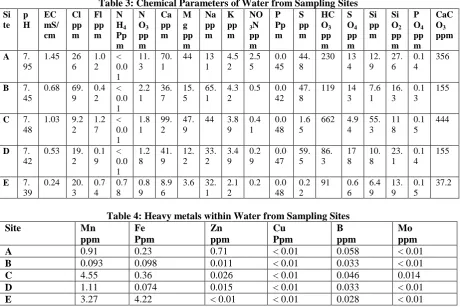
3.1 Potable Water Quality of Sand Dams in Makueni CountyThe average values of the microbiological, physicochemical and heavy metals water parameters of the water samples collected from Makueni County are summarized in Tables 2, 3 and 4.
Table 2: Microbiological and Physical Parameters of Water from Sampling Sites
Site Microbiological Parameters Physical Parameters
FC cfu/100 ml
FCECL
cfu/100 ml Turbidity
(NTU)
Color
(True color units)
Odour
A 8 ND 3.77 Clear Without odour
B > 180 ND 65.3 Clear Without odour C 50 ND 3.23 Clear Without odour
D 90 2 6.73 Clear Without odour
E > 180 2 17.2 Clear Without odour
Table 3: Chemical Parameters of Water from Sampling Sites Si te p H EC mS/ cm Cl pp m Fl pp m N H4 Pp m N O3 pp m Ca pp m M g pp m Na pp m K pp m NO 3N pp m P Pp m S pp m HC O3 pp m S O4 pp m Si pp m Si O2 pp m P O4 pp m CaC O3 ppm
A 7.
95
1.45 26 6 1.0 2 < 0.0 1 11. 3 70. 1
44 13 1 4.5 2 2.5 5 0.0 45 44. 8
230 13 4 12. 9 27. 6 0.1 4 356
B 7.
45
0.68 69. 9 0.4 2 < 0.0 1 2.2 1 36. 7 15. 5 65. 1 4.3 2
0.5 0.0 42
47. 8
119 14 3 7.6 1 16. 3 0.1 3 155
C 7.
48
1.03 9.2 2 1.2 7 < 0.0 1 1.8 1 99. 2 47. 9
44 3.8 9 0.4 1 0.0 48 1.6 5
662 4.9 4 55. 3 11 8 0.1 5 444
D 7.
42
0.53 19. 2 0.1 9 < 0.0 1 1.2 8 41. 9 12. 2 33. 2 3.4 9 0.2 9 0.0 47 59. 5 86. 3 17 8 10. 8 23. 1 0.1 4 155
E 7.
39
0.24 20. 3 0.7 4 0.7 8 0.8 9 8.9 6
3.6 32. 1
2.1 2
0.2 0.0 48
0.2 2
91 0.6 6 6.4 9 13. 9 0.1 5 37.2
Table 4: Heavy metals within Water from Sampling Sites
Site Mn
ppm Fe Ppm Zn ppm Cu Ppm B ppm Mo ppm A 0.91 0.23 0.71 < 0.01 0.058 < 0.01
B 0.093 0.098 0.011 < 0.01 0.033 < 0.01
C 4.55 0.36 0.026 < 0.01 0.046 0.014
D 1.11 0.074 0.015 < 0.01 0.033 < 0.01
E 3.27 4.22 < 0.01 < 0.01 0.028 < 0.01
Sand has been used as a filter material in water purification since the history of water filtration. However, it is important to have a relatively clean source of water that is free from all forms of pollution and contamination including microbiological organisms, chemicals and heavy metals, since sand cannot provide sufficient filtration for potable water.
In this light, it was noted from the laboratory test results that all sand dams in the studied area have unsafe water for drinking in its untreated form. Most of the drinking water quality parameters tested were within the required limits (optimum levels). However, some key parameters were below or above the recommended levels for drinking water, thus rending the water unsafe for drinking as discussed in the subsequent section.
Fecal Coliforms Bacteria
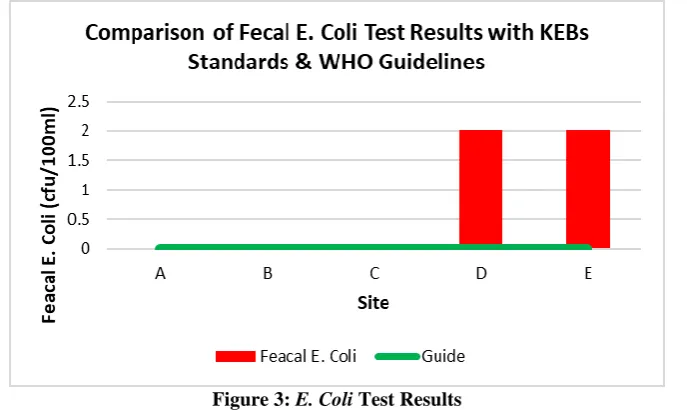
WHO recommends drinking water to have zero presence of coliforms bacteria. However, all water samples tested indicated presence of coliforms bacteria. Fecal Coliforms bacteria was present in all the tested sand dams with two sites indicating high risk as shown in Fig 6. Escherichia coli (E. coli) bacteria was also found to be present in two of the tested samples as shown in Figures 2 and 3.
Figure 3: E. Coli Test Results
Coliform bacteria are found in the environment and feces of all warm-blooded animals and human beings and may not cause illnesses. However, presence of coliform bacteria in drinking water implies that the water system could contain disease-causing organisms and or pathogens. If fecal coliform bacteria or E. coli are present in a water system, it is an indication of recent fecal contamination, which may pose an immediate health risk to anyone consuming the water in its raw form. Drinking water with coliform bacteria increases the risk of contracting water-borne illnesses. During the data collection exercise, it was noted that the sand dams are not protected from fecal pollution and animals graze around the river banks as others drink water directly from the sand dams and as result defecate and urinate on the sand dams. Pit latrines are the common way of disposing human waste in the area and this could also be a major contributor of fecal pollution of the sand dams. For instance, dam site B which is downstream of Wote Town which is highly populated has high fecal coliforms levels. In addition, the method of water abstraction from sand dams may have an effect on the presence of E. coli. For instance, water obtained from tap and shallow well as methods of water abstraction from sand dams showed no presence of E. coli counts. Fecal coliforms in these sites were also lower as compared to those in the samples collected from the traditional scoop holes.
When coliforms have been detected, repairs or modifications of the water system may be required. Boiling the water is advised until disinfection and retesting can confirm that contamination has been eliminated. In addition, it is recommended that protective measures such as; securing and fencing the sand dams to keep off animals and human from the sand dams, establishment of different watering points for livestock and domestic drinking use, discouraging the consumers from drawing water directly from the sand dams using traditional scoop holes method and advising them on appropriate point-of-use water disinfection for all domestic uses.
Turbidity
Turbidity being the amount of cloudiness in the water as an indicator of suspended materials in water can be caused by phytoplankton; silt, sand and mud; bacteria and other germs; and chemical precipitates. It is often caused by soil runoff. For drinking water, WHO recommends that the turbidity should not exceed 5 NTU and should not be below 1 NTU. This might not be the case if drinking water is obtained directly from surface and subsurface water sourced like sand dams and used in its raw state.
Findings of this study indicated high turbidity than the recommended values in some sites as shown in
Figure 4: Turbidity levels of tested Water Samples
High turbidity reduces the aesthetic quality of drinking water significantly It can also increase the cost of drinking water treatment. To abstract water within the recommended turbidity levels, it is therefore recommended that the consumers be discouraged from using the traditional scoop holes method of abstraction and adopt other methods which indicated low turbidity such as the use of shallow wells. In addition, it is recommended that over exploitation of plant cover and overgrazing around the sand dams especially during the dry seasons be discouraged. To abstract water from sand dams with the required/low turbidity levels,
Chlorides
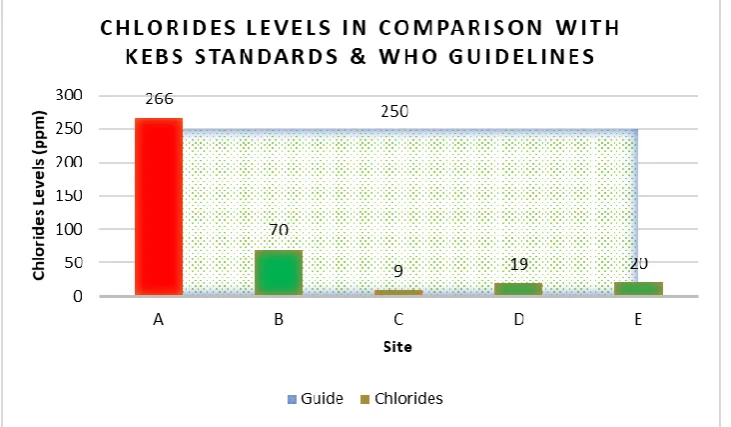
WHO guidelines, KEBs and NEMA drinking water standards require chloride levels not to exceed 250 mg/l. However, the sample obtained from tapped water from site A indicated high levels of chlorides as shown in Figure 5. The difference in chloride levels in the water obtained from tapped source and that from traditional scoop holes may be associated with the combination of the sand dam water and borehole water as indicated by the residents. Sodium chloride levels greater than the recommended 250 mg/l can complicate existing heart problems and contribute to high blood pressure when ingested in excess. High levels of sodium chloride can also give drinking water an unpleasant taste.
When high levels of chloride are detected in drinking water sources, electrodialysis and distillation processes can be used to reduce the chloride content. Reverse Osmosis which removes 90 - 95% of the chlorides can also be used.
Ammonium
It is recommended that drinking water should have ammonium levels of less than 0.5 mg/l. The presence of ammonia at higher levels than this indicate presence of fecal contamination and cause taste and odor problems in drinking water. Higher level than the recommended value of ammonium was detected in site E as shown in Figure 6. The dam is near various human settlements hence the high levels of ammonium could be as a result of presence of pit latrines which are the sole method of human waste disposal in the area. It is therefore recommended that the water be disinfected with chlorine before use.
Figure 6: Ammonium Levels Test Results
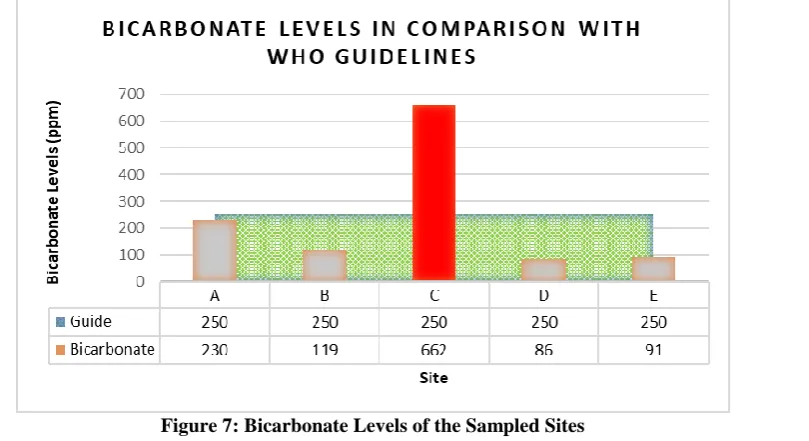
Bicarbonate
WHO recommends for drinking water to contain less than 250 mg/l of bicarbonate. On the contrary, Site C Sand Dam was found to have around 662 mg/l of bicarbonate (as shown in Figure 7) which is way above the recommended levels of bicarbonate in drinking water. High levels of bicarbonate in drinking water has no adverse health effects. However, the water is likely to have undesirable/poor taste. Bicarbonate alkalinity is introduced in water bodies by carbon dioxide dissolving carbonate containing minerals and it is usually associated with high PH values (>8.5), which require acidification for effective chlorine treatment.
Analyses of the field data and the map of the location didn’t show any land activity that could lead to the high bicarbonate levels. However, it is recommended a detailed analysis of the soils within the dam site and upstream of the dam be done to determine the cause.
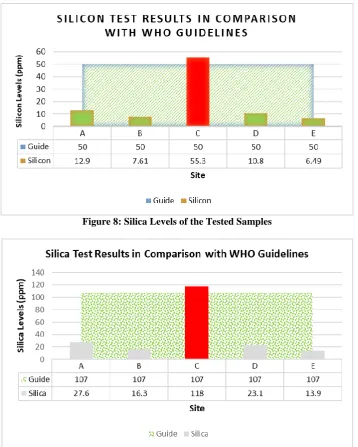
Silicon and Silica
WHO recommends silica and silicon levels in drinking water be less than 107 ppm and 50 ppm respectively. Some sites were found to have higher values than the recommended levels as shown in Figures 8 and 9. However, in drinking water only silicic acid is present and has no adverse health effects. High levels of silica can cause dandruff-like symptoms of hair flaking. Build-up of silica can choke hair follicle causing the hair to fall out. For human health purposes, it is recommended that higher levels of silica than the recommended values in drinking water be removed.
Figure 8: Silica Levels of the Tested Samples
Figure 9: Silicon Levels of the Tested Samples
Hardness
Figure 10: Hardness Levels of the Tested Samples
Hard water has no known adverse health effects. However, cardiovascular mortality has been linked with the effect of magnesium or hardness on drinking water in some epidemiological studies although it has not been proved yet. In this light, when drinking water sources have tested positive on hardness beyond the recommended levels, caution must be taken on the use of the water for potable purposes in its raw form.
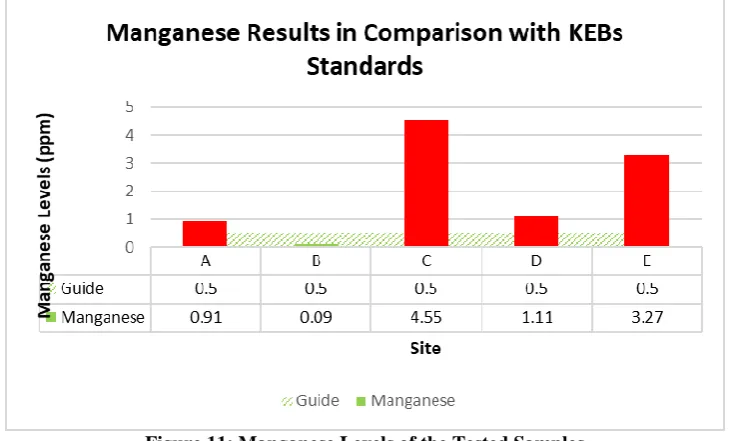
Manganese and Iron
Manganese and Iron occur naturally on the earth’s crust as minerals. They are very common in drinking water sources. They both occur in water sources when water percolates through soil and rock, dissolves them and carries them into groundwater. If the water supply is piped in iron pipes, the pipes can corrode and leach the iron into the water supply.
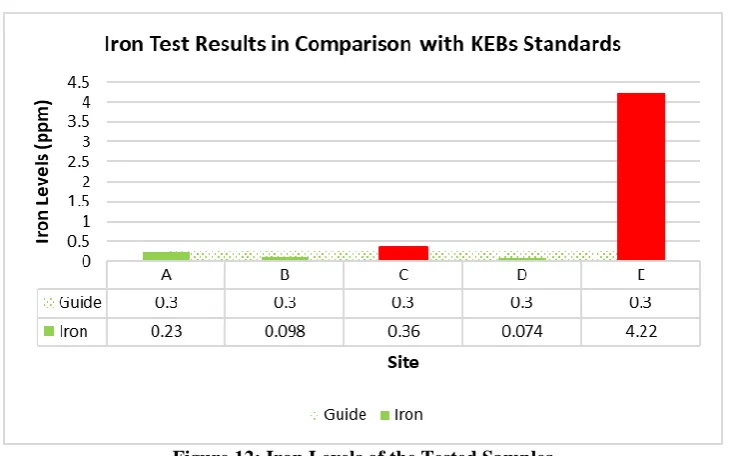
For drinking water, WHO recommends that the manganese and iron levels should not exceed 0.5 mg/l and 0.3 mg/l respectively. However, some sites had higher levels of manganese and iron as shown in Figures 11 and 12.
Figure 12: Iron Levels of the Tested Samples
Both manganese and iron may not have hazardous health implications. However, they cause brown discolorations of water and introduces a bitter sweet astringent taste and stains to laundered clothes [10]. If dietary intake of iron in excessive amount may lead to haemosiderosis or haemochromatosis. Heamosiderosis is a condition best characterized by generalized increased iron content in the body tissue, especially in the liver and reticuloendothenal system [10].
If drinking water shows positive undesirable manganese and iron test results, it is recommended to source for an alternative drinking water source and adopt appropriate treatment methods. Aeration method is recommended for iron removal.
3.2 Minimum Data Set Determination
PCs with eigen values >1 were used in establishing the MDS and factor 1 with an eigen value of 1.395 and cumulative % of 69.7% as shown in Table 5 was selected for microbial indicators. For physicochemical indicators factors 1, 2, 3 and 4 were selected. For the microbial indicators FC (0.84) and FCECL (0.84) showed high positive factor loading indicating that fecal coliforms concentration should be checked for potable water quality from sand dams. In factor 1 of physicochemical indicators of potable water quality pH (0.83), EC (0.99), Mg (0.95) and CaCO3 (0.91) showed high positive factor loading (see Table 6). In factors 2, 3 and 4, Si (0.80),
SiO2 (0.80), PO4 (0.88), P (0.80), NH4 (0.67) and TUB (0.67) also showed positive factor loading indicating that
they should be considered in the evaluation of sand dam water quality for potable purposes.
Table 5: Result of PCA with Microbial indicators of potable water quality Factor 1
Eigenvalue 1.39
Variability (%) 69.74
Cumulative % 69.74
Factor loading
FC 0.84
Table 6: Result of PCA with Physicochemical indicators of potable water quality
Factor 1 Factor 2 Factor 3 Factor 4
Eigenvalue 8.93 6.99 2.83 1.25 Variability (%) 44.64 34.97 14.15 6.24 Cumulative % 44.64 79.61 93.76 100.00
Factor Loadings
pH 0.83 -0.36 0.43 -0.03
EC 0.99 -0.11 0.03 0.01
Mg 0.95 0.29 -0.09 0.02
CaCO3 0.91 0.34 -0.21 -0.04
Si 0.49 0.80 -0.36 0.01
SiO2 0.49 0.80 -0.36 0.01
PO4 -0.04 0.88 0.45 -0.17
P -0.15 0.80 0.34 -0.48
NH4 -0.65 0.28 0.67 0.23
TUB -0.35 -0.50 -0.43 0.67
3.3 Protocol for Evaluating Potability of Water from Sand Dams in Semi-Arid Areas
This study has showed that water from sand dams may not be safe for drinking in its raw state. Different sand dams have different water pollutants and there is need to develop a protocol for determining the potability of water from sand dams.
3.3.1 Main Purpose of the Protocol
The main purpose of this protocol will be to provide information on how to assess the quality of raw water from sand dams; to determine the need and extent of the water treatment to make it safe for drinking; and to examine the finished water to ascertain that it conforms to the recommended drinking water standards. The protocol will be able to determine the trend of sand dam water quality over time, identify any sources of contamination and provide information to the public health authorities and communities who are the sand dams beneficiaries.
3.3.2 Minimum Parameters for Evaluation
Based on the potential water contaminants, the minimum parameters to be evaluated for sand dam potable water quality can be determined and categorized as microbiological, physical, chemical or heavy metals. The minimum data set (MDS) determined with the principle component analysis (PCA) for sand dam potable water assessment comprise of microbial indicators including FC and FCECL; and physicochemical indicators including pH, EC, Mg, CaCO3, Si, SiO2, PO4, P, NH4 and TUB.
3.3.3 Sand Dam Characterization
When collecting water samples at a sand dam, it is important to collect data on the sand dam characteristics including the maturity state of the dam, method of water abstraction from the dam, Global Positioning System (GPS) coordinates, population density of the water users, and land use activities within the surrounding area and upstream of the water source.
3.3.4 Water Samples Collection
Samples should be collected from the points at which water is delivered to the consumer and or the sand dam water abstraction points. The water samples collected should be tested in a certified laboratory.
To avoid contamination, the water samples should be collected in sterile bottles and great care taken to prevent accidental contamination of the sterile bottle or water sample during sampling and transportation to the water testing laboratory. All sampling bottles should be labelled appropriately and stored in a coolant with well-regulated temperatures during transportation. The samples should be transported to the testing laboratory as soon as possible within six (6) hours of collection.
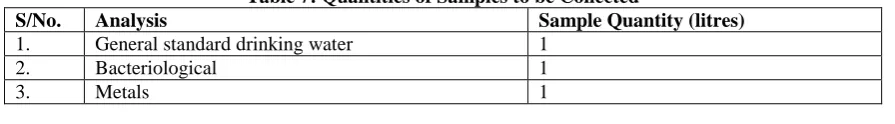
The quantities for samples to be collected should be as indicated in Table 7.
Table 7: Quantities of Samples to be Collected
S/No. Analysis Sample Quantity (litres)
1. General standard drinking water 1 2. Bacteriological 1
3.3.5 Frequency of Testing
In order to keep a track record of the sand dams water quality for domestic purposes, regular evaluations should be done. It is recommended that the water quality assessment be done twice in a year covering the dry and wet seasons.
3.3.6 Reporting
The analysis results for all samples tested in the field or sent to the laboratory during the evaluation should be duly recorded and compiled. The compiled report should show all necessary information including the location from where the sample was taken, data, time, results of the test and recommendations of the appropriate corrective measure where necessary.
The report should also be shared with the sand dam water consumers to ensure that the necessary corrective measures are followed to the later.
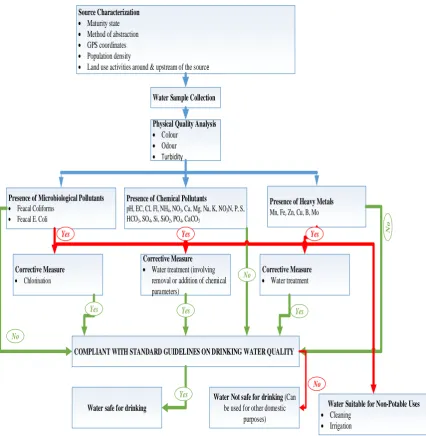
Figure 13 shows a schematic diagram of the procedures to be followed during sand dam potable water quality evaluation.
Source Characterization
Maturity state
Method of abstraction
GPS coordinates
Population density
Land use activities around & upstream of the source
Water Sample Collection
Physical Quality Analysis
Colour
Odour
Turbidity
Presence of Microbiological Pollutants Feacal Coliforms
Feacal E. Coli
Presence of Chemical Pollutants
pH, EC, Cl, Fl, NH4, NO3, Ca, Mg, Na, K, NO3N, P, S,
HCO3, SO4, Si, SiO2, PO4, CaCO3
Presence of Heavy Metals
Mn, Fe, Zn, Cu, B, Mo
Corrective Measure Chlorination
Corrective Measure
Water treatment (involving removal or addition of chemical parameters)
Corrective Measure
Water treatment
COMPLIANT WITH STANDARD GUIDELINES ON DRINKING WATER QUALITY
Water safe for drinking
Water Not safe for drinking (Can be used for other domestic
purposes)
Yes
No
No
Yes
Yes
No
Yes Yes
Yes
No
Water Suitable for Non-Potable Uses
Cleaning
Irrigation
Yes
International organization of Scientific Research
14 | Page
IV. CONCLUSIONS
Sand dams have unsafe water for drinking in its raw form. Hence water from sand dams should not be used for drinking unless the water quality has been ascertained by testing the water in a certified laboratory. In the evaluation of potable water quality from sand dams, it is important to consider the two main categories of water quality indicators including the microbial and physicochemical indicators. The minimum data set of the as determined with the principle component analysis (PCA) for sand dam potable water assessment comprise of microbial indicators including FC and FCECL; and physicochemical indicators including pH, EC, Mg, CaCO3,
Si, SiO2, PO4, P, NH4 and TUB and therefore they should all be considered in any sand dam potable water
quality assessment.
This protocol will serve as a very important tool for ascertaining suitability of sand dam water quality. It contains guidelines on how to assess the quality of raw water from sand dams and recommendations of the appropriate corrective measure where necessary. The protocol can be used for both newly constructed and mature sand dams that have been in use and the report shared with the relevant authorities, stakeholders and the water end-users for appropriate measures where necessary.
However, in addition to the water quality analysis, further research on the effects of sand dam design parameters to water quality needs to be done so as to determine the best design parameters for optimal water quality.
REFERENCES
[1]. Merel Hoogmoed (2006) Analyses of Impacts of a Sand Storage Dam on Groundwater Flow and Storage; Groundwater Flow Modelling in Kitui District, Kenya. Faculty of Earth and Life Sciences, VU University, Amsterdam
[2]. RAIN (2011) A Practical Guide to Sand Dam Implementation, Rain Foundation. RAIN: Amsterdam, The Netherlands.
[3]. ERHA and RAIN Foundation (2009) Manual on Sand Dams in Ethiopia: A practical approach on sand dam site selection, design and construction, A tool for combining sand dams with other rainwater harvesting structures.
[4]. Maddrell S and Neal I (2013) Building Sand Dams: A Practical Guide. Excellent Development: London. [5]. Quinn R., Manon D., Parker A., Orlando A. and Cairncross S. (2018) An Assessment of the
Microbiological Water Quality of Sand Dams in Southeastern Kenya. Water 2018, 10(6), 708; https://doi.org/10.3390/w10060708.
[6]. Kamel A. H and Almula A. S. (2016) Experimental Investigation about the Effect of Sand Storage Dams on Water Quality. ZANCO Journal of Pure and Applied Sciences ZJPAS (2016) 28(2); s485-491
[7]. Johnson U. Kitheka (2016) Seasonal river channel water exchange and implications on salinity levels in sand dams: Case of semi-arid Kitui Region, Kenya. ISSN 2224-3216 (Paper) ISSN 2225-0948. Vol.6, No.12, 2016
[8]. Republic of Kenya, Makueni County (2013) Makueni County First County Integrated Development Plan 2013 – 2017. Kenya Vision 2030 Towards A Globally Competitive and Prosperous Nation.
[9]. World Health Organization, Sixty-Fourth World Health Assembly. Provisional Agenda Item 13.15 (2011). Strategies for the safe management of drinking water for human consumption. Report by the Secretariat.
[10]. Njoroge B. N. K., Murigi I. P. & Ndunge D. (2014) Monitoring of Heavy Metals in Groundwater In Makuyu Division, Maragua District. Research Inventy: International Journal Of Engineering And Science .4, 2 (PP 06-15).