Correlation and Path Analysis for Yield and
Quality Attributes in Sugarcane
Swamy Gowda S. N. Saravanan, K.
Sugarcane Breeder Professor
Zonal Agricultural Research Station, (UAS, Bangalore), V.C. Department of Genetics and Plant Breeding
Farm, Mandya - 571405, Karnataka. India Faculty of Agriculture, Annamalai University,
Annamalainagar, Tamil Nadu, India
Ravishankar. C. R.
Associate Director of Research
Zonal Agricultural Research, Station, (UAS, Bangalore), V.C. Farm, Mandya - 571405, Karnataka. India
Abstract
An investigation was conducted at the Zonal Agricultural Research Station V.C. Farm, Mandya, Karnataka, India during 2008-2009 under irrigated condition for studying correlation and path coefficient analysis in thirty selected clones of sugarcane (Saccharum spp) plant crop for yield, yield components and quality characters. Analysis of variance revealed significant difference for all the characters studied. The cane yield considered as the most important character of sugarcane was positively and significantly correlated with sugar yield, single stalk weight, number of tillers, stalk length, stalk internode length, germination percentage, number of internodes. There was also positive significant correlation of number of millable cane and stalk diameter with cane yield. Cane yield was negatively and significantly correlated with juice brix per cent and juice pol per cent, whereas, sugar yield showed positive and significant correlation with single stalk weight, cane length, stalk internode length, CCS per cent, juice pol per cent and juice purity per cent. Path coefficient analysis revealed that sugar yield and number of millable canes were major direct contributors for cane yield. Stalk diameter, germination percentage and stalk length also showed positive direct effect on cane yield. CCS per cent, juice brix per cent, single stalk weight, stalk internode length, number of tillers, juice pol per cent whereas number of internodes had negative direct effect on cane yield. The present study suggests that selection on based sugar yield, number of millable cane, stalk diameter and stalk length would be worthwhile for ameliorating over all juice pol per cent and cane yield.
Keywords: Cane yield, variability, correlation and path co efficient analysis
_______________________________________________________________________________________________________
I. INTRODUCTION
Sugarcane is one of the most important cash crops in India. Sugarcane being cultivated in 5.01 million hectares producing 348.0 million tons of cane with productivity of 69.4 ton per hectare during 2013-14 (Anon., 2014). It also boosts national economy by providing direct and indirect employment. Sugar per unit area is determined by the cane yield per unit area and juice pol per cent in juice. These two characters are influenced by their component triats in sugarcane. Complex triats like cane yield and quality are influenced by a number of characters. These characters directly and indirectly contribute to the yield. Variety is a pivotal and the cheapest technology for boosting cane production which can be accomplished by productivity through sugarcane varietal improvement programme. This investigation was taken up to study the correlation and path coefficient among different characters in a set of 30 sugarcane selected clones to understand the inter relationship among the characters and also to know the consequences of selection based on various components.
II. MATERIAL AND METHODS
This study was conducted at Zonal Agricultural Research Station V.C. Farm, Mandya, Karnataka; the experimental material was developed from biperental open pollinated and poly crosses of sugarcane fluff generated at Zonal Agricultural Research Station (UAS, Bengaluru) V.C. Farm, Mandya, and Karnataka. The experimental material for the present study consisted of 30 selected clones of sugarcane including two standards viz., Co 62175 and Co 86032 representing early and mid-late maturing groups and the experiment was laid out during August season of 2008-2009 for plant crop in randomized complete block design with two replications, each genotype planted in six rows and each row having of six-meter length with a plot size of 32.4m2. The setts
having three eye buds each were planted with three sets per meter. The crop received 250 kg N, 100kg P2O5 and 125 kg K2O
ha-1. All the recommended package of practices was adopted during the entire crop season. The crop was harvested after 12th month
of planting. The observations were recorded on five randomly tagged canes at 12th month stage. The following field and
cent, juice pol per cent, juice purity per cent, CCS per cent, sugar yield (t/ha) and cane yield (t/ha). Correlation coefficient was calculated using INSTANT software. The total correlation coefficient of various yield contributory characters with regard to cane yield was partitioned into components of direct and indirect effects following the methods adopted by Dewey and Lu (1959).
III. RESULTS AND DISCUSSION
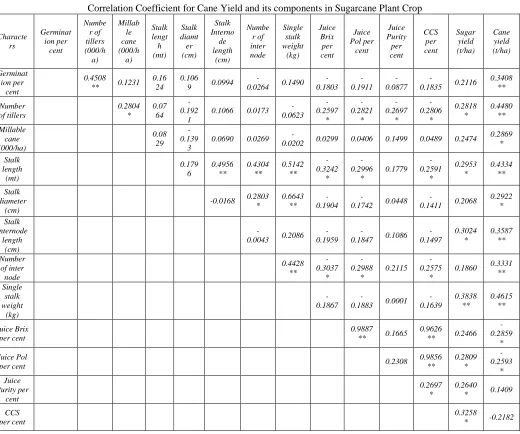
The analysis of variance for all the characters revealed the significant differences among genotypes for cane and quality triat studied indicated sufficient variability and considerable improvement can be achieved among the materials studied (Table 1). The correlation coefficient among various characters are presented in Table 2. Cane yield was positive and significant highly correlated with sugar yield (r=0.84**), single stalk weight (r=0.46**), number of tillers (r=0.44**), Stalk length (r=0.43**), stalk internode length (r=0.35**), germination percentage (r=0.34**), number of inter nodes (r=0.33**). There was also significant positive correlation of cane yield with number of millable cane (r=0.28*), stalk diameter (r=0.29*)
A Positive and highly significant correlation between cane yield and its components viz., single stalk weight, stalk length and millable cane number was reported by Brown et al., (1969) Balasundaram and Bhagyalakshmi (1978), Punia et al., (1983), Thippeswamy et al., (2003), Krishnakumar et al., (2005), Rewathy R. Choudary (2005) and Bora, G.C. (2014). Hooda et al., (1979) also observed stalk diameter having significant positive correlation with cane yield. However, highly significant positive correlation between cane yield and sugar yield was reported by Hapase, R.S. et al., (2001), Roodagi (2001) and Naveenkumar (2008)
The degree of association among the triats shows that there was a significantly higher positive correlation of germination percentage with number of tillers (r=0.45**) and cane yield (r=0.34**). Number of tillers had a significant positive correlation with number of millable cane (r=0.28*), sugar yield (r=0.28*) and cane yield (r=0.44**). A negative correlation was observed between number of tillers with stalk diameter, stalk weight and significant negative correlation was observed for quality parameters viz., juice brix per cent (- 0.25*), juice pol per cent (-0.28*), juice purity per cent (-0.26*) and CCS (-0.28*). These results were also in conformity with the findings of Reddy and Khan (1984) and Khan (1995).
Number of millable cane had positive significant correlation with cane yield (r=0.28*). The same was reported by Tyagi et al., (2012) where they found a strong association of number of stalks per plot with cane yield and number of internodes. Stalk length showed a highly significant correlation with single stalk weight (r=0.51**), stalk internode length (r=0.49**), number of internodes (r=0.43**), and cane yield (r=0.43**). Stalk diameter had a highly significant positive association with single stalk weight (r=0.66*), but it had a weak and negative correlation with length of internode which was in agreement with the results of Tyagi et al., (2012). Stalk internode length had a highly significant and positive association with cane yield (r=0.35**) and sugar yield (r=0.30*). Number of internode had a higher significant and positive association with single stalk weight (r=0.44**) and cane yield (r=0.33**) and it has significant negative correlation with juice brix per cent (r= -0.30*), juice pol per cent (r= -0.29*) and CCS per cent (r= -0.25*). Single stalk weight had showed highly significant positive correlation with cane yield (r=0.46**) sugar yield (r=0.38**) and juice brix per cent had the highest positive correlation with juice pol per cent (r=0.98**), CCS per cent (r=0.96**) and juice pol per cent had perfect correlation with CCS per cent (r=0.98**) and sugar yield (r=0.28*). CCS per cent has positive significant correlation with sugar yield (r=0.32*). Anand and Praduman (2007) also reported significantly positive correlation between juice brix per cent and juice pol per cent but not between juice brix per cent and juice purity per cent. Our data showed positive but no significant correlation between cane yield and any of the juice pol per cent related triats. However, Tyagi et al., (2012) found a strong negative correlation between pol per cent in juice and cane yield.
It is obvious that sugar yield, single stalk weight, number of tillers, stalk length, stalk internode length, germination percentage and number of internodes can be considered together in a positive direction towards an ultimate aim of developing high yielding sugarcane clones.
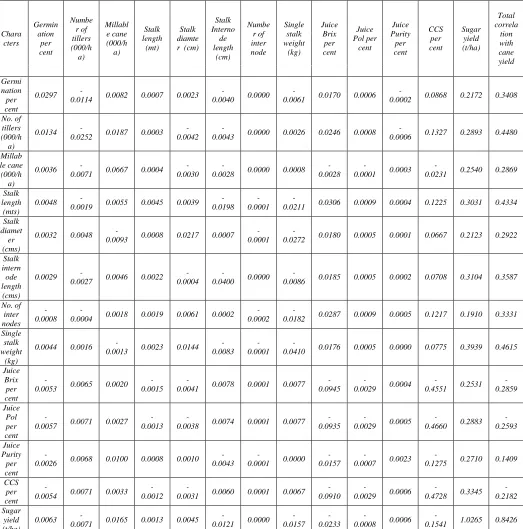
Path coefficient analysis unfolds whether the association of cane yield with its components is due to the direct effects of component characters on cane yield or is a consequence of its indirect effects via some other triats. The result of path coefficient analysis for cane yield in plant crop are presented in table 3. In the present study the path coefficient analysis was performed for cane yield as dependent variable. The highest positive direct effect on cane yield was exerted by sugar yield (1.0265) followed by number of millable canes (0.0667) and stalk diameter (0.0217). A direct effect of sugar yield on cane yield was similar to the findings of Patel et al., (1993), Das et al., (1996a), Thippeswamy et al., (2003) and Patel, K.C. et al., (2006). The results of number of millable cane on cane yield was also in conformity with the finding of Balasundaram and Bhagyalaxmi (1978), Punia et al., (1983), Kang et al., (1989), Chaudary and Singh (1994) and Patel, K.C. et al., (2006) and Chandrakanth et al., (2007). It was observed that stalk diameter and stalk length had a positive direct effect on cane yield but low magnitude the same was reported by Das et al., (1996a), Kumar et al., (2005) and Naveen Kumar et al., (2008). This implies that selection of sugarcane genotypes on the basis of sugar yield, number of millable cane, stalk diameter and stalk length would be beneficial for increased sugarcane yield. Three characters viz., sugar yield, millable cane number and stalk diameter are very important that can be considered during breeding programme.
purity per cent. Number of tillers showed negative and moderate direct effect on cane yield. The direct effect was counter balanced by the positive indirect effect through sugar yield, CCS per cent, juice brix per cent and number of millable cane.
Millable cane number showed positive and higher direct effect on cane yield. On the other hand, it had negative effect on the cane yield through number of tillers, stalk diameter, stalk internode length, juice brix per cent, juice pol per cent and CCS per cent. Stalk length was found to have a positive direct effect on cane yield. Stalk length was found to have positively contributed to the cane yield through millable cane, stalk diameter, juice brix per cent, CCS per cent and sugar yield. The indirect effect of stalk length was negative through number of tillers, stalk internode length, single stalk weight. Stalk diameter exerted direct effect on cane yield which was positive and moderate. Length of internode was found to have negative direct effect on cane yield which was counter balanced by number of millable cane, stalk length, juice brix per cent, CCS per cent and sugar yield. Number of internodes showed negative direct effect on cane yield. This negative direct effect was counter balanced through characters like millable cane, stalk length, stalk diameter, juice brix per cent, CCS per cent and sugar yield. Single stalk weight exerted negative direct effect on cane yield.
Juice brix per cent, juice pol per cent and CCS per cent exerted a negative direct effect on cane yield. Sugar yield, an important quality parameter exerted a high positive direct effect on cane yield. The sugar yield also showed indirect and positive effect on cane yield through number of millable canes, germination percent, stalk length and stalk diameter.
IV. CONCLUSION
This study revealed that the cane yield had significant positive correlation with the character viz., sugar yield, single stalk weight, number of tillers, stalk length, stalk internode length, number of internodes, the selection strategy based on these characters might result in significant genetic improvement in cane yield. The sugar yield could be improved by selection for higher juice pol per cent, CCS per cent and juice purity per cent as they had a significant positive correlation with sugar yield. The present study showed that the sugar yield, number of millable cane and stalk diameter had higher direct effect on cane yield and genotypes could be selected using a combination of these triats as a criteria in crop improvement programme.
REFERENCES
[1] Anand, P.T., and L. Praduman (2007). Correlation and path coefficient analysis in sugarcane. South Pac. J. Nat. Sci., 1: 1-10 [2] Anonymous (2014) Price Policy for Sugarcane 2015-16. Sugarcane Season. Government of India.
[3] Balasundaram N and Bhagyalakshmi, K.V., (1978). Variability, heritability and association among yield and yield components in sugarcane. Indian J. of Agric. Sci., 48 (5): 291-295.
[4] Bora G.C., Goswami, P.K. and Bordolol., (2014). Studies on variability and character association in sugarcane (Saccharum spp). Under rain fed condition of North Eastern India. Direct. Res. J. 2(5): 55-59.
[5] Brown, A.D.H., Daniels, J. and Latter, B.D.H. (1969). Quantitative genetics of sugarcane II. Correlation analysis of continuous characters in relation to hybrid sugarcane breeding. Theoretical Applied Genetics 39: 478-481.
[6] Chandrakanth, Ravikanth and Singh, P.K. (2007), screening of promising clones in early clonal generations from pol of Saccharum complex hybrids Ann. Agri. Res. New series 28 (1): 37-43.
[7] Chaudhary, A.K. and Singh, J.R.P., (1994). Correlation and path co-efficient studies in early maturing clone of sugarcane. Co-operative Sugar B25 B: 305-307.
[8] Das, P.K., Jena, B.C., Nayak, N., and Parida, A.K. 1996(a). Correlation and path analysis of cane yield in sugarcane. Co-operative Sugar, 27: 509-512. [9] Dewey D.R. and Lu KW., (1959). A correlation and path co-efficient analysis of components of crested wheat grass seed production. Agron. J.,
51:515-518.
[10] Hapase, R.S. and Repale, J.M. (2001). Genotypes X Environment interaction in sugarcane. Proc. of the 63rd Annual convention of the Sugar Technologists Association of India, 25th -27th Aug 2001: AG 7 – A105.
[11] Hooda R.S, Babu C.N. and Khairwal. L.S. (1979). Association and path analysis of nine characters in progenies of four sugarcane crosses at settling stage. Indian J. Agric. Sci,. 49: 931-933.
[12] Kang M.S. Ososa and Miller J.D., (1989). Path analysis for per cent fiber, cane and sugar yield in sugarcane. Crop Sci. 29: 1481- 1483.
[13] Khan K.A., (1995). Studies on association among yield and quality character in advanced clones in sugarcane. M.Sc. Thesis. G.B. Pant University of Agriculture and technology. Panthnagar.
[14] Krishnakumar and Singh, P.K., (2005). Selection indices in mid late maturing clones of sugarcane crop. Improv. 32 (2): 173-177. [15] Kumar, N. and Singh, J.R.P. (2005). Path analysis in sugarcane under different environmental conditions. Indian Sugar, 55 (9): 57-62.
[16] Naveenkumar. Tejbir Singh, Vinith Kumar and Dhaka R.P.S. (2008). A study on character association under different time of sowing and harvesting in sugarcane. Progr. Agril. 8 (1): 67-70.
[17] Patel, M.M., Patel, H.S., Patel, A.D., and Patel, M.D., (1993). Correlation and path analysis in sugarcane. Indian Sugar., 43: 365-368
[18] Patel, K. C., Patel, A. I., Mali, S. C., Patel, D. U. and Vashi, R. D., (2006), Variability, Correlation and Path Coefficient Analysis in Sugarcane (Saccharum Spp). Crop Res., 32(2): 213-218.
[19] Punia M.S., Padoda, R. and Hooda R.S., (1983). Correlation and path analysis of cane yield in sugarcane. Indian J. Genet. Plant bred. 43: 109-112. [20] Reddy K.R., and Khan, A.Q., (1984). Association among yield and quality characters in sugarcane. Indian J. Agric. Sci. 54 (8): 645-650. [21] Rewathy R. Chaudhary and Bal. K. Joshi (2005). Correlation and path co-efficient analysis in sugarcane. Nepal Agric. Res. J. vol 6, pp. 24-27.
[22] Roodagi, L.I., Itnal, C.J., Karabantanal, S.S. and Rachappa, V. (2001). Correlation studies and quality parameters of sugarcane as influenced by planting methods and intercropping systems. Indian Sugar J., 10 (1): 159-163.
[23] Thippeswamy, S., Kajjidoni, S.T., Salimath, P.M., Goud, J.V. (2003). Correlation and path analysis for cane yield, juice quality and their component triats in sugarcane. Sugar tech. 5 (½): 65-72.
Table - 1
Analysis of Variance Results for Cane Yield and Quality Triats in Sugarcane Sl. No. Characters MS Genotype MS error S.E ± C.V. %
1 Number of tillers (000'/ha) 2013.82** 65.76 5.73 5.13 2 Number of millable cane (000'/ha) 319.14** 24.17 3.48 4.72
3 Stalk length (m) 0.10** 0.03 0.11 6.48
4 Stalk diameter (cm) 0.20** 0.04 0.14 6.31
5 Stalk internode length (cm) 5.32** 1.45 0.85 8.82 6 Number of inter nodes 10.56** 3.99 1.41 8.56 7 Single stalk weight (kg) 0.17** 0.06 0.18 13.67
8 Juice Brix per cent 5.63** 0.11 0.23 1.84
9 Juice Pol per cent 5.35** 0.23 0.34 2.82
10 Juice Purity per cent 2.27** 0.93 0.68 1.03
11 CCS per cent 3.02** 0.20 0.32 3.73
12 Sugar yield t/ha 29.21** 1.65 0.91 6.70
13 Cane yield t/ha 1857.84** 66.44 5.76 8.06
* = 0.05 probability level ** = 0.01 probability level
Table - 2
Correlation Coefficient for Cane Yield and its components in Sugarcane Plant Crop
Characte rs Germinat ion per cent Numbe r of tillers (000/h a) Millab le cane (000/h a) Stalk lengt h (mt) Stalk diamt er (cm) Stalk Interno de length (cm) Numbe r of inter node Single stalk weight (kg) Juice Brix per cent Juice Pol per cent Juice Purity per cent CCS per cent Sugar yield (t/ha) Cane yield (t/ha) Germinat ion per cent 0.4508
** 0.1231
0.16 24
0.106
9 0.0994
-0.0264 0.1490
-0.1803 -0.1911 -0.0877
-0.1835 0.2116
0.3408 ** Number of tillers 0.2804 * 0.07 64 -0.192 1
0.1066 0.0173
-0.0623 -0.2597 * - 0.2821 * -0.2697 * -0.2806 * 0.2818 * 0.4480 ** Millable cane (000/ha) 0.08 29 -0.139 3
0.0690 0.0269
-0.0202 0.0299 0.0406 0.1499 0.0489 0.2474
0.2869 * Stalk length (mt) 0.179 6 0.4956 ** 0.4304 ** 0.5142 ** -0.3242 * -0.2996 * 0.1779 -0.2591 * 0.2953 * 0.4334 ** Stalk diameter (cm)
-0.0168 0.2803
* 0.6643 ** -0.1904
-0.1742 0.0448
-0.1411 0.2068
0.2922 * Stalk internode length (cm)
-0.0043 0.2086
-0.1959
-0.1847 0.1086
-0.1497 0.3024 * 0.3587 ** Number of inter node 0.4428 ** -0.3037 * - 0.2988 * 0.2115 -0.2575 *
0.1860 0.3331 **
Single stalk weight (kg) -0.1867
-0.1883 0.0001
-0.1639 0.3838 ** 0.4615 ** Juice Brix per cent 0.9887
** 0.1665
0.9626
** 0.2466
- 0.2859
*
Juice Pol
per cent 0.2308
0.9856 ** 0.2809 * - 0.2593 * Juice Purity per cent 0.2697 * 0.2640
* 0.1409
Sugar yield (t/ha)
0.8426 **
* = 0.05 probability level ** = 0.01 probability level
Table 3: Phenotypic Path Co-efficient showing direct and indirect effect of Quantitative and Qualitative character on Cane yield in Sugarcane Plant crop
Chara cters Germin ation per cent Numbe r of tillers (000/h a) Millabl e cane (000/h a) Stalk length (mt) Stalk diamte r (cm)
Stalk Interno de length (cm) Numbe r of inter node Single stalk weight (kg) Juice Brix per cent Juice Pol per cent Juice Purity per cent CCS per cent Sugar yield (t/ha) Total correla tion with cane yield Germi nation per cent
0.0297
-0.0114 0.0082 0.0007 0.0023
-0.0040 0.0000
-0.0061 0.0170 0.0006
-0.0002 0.0868 0.2172 0.3408
No. of tillers (000/h a)
0.0134
-0.0252 0.0187 0.0003
-0.0042
-0.0043 0.0000 0.0026 0.0246 0.0008
-0.0006 0.1327 0.2893 0.4480
Millab le cane
(000/h a)
0.0036
-0.0071 0.0667 0.0004
-0.0030
-0.0028 0.0000 0.0008
-0.0028
-0.0001 0.0003
-0.0231 0.2540 0.2869
Stalk length
(mts)
0.0048
-0.0019 0.0055 0.0045 0.0039
-0.0198
-0.0001
-0.0211 0.0306 0.0009 0.0004 0.1225 0.3031 0.4334
Stalk diamet er (cms)
0.0032 0.0048
-0.0093 0.0008 0.0217 0.0007
-0.0001
-0.0272 0.0180 0.0005 0.0001 0.0667 0.2123 0.2922
Stalk intern ode length
(cms)
0.0029
-0.0027 0.0046 0.0022
-0.0004
-0.0400 0.0000
-0.0086 0.0185 0.0005 0.0002 0.0708 0.3104 0.3587
No. of inter nodes -0.0008
-0.0004 0.0018 0.0019 0.0061 0.0002
-0.0002
-0.0182 0.0287 0.0009 0.0005 0.1217 0.1910 0.3331
Single stalk weight
(kg)
0.0044 0.0016
-0.0013 0.0023 0.0144
-0.0083
-0.0001
-0.0410 0.0176 0.0005 0.0000 0.0775 0.3939 0.4615
Juice Brix per cent
-0.0053 0.0065 0.0020
-0.0015
-0.0041 0.0078 0.0001 0.0077
-0.0945
-0.0029 0.0004
-0.4551 0.2531
-0.2859 Juice Pol per cent
-0.0057 0.0071 0.0027
-0.0013
-0.0038 0.0074 0.0001 0.0077
-0.0935
-0.0029 0.0005
-0.4660 0.2883
-0.2593 Juice Purity per cent
-0.0026 0.0068 0.0100 0.0008 0.0010
-0.0043
-0.0001 0.0000
-0.0157
-0.0007 0.0023
-0.1275 0.2710 0.1409
CCS per cent
-0.0054 0.0071 0.0033
-0.0012
-0.0031 0.0060 0.0001 0.0067
-0.0910
-0.0029 0.0006
-0.4728 0.3345
-0.2182
Sugar yield (t/ha)
0.0063
-0.0071 0.0165 0.0013 0.0045
-0.0121 0.0000
-0.0157
-0.0233
-0.0008 0.0006
-0.1541 1.0265 0.8426