Vehicle Usage Pattern
Femina A
Assistant Professor
Department of Chemical Engineering TKM College of engineering, Kollam, Kerala, India
Abstract
Our environment has been polluted due to various reasons. Depletion of air quality is an alarming factor in developing countries like India. The population growth, rapid industrialization, increase in vehicle volume, natural and anthropological activities, etc are some of the reasons. Among the above factors vehicles are considered as the major contributors for air pollution. More than that the type of vehicles, distance travelled, their usage patterns and congested roads also play major roles for the evolution of various type of harmful pollutants from vehicles. Congested roads are mainly due to more number of two wheelers and three wheelers. This is part of the work associated with Central Pollution Control Boards (CPCB) National Ambient Air Quality Monitoring (NAMP) Network project. Here in this paper one particular location in Chennai city is taken for the study to find the mostly used vehicle type and the vehicle usage pattern and the study observed that more than 50% of the vehicles on the road are two wheelers and most of the 2 stroke two wheelers are used by ladies.
Keywords: Environment, National Ambient Air Quality Monitoring, Pollutants, Usage Pattern, Two Wheelers
________________________________________________________________________________________________________
I. INTRODUCTION
Now a day’s people in India are suffering from various health issues because of poor air and water. Global warming, climate change, greenhouse effect etc are the other challenging issues. Our water resources and atmosphere are polluted in various ways because of population growth, rapid industrialization, increase in vehicle volume, modern life style, natural and anthropological activities, etc. The quality of air we breathe consists of 78% nitrogen, 21% oxygen, 1% argon and 0.03% carbon dioxide by volume. The addition of foreign materials produced from the above activities will alter this quality. The resulting unbalanced air initiates unwanted photochemical atmospheric reactions and causes formation of harmful products and highly reactive reaction intermediates like ions. According to World Bank and Asian Development Bank joint study of air pollution for 20 major Asian cities between 2000 and 2003, Delhi is the most polluted city of the Asia [1]. The urban areas are considered the most polluted cities in the world in an air quality status point of view (CPCB, 2000; CPCB, 2001; TERI, 2001)[2]. Air pollution from transport sector has also become a major contributor to increasing human health effects in Asia. Petrol and Diesel vehicles are the main contributor as 84% and 81% for vehicular emission of CO and PM10 respectively. Vehicular source is found to be the main contributor as 76%, 26% and 25% of total CO, PM10 and NOx emissions respectively [3].
Air pollution problems exists in five different scales – local (up to about 5km), urban (up to 50km), regional (50-500km), continentals (from 500 to several thousand km) and global scale extends worldwide. Pollution of the atmosphere increases almost directly to the population density. The intensity of pollution problem is usually related to the amount of pollutants emitted into the atmosphere and to the atmospheric conditions that exist. Most serious situations develop when local conditions favour atmospheric inversions and the products of combustion and industrial processing are contained within a confined air mass. The pollution from motor vehicles has become an issue because of the steady increase in both the number of vehicles in use and the distance travelled by each vehicle in each year. More than that the other reasons for increasing vehicular pollution is the types of engines used, age of vehicles, congested traffic, poor road conditions, and outdated automotive technologies and traffic management systems[4]. The contribution as well as character of the pollutants varies according to fuel composition and their mode of application. The technology development, awareness at different levels, the legislature by enhancing laws and its effective implementation reduces the pollution to a considerable level. Besides this standards and legislations, air pollution due to vehicular emissions are increasing in alarming levels due to expansion of city, increase in vehicle volume and distance travelled by each vehicle, life style and climate change. For these reasons emissions from road traffic must be estimated as accurately as possible.
II. METHODOLOGY
Selection of Study Area:
Indian Institute of Technology Madras (IITM) campus, which is located right at the centre of the Chennai metropolitan city on the Sardar Patel Road, midway between the Raj Bhavan and Adyar bus terminus and flanked by Adyar, Taramani and Velachery. Other landmarks include: the Guindy Snake Park near the IIT main gate and the Central Leather Research Institute (CLRI) opposite to the IIT campus. The climate is generally hot and humid. In summer (May-July) the temperature reaches up to 420C while in
winter (December- February) it is slightly less hot, 180C. The Monsoon season starts in September and lasts till November.
Land Use Pattern and Major Roads:
The entire 247.3 ha (1 hectare = 2.471 acres,) of land has been divided into four zones such as Academic zone, Residential zone, Hostel zone and wilderness zone. Each of these zones are comparable in size (approximately 60ha), though not in shape, configuration or topography. The wilderness zone is spread over the entire campus.
The residential institute which is providing accommodation to its students, faculty, administrative and supporting staff and their families. Catering to the needs of the student population and other on-campus residents are the banks, shopping centres, food joints, schools, hospital etc. which virtually make the campus self-contained. The Institute has two guest houses within the campus. One is used for accommodating participants attending seminars and short-term courses and other official visits. Parents visiting the institute to meet their wards can also avail accommodation this Guest House. Another one is usually used for accommodating VIPs, Institute guests and invited guests.
Two main parallel roads in the campus, Bonn Avenue and Delhi Avenue - connect the in/out gate of the campus and academic/hostel zones via Gajendra Circle (GC), main traffic intersection point in the campus. Main mode of transportation in IITM campus is, for hostel inmates, bicycle but residents in quarters and residents outside the campus are mostly using powered vehicles. Institute runs battery operated and diesel buses from gate to other locations at regular intervals from 6.15am to 10pm through Bonn Avenue, Alumini Avenue and Hostel Road. Private vehicles coming from outside are directed through Delhi Avenue to academic and hostel zone. Madras Avenue connects residential zone with academic zone. But people are mostly using Bonn Avenue which connects schools, kindergarten/play class, Banks, shopping complex etc.
Table – 1
List of Roads and Its Length
Major roads Length of roads (m)
Madras avenue (MA) 1995
Bonn avenue (BA) 1886
Delhi avenue (DA) 1739
Alumini avenue (AA) 1322
Hostel Road (HA) 1284
Vehicle Usage Pattern:
Questionnaire circulated among the people in department and administrative office, total vehicles registered in the campus taken from the transportation section, hourly data of vehicles coming to and going out from the campus taken by manual counting from selected sites and vehicle parked in academic section and residential section collected separately based on model and kind of vehicles are used for analysing and comparing the vehicle usage pattern of people.
III. RESULTS AND DISCUSSION
Questionnaire Survey:
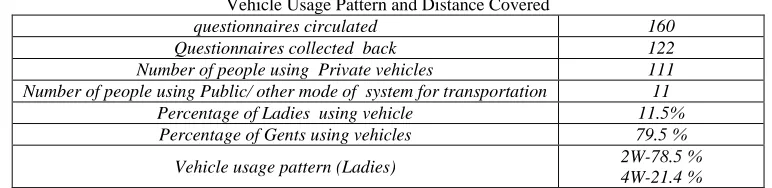
Questionnaire survey is conducted for getting idea about the vehicle usage pattern, fuel consumption for vehicles, vehicle mileage etc. The data collected shows that 79.5% of gents and 11.5% ladies are using vehicles. Among the total 11.5% ladies, 78.5% are using 2W and 21.4% using 4W vehicles. In the case of gents 82.47% are using 2W in that 30% are scooter and 70% are motor cycle and 17.53% 4W.
Table – 2
Vehicle Usage Pattern and Distance Covered
questionnaires circulated 160
Questionnaires collected back 122
Number of people using Private vehicles 111
Number of people using Public/ other mode of system for transportation 11
Percentage of Ladies using vehicle 11.5%
Percentage of Gents using vehicles 79.5 %
Vehicle usage pattern (Gents)
2W - 82.47 % 4W - 17.53% Scooter - 30.00 % Motorcycle - 70.00 %
Average Distance covered per day (Ladies) 14.805 Km/day
Average Distance covered per day (Gents) 17.74 Km/day
The distance traveled by the ladies is less than gents, but the fuel consumption is more for ladies. This is because ladies are using 2 stroke vehicles with less mileage and less efficiency (incomplete combustion and loss of fuel leads to HC emissions). 70% of the gents are using 2W motorcycles. Almost all motorcycles are having 4 stroke engines with good mileage (2 times than 2S engines).
Parking Volume Study:
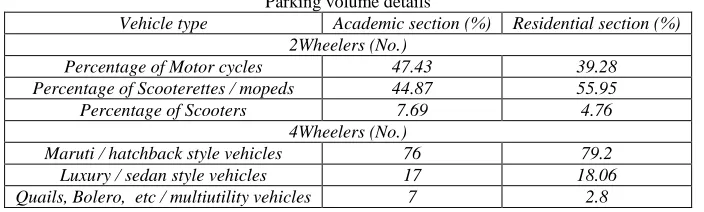
Among the total vehicles registered in the campus 80.8% are two wheelers and remaining four wheelers. The percentages of vehicles for 2W are distributed based on academic section parking volume study and for 3W and 4W vehicles percentages are distributed based on the type, engine capacity and fuel type of the vehicles coming inside the campus. This kind of classification has been carried out mainly because of the importance of academic activity in the campus. Both residential section parking volume and academic section parking volume study are used for determining the vehicle usage pattern among people inside and outside IITM. Vehicle count in Velacherry gate is also listed, where only 2W vehicles are permitted. The vehicles are categorised on the basis of CPCB emission factor document.
Table – 4 Parking volume details
Vehicle type Academic section (%) Residential section (%)
2Wheelers (No.)
Percentage of Motor cycles 47.43 39.28
Percentage of Scooterettes / mopeds 44.87 55.95
Percentage of Scooters 7.69 4.76
4Wheelers (No.)
Maruti / hatchback style vehicles 76 79.2
Luxury / sedan style vehicles 17 18.06
Quails, Bolero, etc / multiutility vehicles 7 2.8
Vehicle Load in Campus Roads:
Fig. 1: Hourly vehicle characteristics during Week days
Fig. 2: Percentage contribution of vehicles during Week days
Vehicle characteristics in Bonn Avenue Road-Weekdays
0 10 20 30 40 50 60 70 80 90 100 0-1am 2-3 am 4-5 am 6-7 am 8-9 am 10-11 a m 12-13 pm 14-15 pm 16-17 pm 18-19 pm 20-21 pm 22-23 pm Time N o of ve h ic le s
2W 3W P 3W D 4W P 4W D
Vehicle characteristics in Delhi Avenue Road - Weekdays
0 10 20 30 40 50 60 70 80 0-1am 2-3 am 4-5 am 6-7 am 8-9 am 10-11 a m 12-13 pm 14-15 pm 16-17 pm 18-19 pm 20-21 pm 22-23 pm Time N o of ve h ic le s
2W 3W P 3W D 4W P 4W D
Ve hicle characte ris tics in Alumini Ave nue Road - We e kdays
0 10 20 30 40 50 60 70 0-1am 2-3 am 4-5 am 6-7 am 8-9 am 10-11 a m 12-13 pm 14-15 pm 16-17 pm 18-19 pm 20-21 pm 22-23 pm Time N o. o f ve h ic le s
2W 3W P 3W D 4W P 4W D
Ve hicle characte ristics in Hoste l Road - We e kdays
0 10 20 30 40 50 60 70 80 90 0-1am 2-3 am 4-5 am 6-7 am 8-9 am 10-11 am 12-13 p m 14-15 p m 16-17 p m 18-19 p m 20-21 p m 22-23 p m Time N o. of V eh ic le s
2W 3W P 3W D 4W P 4W D
% of vehicles Bonn Avenue Road - Weekdays
2W 58% 3W P 22% 3W D 8% 4W P 10% 4W D 2%
% of Vehicles Delhi Avenue - Weekdays
2W 50% 3W P 30% 3W D 3% 4W P 15% 4W D 2%
% of vehicles in Alumini Avenue - Weekdays
2W 75% 4W D 3% 3W D 0% 3W P 3% 4W P 19%
% of vehicles in Hostel Road - Weekdays
More people are moving out / in to the campus using private vehicles, (4W-P) mostly from quarters and from hostels using 3Wheelers, 4W-D or taxis (most of the taxis are running with diesel fuel).
In AA and HA the peaks are spreaded over the entire day with different vehicle counts. This vehicular concentration depends upon the availability of the students and their visitor’s movement in the campus and also other activities inside the campus.
Fig. 3: vehicle volume and Percentage contribution of vehicles during Week days, Saturdays and Sundays in Velacherry road.
During Sundays total vehicle count in all roads are very less compared to Week days. Afternoon peak is almost same as that of other days (6-7pm) in all the roads. The peak observed in BA between 8am - 10am shows people are going for prayers in Sunday morning. 4W-P vehicles also show some peak during these hours in BA and DA. Sundays the percentage contribution of vehicles is almost in mixed nature.
The vehicle volume in Velacherry gate at different days (Weekday, Saturday and Sunday) are also plotted. Here in all days two wheeler motorcycles are dominating with second and third preferences for scooters and mopeds respectively. Among the two wheelers, motorcycles are dominating. Its count is around 2times than scooters and 3times than mopeds in all days. Here the morning peak time is coming around 10am and afternoon peak around 3pm.
Vehicle pattern in Velacherry gate- Week days
0 50 100 150 200 250 7-8 am 8-9 am 9-10 a m 10-11 a m 11-12 a m 12-13 pm 13-14 pm 14-15 pm 15-16 pm 16-17 pm 17-17.3 0 p m Time N o of ve h ic le s
scooters/ mopeds mopeds (<80cc ) motorcycles
Vehicle pattern in Velacherry gate saturday
0 20 40 60 80 100 120 140 8-9 a m 9-10 a m 10-11 a m 11-12 a m 12-13 p m 13-14 p m 14-15 p m 15-16 p m 16-17 p m Time N o of ve hi cl es
scooters/ mopeds mopeds (<80cc ) motorcycles
% category of vehicles weekdays
scooters 29%
mopeds (<80cc ) 16% motorcycles
55%
% category of vehicles Saturday
motorcycles 57%
scooters 25%
mopeds (<80cc ) 18%
Vehicle pattern in Velacherry gate sunday
0 20 40 60 80 100 120 7 -8 a m 8 -9 a m 9 -1 0 a m 1 0 -1 1 a m 1 1 -1 2 a m 1 2 -1 3 p m 1 3 -1 4 p m 1 4 -1 5 p m 1 5 -1 6 p m Time N o o f v e h ic le s
scooters/ mopeds mopeds (<80cc ) motorcycles
% category of vehicles sunday
mopeds (<80cc ) 17% motorcycles
54%
IV. CONCLUSION
The study conducted in IITM Campus shows that more than 50 percent of people are using two wheelers and among that gents are using 4 stroke motor cycles and most of the ladies are using 2 stroke engines. During the peak times vehicle count in campus roads are very high in working days.
REFERENCES
[1] (http://cities.expressindia.com/).
[2] Project Rep No.: AFL/2006-07/IOCL/Emission Factor Project/Final Rep dt. August 17, 2007, The Automotive Research Association Of India(ARAI), Air Quality Monitoring Project-Indian Clean Air Programme (ICAP)
[3] http://www.geiacenter.org/sites/default/files/site/community/geiaconferences/2014/presentations/Day_1_Session_10_Posters_Session_Posters_to_Post/34_ Anikender_Kumar_Presented_by_Nestor_Rojas_POST.pdf
[4] http://cpcb.nic.in/sourceapportionmentstudies.pdf [5] http://www.cpcb.nic.in/Emission_Factors_Vehicles.pdf
[6] ARAI (The Automotive Research Association of India) (2007). Air Quality Monitoring Project-Indian Clean Air Programme (ICAP), Draft Report on “Emission Factor Development for Indian Vehicles” as a part of ambient air quality monitoring and emission source apportionment studies.