Vol. 05, Issue 08 (August. 2015), ||V3|| PP 31-35
Application of multiple attribute and geostatistics inversion to predict reservoir in the A
area, songliao basin
Yushuang Hu
1,Lei Wang
1, Zhiming Zhang
1Shiqin Zhang
1 1. Northeast Petroleum University, Daqing, Heilongjiang, China, 163318Abstract: The A area is located in the songliao basin, the target layer of fuyu formation is characterized by thin
reservoir thickness, transverse change fast, impedance overlapping of reservoir and surrounding rock, which lead
to difficult reservoir prediction. According to the application of the integration of seismic data, logging data,
drilling, logging, testing data, the high precision earth's physical parameters can reflect the reservoir lateral
variation, and depict the basic characteristics of the reservoir depict the basic characteristics of reservoir. For
geophysical conditions, optimizing coherent, frequency division attribute qualitative prediction of fuyu reservoir
sand body distribution rule of every sand formation. Quantitative prediction of geostatistics inversion in this
research area of every sand formation sand body distribution, combine with well logging and testing data, which is
well matching with the existing drilling and provide a reference for the further oil and gas exploration.
Keywords: coherent; frequency division; geostatistical inversion; reservoir prediction
I.
INTRODUCTION
As the further exploration work, the oil and gas exploration work of some fields has entered into the late
development stage. Complex geological conditions make the exploration more and more difficulty. Thin
reservoirs and residual oil exploration has become the direction of reservoir prediction. Based on the seismic data
and other geological data, reservoir prediction technology aims to predict the geological characteristics of
reservoir [1].
The target area have the characteristics of thin, horizontal change fast, impedance overlapping of
reservoir and surrounding rock, which lead to difficult reservoir prediction. The conventional post-stack
impedance inversion can't meet the requirements. This requires that we study the higher resolution inversion
method, which is the integration of seismic data, logging data, drilling, logging and testing and so on. Thus, we
can get higher precision physical parameters that can reflect the reservoir lateral variation and depict the basic
characteristics of reservoir.For geophysical conditions, combining the coherent properties, such as frequency
properties prediction in fuyu reservoir qualitatively predict the sand body distribution rule of every sand formation.
In this research area, we use the geostatistics inversion to quantitative prediction the distribution of every sand
formation. The existing drilling matching effect is good. This provides a reference for the further oil and gas
exploration.
II.
GEOLOGICAL SURVEY
The study area is located in songliao basin. The area’s structure, reservoir physical property and lithology is complex, thin and poor physical property. Fuyu reservoir in overall in the depression slowly settling,
the base-level cycle rise process, flat basin terrain, around the river basin development, broad river sedimentary
formation, development of large rivers, shallow-water delta sedimentary system, mainly including meandering
river, braided river and distributary channel, etc.
Fuyu reservoir in the study area mainly study F1 reservoir group (divided into F11, F12, and F13) and
block structure show the type of “high middle and low surrounding”. The middle part develop less fracture, the fracture development in the northeast and west dense, more secondary structure formation, has transform for oil
and gas gathering and the role of the reservoir.
Fig.1 Seismic profile cross well1-well2-well3
III.
RESERVOIR PREDICTION
3.1 Seismic attribute analysis
Through the application and research of comprehensive analysis and all kinds of algorithms, seismic
attribute technology extract the special information from software system, storage, visualization, analysis,
verification and evaluation of seismic attributes and converts seismic attributes to reservoir characteristics of a
set of methods[2].
At present, seismic attribute can be extracted from seismic data nearly hundred kinds, such as
amplitude, frequency spectrum. Based on the characteristics of stratum in this area, the writer chose the good
correlation between the reservoir development in the study area and two seismic attributes: coherent and
frequency division attribute.
Coherent analysis is developed in the 1990s, a 3d seismic data interpretation method multichannel
seismic data is a measure of similarity degree between years of practice has proved that three dimensional
seismic coherent data as a method of seismic data interpretation methods in determining fracture development
zone, formation lithology, stratigraphic unconformity, the respect such as stratigraphic pinchout is quite
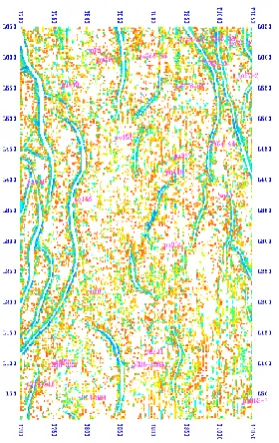
Fig2 50 Hz frequency division properties of
F11, A area
Fig 3 coherent properties of F11, A area
Frequency division interpretation technique is based on short-time window Fourier transform (DFT) or
the maximum entropy spectrum based on Z transform method (MEM). The seismic data are transformed into
frequency domain[3]. Reflex in frequency domain have instructions from the thin layer characterized time stratigraphic thickness. Seismic wavelet is generally across multiple layers rather than a simple thin layer, led to
the complex tuning reflection, and this kind of tuning reflection has a unique frequency domain response. Due to
the tune of reflection amplitude spectrum interference pattern determines the reflection of the relationship
between the individual formation acoustic characteristics, so the amplitude spectrum can be used to describe the
change of the thin layer, phase spectrum can be used to detect geological lateral discontinuity. After spectrum
decomposition, every single frequency spectrum is corresponding to the tuning amplitude and different
frequency is corresponding to different tuning thickness[4]. Time of strata thickness can be determined according to the Rayleigh criterion. Similar with other seismic inversion methods, the thickness of the formation time of
calculation results must be corrected. But the determination of the relative thickness can be decided according to the frequency directly. The formation F11 of A area’s coherent and frequency division attribute as shown in figure 2, figure 3.
3.2 Geostatistical inversion
Conventional deterministic inversion method produces a single best with certain seismic
high-resolution impedance model. The result of the vertical resolution is usually a few meters, which is
determined by the bandwidth of the earthquake. Thus, thin multilateral sand and shale is difficult to identify.
Geostatistical inversion provides a set of broadband model and it is able to deal with small size heterogeneity.
Geostatistical inversion is a method of combined stochastic simulation theory and seismic inversion, which is
consists of stochastic simulation process and optimize the simulation results and make it conform to the process
of seismic data. Geostatistical inversion integrates the advantages of seismic inversion, reservoir modeling and
make full use of seismic data and well logging data to calculate multiple equal probability impedance. At
present, more mature geostatistical inversion method is based on sequential Gaussian simulation method of
geostatistics inversion. For the realization of the multiple P-wave impedance, the identical methods are various,
calculation results of P-wave impedance; (2) During wells, the results conform to the seismic data and
geological statistical characteristics of the known data. Formation grid model is established by interpreting the
results, the normalized processing logging curve (the histogram of GR curve after normalization processing as
shown in figure 4). Through the analysis of rock physics, (GR curve intersection analysis as shown in figure 5)
the geostatistical inversion parameters can be ensured. Combining with seismic data to calculate the inversion
body, lithology, probability can be obtained (Prestack S- impedance inversion profile cross well 4 and well 5 as
shown in figure 6).
Fig 4 Histogram of GR curve after normalization
processing, A area
Fig 5 GR convergence analysis of A area
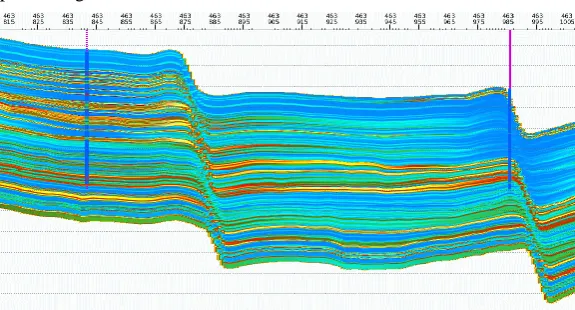
Fig 6 Prestack S-impedance inversion profile cross well 4 and well5
By calculating the relative errors denoting the difference between the measuring values and the
prediction outputs, we can get the results that the prediction value is closed to the drilling value. The results
show that the average absolute error is 2.3m; the maximum absolute error is 8m and the average error is 13%.
The result shows that the geostatistical inversion method is effective in reservoir prediction in the region.
IV.
CHARACTERISTICS OF RESERVOIR DISTRIBUTION
The upper two groups of Fuyu reservoir are divided into five small oil layers by seismic comprehensive
interpretation. Considering the characteristics of this research area, each thin layer sandstone extension and
deposit micro-facies are described and calibrated based on attributes and geostatistical inversion results and
reservoir distribution characteristics in the study area is determined. Reservoir prediction results show that F11
reservoir mainly distributed in the central in band, mainly the North-East direction. The band moves eastward in
V.
CONCLUSION
5.1 Coherent attribute and frequency division attribute interpretation technology is an effective means of
reservoir prediction, it conduces to improve and enhance the accuracy of the results of seismic data and the
qualitative prediction of reservoir distribution.
5.2 The method of geostatistics inversion combination with seismic, logging and geological data can
quantitatively predict the distribution of reservoir. The predicting results agree with the drilling data shows that
the method can effectively predict reservoir distribution rules in the region.
REFERENCES
[1] Greg P, James G, John L. Interpretational application of spectral decomposition in reservoir characterization [J]. The Lead-ing Edge,1999.18 (3):353一360.
[2] Cai Gang, Lu Ximin, Su Mingjun. etc. Application of frequency spectrum decomposition technique in exploration in the Junggar basin [J]. Natural gas industry, 2006, 26(4):35-37.
[3] Michael J. Zeitlin. How 3-D visualization will change interpretation strategies in future oil companies[J], The Leading Edge, 2001, 20 (12),1370.