Application of HOMER Software in Wind and
Solar Resources Integration
T. Tharankumar B. Sajitha
Assistant Professor Assistant Professor
Department of Electrical & Electronics Engineering Department of Electrical & Electronics Engineering Akshaya College of Engineering and Technology,
Coimbatore 642109, India
SNS College of Engineering, Coimbatore 641107, India
Abstract
Renewable energy sources are seasonal and they generate power quality problems in the grid connected system. The fluctuation of power at each wind turbine is affected by the turbine type, control algorithm, difference in wind speed, and the tower shadow effect. PV (Photo Voltaic) scheme rely on various factors that comprise solar intensity, cell temperature, cloud/partial shading, and selection of power semiconductor devices. Thus, power density of these renewable resources that changes over the period potentially direct to impulsive power quality disturbances like voltage sag/swell along with power flow. These issues are to be reduced and the grid is to be operated at rated frequency. A 15kW integrated wind and solar system is proposed which then connects to the grid. A battery backup is used to improve the system performance by storing the excess energy and using when it is needed. Simulation of the proposed system is done by using HOMER software. The optimal solution of integrated wind and solar system which is linked to the grid is obtained through simulation. The obtained data will be very useful for real time implementation of the system.
Keywords: grid; HOMER; Integrated Resource; PV; Renewable; Simulation; Solar, Wind
________________________________________________________________________________________________________
I. INTRODUCTION
The possibility of generating substantial amounts of energy is offered by wind energy. Consumer load is continuous and varies throughout the day. The power available from wind generator is variable due to fluctuating wind velocity. Voltage and power fluctuations resulting from random wind velocity and load changes can be a problem, particularly where fault levels are low. Remote area power supplies are characterized by low inertia, low damping and poor reactive power support.
Photovoltaic technology provides an attractive method of power generation and meets the criteria of clean energy and sustainability. Advanced research is still in progress to increase the efficiency of photovoltaic cells and optimize the production of energy through minimization of power losses and better utilization of incident solar irradiance. The efficiency and proper operation of photovoltaic systems depends on a number of factors. Environmental conditions as well as system design constitute the most important factors in the operation of the PV systems and these can have a significant impact on the efficiency and power quality response of the whole system.
II. SOLAR CONNECTED TO GRID
The variable power flow due to the fluctuation of solar irradiance, temperature and choice of power semiconductor devices are some of the parameters that affect the power quality of photovoltaic systems. Good power quality translates into obtaining a sinusoidal voltage and current output from a photovoltaic system in order to avoid harmonics, inter harmonics and eventually voltage distortion. With high connection densities of photo voltaic in the distribution grid, low irradiance can lead to undesirable variations of power and supply quality (voltage and current) at the connection point which might even exceed acceptable limits that are set out by the respective grid codes. Aspects related to the quality of electricity as generated from the inverter, which is the element in a PV system responsible for converting the DC power to AC, are also important. The circuit topology of the inverter can determine the behavior and the power characteristics, during input and output changes. In addition, large quantities of photovoltaic inverters can give rise to power quality problems on networks, even when inverters comply with standards. Such behavior, characterized by low power quality, is often troublesome because it prevents reliable equipment operation and causes failure of sensitive electronic devices.
The figure shows two stage conversion process. The PV array generates the DC output which is stored in a battery. The output DC is converted to AC with the help of the inverter circuitry arrangement. The boost converter is employed here to covert variable DC to fix DC, which gives a constant output irrespective of change in input.
Conversion Stages
1) Photovoltaic DC to chopper 2) Chopper to battery
Fig. 1: Grid connected solar system
III. WIND SYSTEM CONNECTED TO GRID
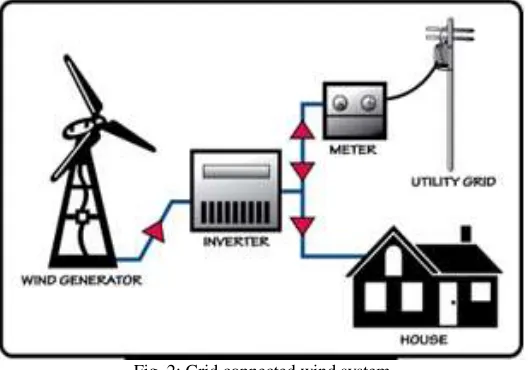
The wind turbines generate power by rotating a permanent magnet generator which generates three phase AC at the frequency of the turbine’s rotation. The AC power from the generator is not only the wrong voltage to be connected to the local power grid, but also, as the wind speed changes so do the rotational speed of the turbine, and therefore the frequency of the power generated. The power from the generator therefore needs to be converted to DC and then fed into a special electronic device called an inverter, to ensure that it is always at the correct frequency and voltage to the local grid.
The power generated will be first used by your own property, thereby saving you the maximum amount possible on your electricity bill. Any excess energy your wind turbine generates, e.g. on windy days or at night, is “spilled” to the power grid and your electricity supplier pays you for it. In order to charge your electricity supplier for any energy that you export to the grid, you need to have a new bi-directional electricity meter installed which will work both when you buy (import) and sell (export) electricity. Depending upon your local requirements, there may be additional meters needed to record energy generation to enable a claim for a Government subsidy.
Fig. 2: Grid connected wind system
IV. SOLAR AND WIND SYSTEM CONNECTED TO GRID
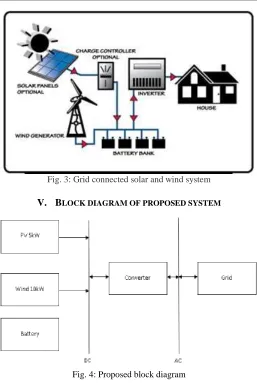
Combining Wind Turbine and Solar Panels into a hybrid system offers several advantages. In many places, wind speeds are low in the summer when the sun is plentiful. The wind is strong in the winter when less sunlight is available. Because the peak operating times for wind and solar systems occur at different times of the day and year, hybrid systems are better balanced and more likely to produce power when you need it.
Fig. 3: Grid connected solar and wind system
V. BLOCK DIAGRAM OF PROPOSED SYSTEM
Fig. 4: Proposed block diagram
The proposed block diagram represents the 15kW grid connected solar and wind system. A 5kW solar panel is integrated to 10kW wind energy through a DC bus bar. A battery system is provided in additional to store the excess energy which can be used when there is a need. A suitable converter is used for conversion of DC source into AC before connecting to the grid through the AC bus bar.
VI. SIMULATION SOFTWARE
HOMER is a micro power optimization model which simplifies the task of evaluating designs of both off-grid and grid-connected power systems for a variety of applications. HOMER's optimization and sensitivity analysis algorithms make it easier to evaluate the many possible system configurations. HOMER simulates the operation of a system by making energy balance calculations in each time step of the year.
HOMER performs these energy balance calculations for each system configuration that needs to be considered. It then determines whether a configuration is feasible, i.e., whether it can meet the electricity demand under the specified conditions and estimates the cost of installing and operating the system over the lifetime of the project. The system cost calculations account for costs such as capital, replacement, operation and maintenance, fuel, and interest.
After simulating all of the possible system configurations, HOMER displays a list of configurations, sorted by net present cost (sometimes called life cycle cost), that can be used to compare system design options.
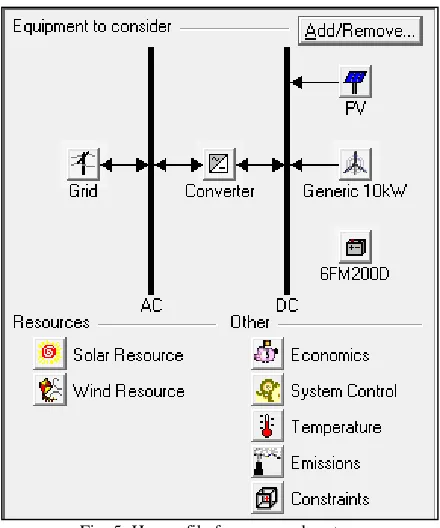
Fig. 5: Homer file for proposed system
VII. ENTERING LOAD DETAILS FOR VARIOUS EQUIPMENT PV PANEL
A 5kW panel is considered for the proposed system with efficiency during standard test condition is 16.5%. The following specifications are mentioned for obtaining best results.
Table - 1 PV panel specification Life time (in years) 20
Derating factor 80
Tracking system Two Axis
Wind Turbine Inputs
Table - 2 Wind turbine inputs Turbine Type Generic 10kW
Rated Power 10kW DC
Life Time 15years
Hub Height 25m
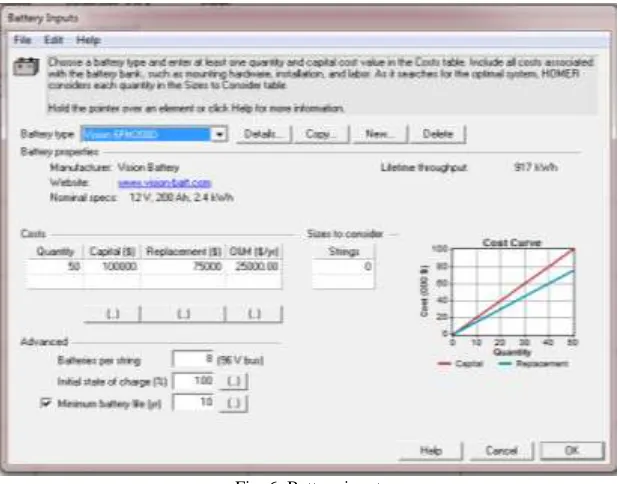
Battery Input
Table - 3 Battery input
Voltage 12V
Ampere Hour 200Ah
Fig. 6: Battery input
Inverter Input
Fig. 7: Converter input
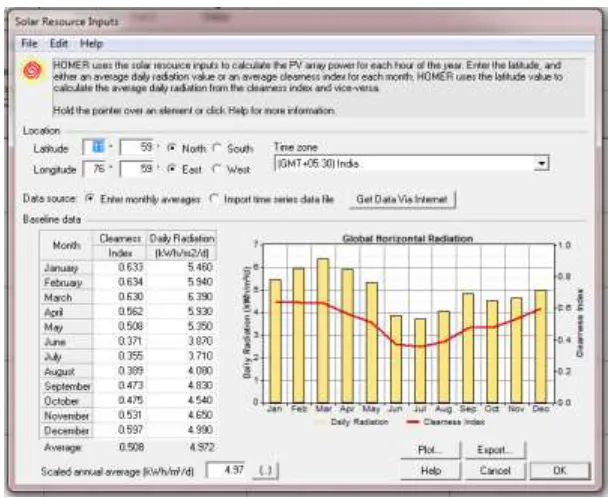
Solar Resources
Table - 4 Panel Installation location Location
Latitude 11059’N
Longitude 76059’E
Fig. 8: Solar resource inputs
Wind Resource Input
Annual Average Wind Speed (m/s): 3.94
Fig. 9: Wind resource input
VIII. RESULTS
Homer Input Summary
Table - 5
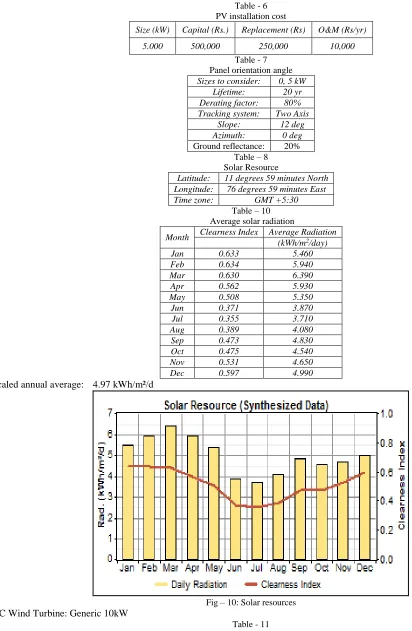
Table - 6 PV installation cost
Size (kW) Capital (Rs.) Replacement (Rs) O&M (Rs/yr)
5.000 500,000 250,000 10,000
Table - 7 Panel orientation angle Sizes to consider: 0, 5 kW
Lifetime: 20 yr Derating factor: 80% Tracking system: Two Axis
Slope: 12 deg Azimuth: 0 deg Ground reflectance: 20%
Table – 8 Solar Resource
Latitude: 11 degrees 59 minutes North Longitude: 76 degrees 59 minutes East Time zone: GMT +5:30
Table – 10 Average solar radiation
Month Clearness Index Average Radiation (kWh/m2/day)
Jan 0.633 5.460
Feb 0.634 5.940
Mar 0.630 6.390
Apr 0.562 5.930
May 0.508 5.350
Jun 0.371 3.870
Jul 0.355 3.710
Aug 0.389 4.080
Sep 0.473 4.830
Oct 0.475 4.540
Nov 0.531 4.650
Dec 0.597 4.990
Scaled annual average: 4.97 kWh/m²/d
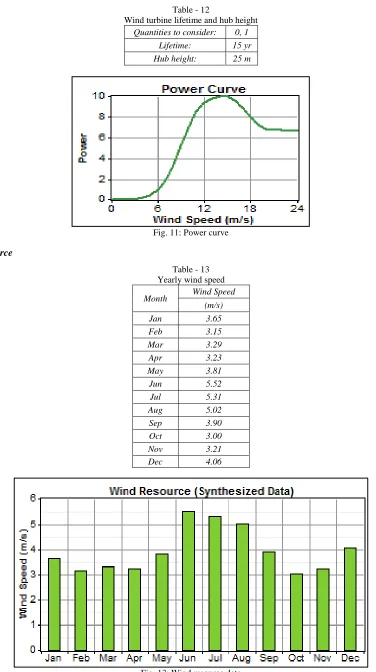
Fig – 10: Solar resources DC Wind Turbine: Generic 10kW
Table - 11 Wind installation cost
Quantity Capital ($) Replacement ($) O&M ($/yr)
Fig. 11: Power curve
Wind Resource
Table - 13 Yearly wind speed
Month Wind Speed (m/s)
Jan 3.65
Feb 3.15
Mar 3.29
Apr 3.23
May 3.81
Jun 5.52
Jul 5.31
Aug 5.02
Sep 3.90
Oct 3.00
Nov 3.21
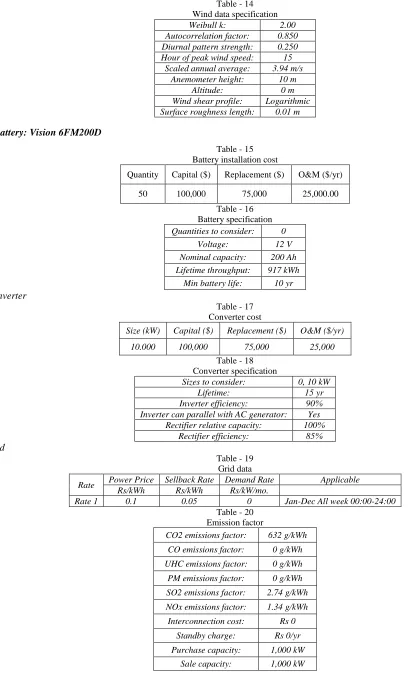
Table - 14 Wind data specification
Weibull k: 2.00
Autocorrelation factor: 0.850 Diurnal pattern strength: 0.250 Hour of peak wind speed: 15
Scaled annual average: 3.94 m/s Anemometer height: 10 m
Altitude: 0 m
Wind shear profile: Logarithmic Surface roughness length: 0.01 m
Battery: Vision 6FM200D
Table - 15 Battery installation cost
Quantity Capital ($) Replacement ($) O&M ($/yr)
50 100,000 75,000 25,000.00
Table - 16 Battery specification Quantities to consider: 0
Voltage: 12 V
Nominal capacity: 200 Ah Lifetime throughput: 917 kWh
Min battery life: 10 yr Converter
Table - 17 Converter cost
Size (kW) Capital ($) Replacement ($) O&M ($/yr)
10.000 100,000 75,000 25,000
Table - 18 Converter specification
Sizes to consider: 0, 10 kW
Lifetime: 15 yr
Inverter efficiency: 90% Inverter can parallel with AC generator: Yes
Rectifier relative capacity: 100% Rectifier efficiency: 85% Grid
Table - 19 Grid data
Rate Power Price Sellback Rate Demand Rate Applicable Rs/kWh Rs/kWh Rs/kW/mo.
Rate 1 0.1 0.05 0 Jan-Dec All week 00:00-24:00
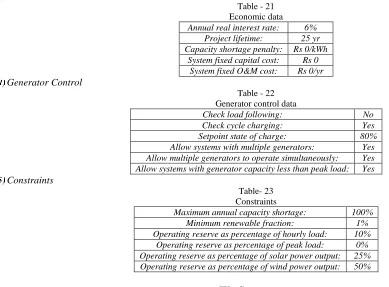
Table - 20 Emission factor
CO2 emissions factor: 632 g/kWh
CO emissions factor: 0 g/kWh
UHC emissions factor: 0 g/kWh
PM emissions factor: 0 g/kWh
SO2 emissions factor: 2.74 g/kWh
NOx emissions factor: 1.34 g/kWh
Interconnection cost: Rs 0
Standby charge: Rs 0/yr
Allow systems with multiple generators: Yes Allow multiple generators to operate simultaneously: Yes Allow systems with generator capacity less than peak load: Yes Constraints
Table- 23 Constraints
Maximum annual capacity shortage: 100% Minimum renewable fraction: 1% Operating reserve as percentage of hourly load: 10%
Operating reserve as percentage of peak load: 0% Operating reserve as percentage of solar power output: 25% Operating reserve as percentage of wind power output: 50%
IX. CONCLUSION
The interconnection of the renewable-resources based distributed generation (DG) system to the existing power system could lead to power quality (PQ) problems, degradation in system reliability, and other associated issues are addressed. The voltage fluctuations in the grid connected system produce sag and swell due to the occurrence of faults in the load side. This can be an event to reduce power quality and may be a reason for failure in the power grid. By proper maintenance of frequency and continuous monitoring, these sags and swells can be avoided.
FUTURE ENHANCEMENT
HOMER enables the user to simulate the system considering almost all the real time constraints. The single PV system of specified time can be tried to modify so that in future various types of PV systems can be connected and simulated in a single environment.
REFERENCES
[1] http://www.homerenergy.com
[2] http://www.homerenergy.com/learn-more-about-HOMER-Energy.html
[3] A.K. Akella, M.P. Sharma, R.P. Saini, Optimum utilization of renewable energy sources in a remote area.
[4] K.R. Ajao, O.A.Oladosu & O.T.Popoola, Using homer power optimization software for cost benefit analysis of hybrid-solar power generation relative to