www.nonlin-processes-geophys.net/21/1127/2014/ doi:10.5194/npg-21-1127-2014
© Author(s) 2014. CC Attribution 3.0 License.
Correlations between climate network and relief data
T. K. D. Peron1, C. H. Comin1, D. R. Amancio2, L. da F. Costa1, F. A. Rodrigues2, and J. Kurths3,4,5 1São Carlos Institute of Physics, University of São Paulo, São Carlos, São Paulo, Brazil
2Institute of Mathematics and Computer Science, University of São Paulo, São Carlos, São Paulo, Brazil 3Potsdam Institute for Climate Impact Research (PIK), 14473 Potsdam, Germany
4Department of Physics, Humboldt University, 12489 Berlin, Germany
5Institute for Complex Systems and Mathematical Biology, University of Aberdeen, Aberdeen AB24 3UE, UK Correspondence to: T. K. D. Peron ([email protected])
Received: 19 March 2014 – Published in Nonlin. Processes Geophys. Discuss.: 24 April 2014 Revised: 5 September 2014 – Accepted: 22 September 2014 – Published: 27 November 2014
Abstract. In the last few years, the scientific community has witnessed an ongoing trend of using ideas developed in the study of complex networks to analyze climate dynam-ics. This powerful combination, usually called climate net-works, can be used to uncover non-trivial patterns of weather changes throughout the years. Here we investigate the tem-perature network of the North American region and show that two network characteristics, namely degree and cluster-ing, have marked differences between the eastern and west-ern regions. We show that such differences are a reflection of the presence of a large network community on the west-ern side of the continent. Moreover, we provide evidence that this large community is a consequence of the peculiar char-acteristics of the western relief of North America.
1 Introduction
Complex networks are powerful tools for describing the structure and functioning of a wide range of natural, techno-logical and social systems (da Fontoura Costa et al., 2011). Owing to the general framework that the network theory provides, a mathematical representation of such systems is straightforward, not only allowing the description of net-worked topologies but also leading to a better comprehen-sion of dynamical processes in systems whose elements are connected in a non-trivial fashion (Boccaletti et al., 2006). In the past few years, complex networks have also been ap-plied in climate sciences, creating this way the new field of climate networks (Tsonis et al., 2006, 2008; Tsonis and Swanson, 2008; Donges et al., 2009a, b; Gozolchiani et al.,
sciences has brought new insights that could not be unveiled by using classical methods of climatology and statistics. Re-cently, by using cross-correlation and mutual information to construct climate networks and analyzing the betweenness centrality field (node centrality measurement based on short-est path lengths; Costa et al., 2007), researchers found wave-like structures that are related to surface ocean currents, de-tecting this way a backbone of significantly increased mat-ter and energy flow in the global surface air temperature field (Donges et al., 2009a, b). Furthermore, the authors also showed that these results cannot be achieved by using methods derived from multivariate analysis, such as princi-pal component analysis (PCA) and singular spectrum analy-sis (SSA) (Donges et al., 2009a). In this work, we extend the analysis of climate networks by investigating the influence of altitudes of the grid points on centrality measurements of the networks generated through similarities in temperature time series measured at the surface level. The main motivation for including the altitudes on the network model is the assump-tion that the flow of matter and energy can be affected by topographical barriers, leading to anomalies in the correla-tions between the time series of climate variables. Therefore, in order to uncover these phenomena and quantify the influ-ence of the relief on the network correlations, for each nodev
we associate its geographical altitudehvwith measurements of the climate network, such as betweenness and clustering coefficient.
We constructed climate networks allowing the existence of long-range connections. By detecting communities in the cli-mate networks, we found clusters that correspond to groups of nodes embedded in geographical areas of similar relief properties. Moreover, it was also found that the correlation patterns between centrality measurements and relief proper-ties vary according to the considered network community. Finally we point out a possible effect of time series inter-polation generated by stations in the degree and clustering coefficient fields of the networks.
2 Materials and methods 2.1 Data set description
Throughout the analysis we used the following databases: i. Monthly land temperature records from the National
Center for Environmental Prediction/National Center for Atmospheric Research NCEP/NCAR (Kistler et al., 2001; Fan and Van den Dool, 2008) obtained from Jan-uary 1948 to JanJan-uary 2011. The data set consists of a regular spatio-temporal grid with 0.5◦ of latitude and longitude resolution. Each grid pointihas a temperature time seriesTi(t )associated, containing the time evolu-tion of the monthly mean temperature. A visualizaevolu-tion of stations employed in the analysis that originated from
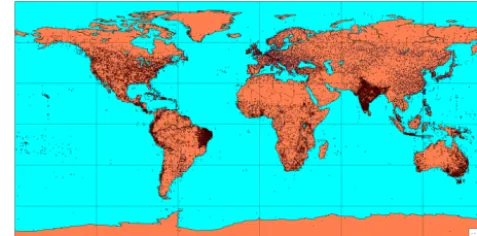
Figure 1. Visualization of the stations used to interpolate the grid
points in the temperature database.
the database is shown in Fig. 1 (data provided by the NOAA, 2013).
ii. Relief data set provided by National Geophysical Data Center (NGDC, 2009) and consisting of 1 arc min regu-lar gridded area measuring land topography and ocean bathymetry.
2.2 Complex network measurements
In order to seek for relationships between the climate and relief, we use network measurements related to centrality and symmetry of connections. The most simple of them, referred to as node degree, is given by
ki= N X
j=1
Aij, (1)
whereAij=1 if nodes i and j are connected andAij=0 otherwise. The degree is a simple way to study the local im-portance of a node. Concerning climate networks, the degree can be used to quantify how many points of the studied re-gion display a time series similar to a given point in the globe. In other words, nodes with large degrees are related to large regions of correlation.
The clustering coefficient of a node is the probability that two of its neighbors are also connected in the network, and is given by (da Fontoura Costa et al., 2011)
ci =
2T(i) ki(ki−1)
, (2)
regions. Conversely, large clustering is related to a more dif-fusive propagation.
Another feature we study is the betweenness centrality. To define this measurement, consider the following notation. Let
σst be the number of shortest paths from node s to nodet (da Fontoura Costa et al., 2011). If σst(i)is the number of such paths passing through nodei, the betweenness central-ity is given by (da Fontoura Costa et al., 2011)
bi= X
s6=t6=i σst(i)
σst
. (3)
It gives information about global relationships in climate dy-namics. It is of great importance in quantifying if a node is commonly used as a route for long-range correlations in the network (Donges et al., 2009a).
A node can be central but still not communicate well with the rest of the network. For instance, a node that is connected to a highly connected node can be regarded as being central in the network, but it has a strong dependence on its highly connected neighbor. The accessibility measurement quanti-fies the number of nodes effectively accessed after hsteps, where the node accessed at each step is chosen randomly. Formally, the accessibility is computed as
ai= 1
Nihexp
− N X
j
PijhlogPijh !
, (4)
wherePijh is the probability that a random walk starting at nodeiarrives at nodej inhsteps,Nihthe number of reach-able nodes in h steps from node i and exp(·) is the expo-nential function (see, e.g., Viana et al., 2012, for a detailed explanation of this measurement).
Real-world networks often display a modular structure, i.e., the presence of communities (Fortunato, 2010). The modular structure of a given network can be quantified by the measurement known as modularity, which is given by (Newman, 2003)
Q= 1
2m X
ij
Aij− kikj
2m,
δ Ci, Cj, (5)
wherem=1/2P
Aijis the total number of edges,Ci is the community to which nodeibelongs andδ is the Kronecker delta. Once the partitioning of the nodes into communities is done, the modularity Q represents the fraction of edges that connects nodes of the same community subtracting the fraction of these edges that we would expect to find in a ran-dom graph with the same degree sequence. Thus, Eq. (5) pro-vides a significance test of the obtained network partitioning, which will be used to validate our results in the next sections. Since the modularityQquantifies how good a given par-tition is, many methods intended to uncover communities in networks are based on the optimization of this measure-ment. Different strategies for the modularity optimization
have been adopted in the literature such as simulated anneal-ing (Reichardt and Bornholdt, 2006; Guimera et al., 2004), greedy algorithms (Newman, 2004; Clauset et al., 2004) and extremal optimization (Duch and Arenas, 2005). Al-though these algorithms provide accurate results, most of them have great computational cost. For this reason, we adopt the method proposed in Newman (2006) to obtain the community structure of climate networks. This method con-sists in mapping the modularity optimization in terms of the spectrum of the so-called modularity matrix B defined as B=A−kk
T
2m, (6)
where A is the adjacency matrix,mis as defined before in Eq. (5) andk= [k1, . . ., kN]T the vector whose elementki is the degree of theith node. The spectral optimization of the modularityQhas complexity of the order ofO(N2logN), which turns out to be faster than, for instance, simulated an-nealing and extremal optimization approaches, besides pro-viding more accurate results for large networks (Newman, 2006; Fortunato, 2010).
2.3 Climate networks
Because we are most interested in the topological charac-teristics of climate networks and its correlations with relief heights, we consider now only the connected subgraph whose nodes are located inside a continent. Note that we do not simply extract the subgraph over land discarding any edges which connects nodes on the ocean; rather we recalculate the thresholdby taking into account only the nodes in the spatio-temporal grid which are over land.
Having the values of temperatures for each grid point in the data set, a simple way to infer that two points have sim-ilar dynamical evolution is through the Pearson correlation coefficient between pairs of time series, which is given by
ρij=
TiTj− hTiiTj r
Ti2− hTii2 D
Tj2 E
−Tj2
, (7)
whereTi is the time series associated with a pointi in the spatio-temporal grid andhXimeans the average of the vari-ableX. Furthermore, we also remove the mean annual cycle in order to avoid seasonal effects in the time series.
where2(·)is the Heaviside function. The thresholdshould be chosen in order to keep the network edges that corre-spond to strong correlation between time series, thus elim-inating the non-relevant ones (Tsonis et al., 2006, 2008; Tso-nis and Swanson, 2008; Gozolchiani et al., 2008; Donges et al., 2009a). Therefore, for all networks analyzed in this approach, the thresholdwas chosen so that only 5 % of the connections are kept in the network. Without the constraint of only nearest-neighbors connections, it is reasonable to ex-pect a much richer pattern of connectivity with, e.g., presence of communities in the network, i.e., clusters of nodes that are more connected inside these groups than external nodes to the cluster. In the context of climate networks, the grouping of nodes into communities was shown to be related to dif-ferent climate patterns and to unveil difdif-ferent known climate zones (Tsonis et al., 2011).
3 Results
From Fan and Van den Dool (2008) we know that the land surface temperature database is constructed by interpolating recorded time series from stations spread over the globe. In order to avoid interpolation effects, it is useful to analyze the spatial distribution of the stations that generate this database. Using data from NGDC (2009), in Fig. 1 we show the sta-tion locasta-tion used to record the monthly average tempera-ture time series. As we can see, apart from the northeast re-gion of Brazil, South America is sparsely covered by sta-tions, whereas North America and Europe are more densely covered. Therefore, in order to eliminate any doubts as to whether the observed patterns in the networks measurements are being affected by the interpolation, we turn our analysis to regions with a high density of stations, namely, the North American region.
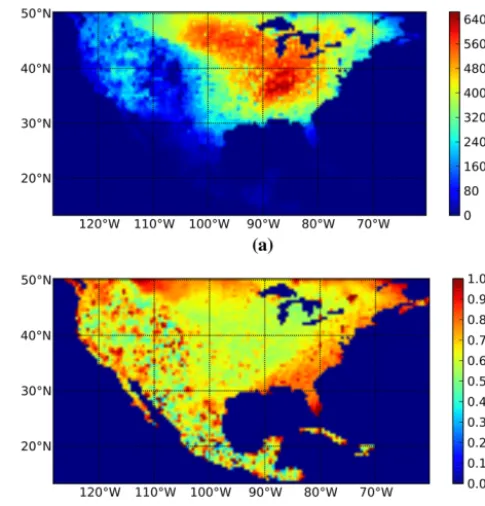
Applying the methodology described in Sect. 2.3, we ob-tain the climate networks and extract the centrality mea-surements for the region with the values of longitudeθand latitude φ ranging in the intervals −128◦≤θ≤ −60◦ and 30◦≤φ≤70◦, respectively. Our results are shown in Fig. 2. As we can see in Fig. 1, the region has stations approximately uniformly distributed. Therefore, we can discard the hypoth-esis that the area with high values for the degree in Fig. 2a is due to interpolation effects. It is also interesting to note that in Fig. 2b there are two distinct patterns in the clustering coefficient field. While the eastern region has an almost uni-form distribution for ci, the western region displays a more irregular distribution. The same pattern is also followed by the other centrality measurements. Figure 3 shows the ac-cessibility and betweenness centrality fields. Likewise, the patterns observed in the western and eastern regions differ significantly, especially for the accessibility. It is important to note that, according to Figs. 2a and 3b, the regions taking low values of degree and accessibility overlap significantly. This pattern cannot be interpreted in a straightforward
fash-Figure 2. (a) Degreeki and (b) clustering coefficientci obtained from the network of temperature correlations.
Figure 3. (a) Betweenness centralitybiand (b) accessibilityaifor h=3 steps obtained from the network of temperature correlations.
Figure 4. Community structure for the network constructed with
the grid points withθand latitudeφin the intervals−128◦≤θ≤ −60◦and 30◦≤φ≤70◦of the temperature database. Grid points colored with the same color correspond to nodes belonging to the same network community.
The topology of the climate network was further ana-lyzed by identifying the natural topological communities. The communities arising from the application of the eigen-vector strategy (see Newman, 2006) are shown in Fig. 4. A straightforward comparison of Figs. 2 and 4 reveals that the large community located at the western region corresponds to the nodes taking the lowest values of degree and accessi-bility (see Figs. 2a and 3a). As for the clustering coefficient, it is irregularly distributed.
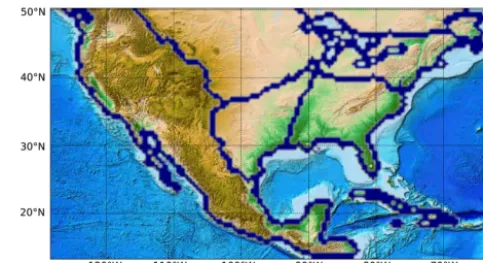
Figure 5 displays the network communities and the relief structure. Remarkably, the variations in the largest commu-nity border on the west side of North America are followed by variations in the relief structure. Comparing Figs. 5 and 2, we notice that the contrast between the west and east region in the degree and clustering coefficient field is also observed in the relief structure. More specifically, the regions present very different patterns in the relief structure which is also re-vealed in the pattern of network measurements, suggesting that with our methodology we may be able to quantify the influence of the landscape in the climate network organiza-tion.
4 Conclusions
Despite being a recent field, climate networks have already been shown to provide valuable information about climate dynamics (Tsonis et al., 2006, 2008; Tsonis and Swanson, 2008; Donges et al., 2009a, b; Gozolchiani et al., 2008; Tsonis and Roebber, 2004; Yamasaki et al., 2008). In this study, we used the monthly land temperature records from NCEP/NCAR reanalysis to define correlations between sta-tions, which are then transformed into network connections when they exceed a specified threshold. One important point raised during our investigation was the effect of the spatial distribution of stations on the resulting network. We found that data pertaining to the region in which (−128◦, 30◦)≤
Figure 5. Boundaries of the communities obtained from the climate
networks. Note that the largest community coincides with a regular relief profile.
(θ, φ)≤(−60◦,70◦)should not suffer such effects, given its almost uniform distribution of stations. One important topic to be studied in the future is the specific effect of spatial het-erogeneities in the sampled data on the formation of abnor-mal, but most likely predictable, structures in the network.
In this study, we showed that North America, when mod-eled as a climate network, displays two regions with distinct topological properties. We have found that the eastern and western regions display striking differences of degree, acces-sibility and clustering coefficient, which may be explained by the presence of communities arising from the climate net-work. More specifically, the eastern side was found to be characterized by uniform values of centrality measurements. Conversely, the western side was mainly characterized by an heterogeneous distribution of measurement values. The rela-tionship between climate and relief was analyzed in the relief data set provided by NOAA jointly with the climate network data. Interestingly, we uncovered dynamics not detected by other traditional methods. The most important pattern aris-ing from the analysis was the observation that the topologi-cal community of the climate network in the western region matched the region with peculiar relief structure, suggesting a strong influence of the relief on the climate dynamics.
Of paramount interest for future studies is to use other rel-evant climate variables (e.g., humidity, wind, pressure) to un-cover additional relationships between relief and climate, us-ing the ideas developed in the climate networks field, as well the boundary effects (Rheinwalt et al., 2012) of spatially em-bedded networks.
Acknowledgements. T. K. D. Peron would like to acknowledge
support from CNPq, FAPESP and CAPES. J. Kurths would like to acknowledge IRTG 1740 (DFG and FAPESP) for the sponsorship provided.
Edited by: M. Small
Reviewed by: two anonymous referees
References
Boccaletti, S., Latora, V., Moreno, Y., Chavez, M., and Hwang, D.: Complex networks: Structure and dynamics, Phys. Rep., 424, 175–308, 2006.
Clauset, A., Newman, M. E., and Moore, C.: Finding commu-nity structure in very large networks, Phys. Rev. E, 70, 066111, doi:10.1103/PhysRevE.70.066111, 2004.
Costa, L., Rodrigues, F., Travieso, G., and Boas, P.: Characteri-zation of complex networks: A survey of measurements, Adv. Phys., 56, 167–242, 2007.
da Fontoura Costa, L., Oliveira Jr., O., Travieso, G., Rodrigues, F., Boas, P., Antiqueira, L., Viana, M., and Rocha, L.: Analyzing and modeling real-world phenomena with complex networks: a survey of applications, Adv. Phys., 60, 329–412, 2011.
Donges, J. F., Zou, Y., Marwan, N., and Kurths, J.: The back-bone of the climate network, EPL-Europhys. Lett., 87, 48007, doi:10.1209/0295-5075/87/48007, 2009a.
Donges, J. F., Zou, Y., Marwan, N., and Kurths, J.: Complex networks in climate dynamics, Eur. Phys. J.-Spec. Top., 174, 157–179, doi:10.1140/epjst/e2009-01098-2, 2009b.
Duch, J. and Arenas, A.: Community detection in complex net-works using extremal optimization, Phys. Rev. E, 72, 027104, doi:10.1103/PhysRevE.72.027104, 2005.
Fan, Y. and Van den Dool, H.: A global monthly land surface air temperature analysis for 1948–present, J. Geophys. Res., 113, D01103, doi:10.1029/2007JD008470, 2008.
Fortunato, S.: Community detection in graphs, Phys. Rep., 486, 75–174, 2010.
Gozolchiani, A., Yamasaki, K., Gazit, O., and Havlin, S.: Pattern of climate network blinking links follows El Nino events, EPL-Europhys. Lett., 83, 28005, doi:10.1209/0295-5075/83/28005, 2008.
Guimera, R., Sales-Pardo, M., and Amaral, L. A. N.: Modularity from fluctuations in random graphs and complex networks, Phys. Rev. E, 70, 025101, doi:10.1103/PhysRevE.70.025101, 2004. Kistler, R., Kalnay, E., Collins, W., Saha, S., White, G., Woollen,
J., Chelliah, M., Ebisuzaki, W., Kanamitsu, M., Kousky, V., van den Dool, H., Jenne, R., and Fiorino, M.: The NCEP-NCAR 50-year reanalysis: Monthly means CD-ROM and documentation, B. Am. Meteorol. Soc., 82, 247–268, 2001.
Mheen, M., Dijkstra, H. A., Gozolchiani, A., Toom, M., Feng, Q., Kurths, J., and Hernandez-Garcia, E.: Interaction network based early warning indicators for the Atlantic MOC collapse, Geo-phys. Res. Lett., 40, 2714–2719, 2013.
Newman, M. E. J.: Mixing patterns in networks, Phys. Rev. E, 67, 026126, doi:10.1103/PhysRevE.67.026126, 2003.
Newman, M. E. J.: Fast algorithm for detecting commu-nity structure in networks, Phys. Rev. E, 69, 066133, doi:10.1103/PhysRevE.69.066133, 2004.
Newman, M. E. J.: Finding community structure in networks us-ing the eigenvectors of matrices, Phys. Rev. E, 74, 036104, doi:10.1103/PhysRevE.74.036104, 2006.
NGDC (National Geophysical Data Center): Relief dataset, avail-able at: http://www.ngdc.noaa.gov/mgg/global/global.html, last access: 7 April 2014, 2009.
NOAA (National Oceanic and Atmospheric Administration): Datasets and variables, available at: http://iridl.ldeo.columbia. edu/SOURCES/.NOAA/, last access: 7 April 2014, 2013.
Reichardt, J. and Bornholdt, S.: Statistical mechanics
of community detection, Phys. Rev. E, 74, 016110,
doi:10.1103/PhysRevE.74.016110, 2006.
Rheinwalt, A., Marwan, N., Kurths, J., Werner, P., and Gersten-garbe, F.-W.: Boundary effects in network measures of spa-tially embedded networks, EPL-Europhys. Lett., 100, 28002, doi:10.1209/0295-5075/100/28002, 2012.
Runge, J., Petoukhov, V., and Kurths, J.: Quantifying the Strength and Delay of Climatic Interactions: The Ambiguities of Cross Correlation and a Novel Measure Based on Graphical Models, J. Climate, 27, 720–739, 2014.
Tsonis, A. and Roebber, P.: The architecture of the climate network, Physica A, 333, 497–504, 2004.
Tsonis, A. and Swanson, K.: Topology and predictability of El Nino and La Nina networks, Phys. Rev. Lett., 100, 228502, doi:10.1103/PhysRevLett.100.228502, 2008.
Tsonis, A., Swanson, K., and Roebber, P.: What do networks have to do with climate?, B. Am. Meteorol. Soc., 87, 585–596, 2006. Tsonis, A., Swanson, K., and Wang, G.: On the role of atmospheric
teleconnections in climate, J. Climate, 21, 2990–3001, 2008. Tsonis, A. A., Wang, G., Swanson, K. L., Rodrigues, F. A., and
Costa, L. d. F.: Community structure and dynamics in climate networks, Clim. Dynam., 37, 933–940, 2011.
Viana, M. P., Batista, J. a. L. B., and Costa, L. d. F.: Effective num-ber of accessed nodes in complex networks, Phys. Rev. E, 85, 036105, doi:10.1103/PhysRevE.85.036105, 2012.