_____________________________________________________________________________________________________
Modelling Carbon Emissions Efficiency from UK
Higher Education Institutions Using Data
Envelopment Analysis
Adefarati Oloruntoba
1*and Japhet Tomiwa Oladipo
11School of Chemical and Process Engineering, University of Leeds, Leeds, UK.
Authors’ contributions
This work was carried out in collaboration between both authors. Both authors read and approved the final manuscript.
Article Information
DOI: 10.9734/JENRR/2019/v3i330097 Editor(s): (1) Dr. Fernando de Lima Caneppele, Professor, Departamento de Engenharia de Biossistemas, University of Sao Paulo,
Brazil. (2) Dr. Salisu Muhammad Lawan,Department of Electrical and Electronics Engineering , Kano University of Science and Technology (KUST) Wudil , Nigeria. (3) Dr. Sreekanth. K. J. Department of Mechanical Engineering, Associate Research Scientist, Energy Efficiency Technologies (EET) Program, Energy and Building Research Centre (EBRC), Kuwait Institute for Scientific Research (KISR), Kuwait. Reviewers: (1) Stanley Emife Nwani, Lagos State University, Nigeria. (2)Mbah Chukwuma Charles, University of Nigeria, Nsukka. (3)Larisa Ivascu, Politehnica University of Timisoara, Romania. Complete Peer review History:http://www.sdiarticle3.com/review-history/51133
Received 01 July 2019 Accepted 03 September 2019 Published 10 September 2019
ABSTRACT
Aims: To correlate the energy and carbon emission efficiency relative to research income, gross internal area, and population for all the Higher Education Institutions (HEIs) in the UK and to assess the comparative carbon emission efficiency of HEIs relative to economic metrics.
Study Design: Analytical panel data study.
Place and Duration of Study: This paper evaluates the energy efficiency of 131 HEIs in the UK subdivided into Russell and non-Russell groups from 2008 to 2015.
Methodology: Data Envelopment Analysis (DEA) and Malmquist productivity indexes (MPI) are used for the efficiency calculations.
Results: The empirical results indicate that UK HEIs have relatively high energy efficiency scores of 96.9% and 77.6% (CRS) and 98.5%, 86.3% (VRS) for Russell and non-Russell groups respectively.
Conclusion: The evidence from this study reveals that HEIs are not significantly suffering from scale effects, hence, an increase in energy efficiency of these institutions is feasible with the present operating scale but would need to work on their technical improvements in energy use. Malmquist index analysis confirms the lack of substantial technological innovation, which impedes their energy efficiency and productivity gain. Findings show that pure technical efficiency accounts for the annual efficiency obtained in the DEA model, the technological progress in contrast is the source of their energy inefficiency.
Keywords: Data envelopment analysis; energy efficiency; malmquist; carbon emissions; greenhouse gases.
1. INTRODUCTION
It is predicted that the nearest decades would experience enormous socioeconomic
challenges, chiefly because of the current trends in energy consumption and its impact on
the built environment. Today's centralized and fossil dominant energy in the face of
escalating global population is confronted with resource depletion and high carbon
emission rates. This necessitates the ongoing call and debate on energy transition especially in Europe. The extensive objectives of this transition are centred on energy efficiency and decarbonization at the level of economic activities.
The United Kingdom in its capacity is building a sustainable framework to achieve net zero carbon future and have singled out Higher Education sector as a pivotal sector to drive energy efficiency and carbon reduction across Britain [1,2,3].
1.1 Energy Consumption and Carbon Emission Trends in the UK Higher Education Institutions (HEIs)
The traditional myths that universities are solely academic habitat is fast eroding, chains of diverse activities are going on at these
institutions on the daily basis. This is giving the institutions a good replica and nomenclature
of a city model. The education sector is consistently witnessing substantial growth in
terms of population, income and the area of their buildings in terms of gross internal area (GIA). Notably, the population of full-time
equivalent students in the UK is estimated as
2,280,830 in 2016/17 from 166 providers which is 3.4% of the total UK population. This
makes the sector bigger than many UK cities [4], this growth is also accompanying with high energy demand and high carbon emissions. In England, the yearly cost of energy is £200 million
with a consequential release of over 3million tonnes of CO2e into the atmosphere [2]. However, the commitment of higher education (HE) sector to reduce the sector emission by 43% by 2020 from a 2005 baseline, has witnessed relative reductions in emission levels over the year. It is without doubt that the reduction in carbon emission, also known greenhouse gases (which are made up of carbon dioxide, methane, nitrogen oxide, aerosols among others) will reduce environmental pollution [5].
Recent findings show that, consequent to high energy consumption and with only 3 years to 2020 target, only 32% of England HEIs are on
track to meet the emission target, while about 60% are most likely to default [6]. In
addition to this, only 17% emissions reduction is
recorded so far against 2005 baseline and should the trend prolongs, the HE sector
would only achieve the maximum of 23%
reduction of carbon emissions by 2020. This is a reflection of a slow decrease in emission, until now, the best carbon offset was
in 2015/16 where about 2million tCO2e was offset representing 7% drop in emission levels [6].
According to Roy et al. (2005) [7], most education institutions increase in their emission levels as a result of a rise in population and energy demand. This study therefore seeks to evaluate the energy efficiency of UK HEIs from the angle of emission levels, population, building area and financial metrics.
the level of energy consumption but enhances the possibility of reducing greenhouse gas (GHG) emissions especially in the short- to mid-term. The strength and the future of energy efficiency is entrenched in right policymaking, in the UK, certain policies have been promulgated to support the national high energy efficiency goal; Carbon Emission Reduction Target (CERT), Community Energy Saving Programme (CESP), under the National Energy Efficiency Data-Framework (NEED) [8], among others.
Several approaches are considered for
assessing the energy efficiency of any sector or organization. However, one similarity among them is the estimation of the principal factors that influence energy consumption relative to the accompanying economic activities and structural switches in the economy. Technical and non-technical improvements are the metrics.
Some studies measure consumption-based energy balances which involve the quantification of direct and indirect energy use, identification of potential thresholds in energy utilization per
economic activity and conducting material and energy flow analysis. Another approach is
the analytical predictive method which involves numerical modelling and simulation.
This includes the design of fuel economy low-emission, and waste energy recovery systems and scenarios with the aim of translating it into industrial applications
[9].
In recent times, several econometric methods have gained acceptance in measuring energy efficiency performance, this
includes; regression analysis [10], simple ratio analysis and Data envelopment analysis [11,12,13]. The flexibility and ability to handle multiple input and output without being bias towards unit make data envelopment analysis (DEA) better suitable for performance measurement.
1.2 Data Envelopment and Malmquist Index in Energy Efficiency Modeling
Although energy efficiency levels across
economic sectors in the world has attracted exceptional academic interest over the decades, very few studies had focused on the higher education sector. The reason for this is not farfetched, levels of emissions
from HE sector relative to energy
consumption was previously regarded as insignificant [7].
Few scholars in the past have attempted to investigate or review the energy efficiency of English HEIs using econometric tools [14,15,16, 17]. Common in their findings is that English HEIs relatively have higher mean technical efficiency scores than their counterparts in other countries, however, a low average level of efficiency is found when only financial metrics are computed. The drawbacks to these studies include; evaluating efficiency based on research output performance, within a cross-sectional data framework and not over time, short or old timeframe covered and the failure to consider the undesirable environmental variables especially the carbon emission data. Only Johnes and Tone (2017) [15], attempted to investigate energy efficiency by incorporating environmental metrics but again the study is deficit as it fails to comprehensively account for sources of
inefficiency nor the change in efficiency across the time period, instead it focuses on the consistency of evaluation methods. These
gaps are properly covered in this study by using DEA and Malmquist productivity index (MPI) models.
DEA also known as Frontier Analysis is a more flexible technique for performance measurement [18]. DEA is a non-parametric linear programming technique used for estimating the relative efficiencies of a similar set of organizations (widely called decision-making units (DMUs)). Efficiency refers to potential to reduce input units or to maximize the output units without wastage of the inputs. The key strengths of DEA over methods include the ability to handle multiple outputs and multiple input and removal of restrictions functional specifications [19].
to which their input is increased while the latter was constructed on the assumption that organizations might not reproduce their output in the same proportion with the increase in their input unit [19]. Any inefficiency from the latter depicts scale effect. MPI on the other hand, evaluates the relative CO2 emissions performance from the perspective of production efficiency, with a strong advantage of identifying the sources of efficiency or inefficiency. MPI was utilized to measure the total factor carbon emission performance of world's 18 top CO2 emitters from 1997 to 2004 and it was concluded that technological progress accounted for the 24% improvement in emission reduction performance [21]. DEA and MPI have been extensively used in eco-efficiency, banking, and manufacturing literature.
Therefore, to further understand how efficiency changes across the year, Malmquist productivity index (MPI) has been used by several authors on the principle of DEA [22]. To the best of the authors’ knowledge, no emission efficiency study for British HEIs has been undertaken that used DEA and Malmquist productivity index to calculate the energy and carbon emission efficiency relative to research income, gross internal area, and population for all the HEIs in the UK. This study will fill this gap and in addition to this, it will also estimate the change in their efficiencies and from this generate an efficiency ranking for each model. This is a profound approach to investigating universities energy and emission efficiencies.
2. DATA AND METHODS
2.1 Data
A dataset for 131 institutions in the UK from England, Northern Ireland, Scotland and Wales for the period between 2008-2014 are used in this study. The HEIs are divided into Russell and Non Russell groups out which 20 and 111 HEIs respectively are selected, some institutions are excluded due to missing information. The data are collected from Higher Education Statistics Agency (HESA), an accredited organization with 24 years of operation designated by Higher Education & Research Act 2017 to provide up-to-date UK higher education data [23]. These institutions were chosen in no particular order.
2.2 Variable Selection
With the objective to evaluate the energy and carbon emissions efficiency of UK HEIs, the
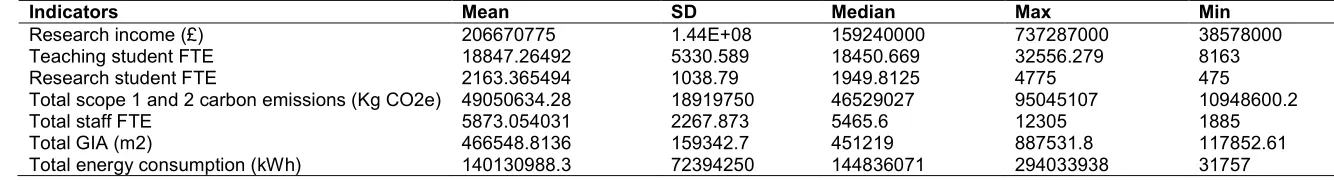
method of Chang et al. (2013) [24] which allow for the integration of undesirable output (carbon emission) in the production function while assuming free disposability. In total, five metrics are extracted from the dataset. These include data on; research income (£), gross internal area (m2), population (fulltime equivalent of teaching students, research students and staff), energy (kwh) and carbon emission equivalent (tCO2e).
Energy consumption, staff full-time equivalent (FTE), GIA are selected as input while research income, teaching student FTE and research student FTE are selected as the output. Carbon emission is chosen as the undesirable output. The choice of these input and output variables is supported by the literature. Table 1 indicates the summary of the relationship between input and output variables while Tables 2 and 3 shows the summary of descriptive statistics of the variables for Russell and non-Russell. Significantly, total staff FTE have strong correlation with research income, research student FTE, GIA and carbon emission representing (0.91, 0.92, 0.87 and 0.85 respectively), energy consumption and GIA are strongly correlated (0.85) whereas Teaching student FTE and CO2 emissions have a relatively weak correlation (0.45) which depicts CO2 emissions can be reduced without reducing the population of the students which has its best relationship with the staff population.
This is in agreement with Fetcher (2009) [25] and Klein-Banai and Theis (2013) [26] argument that floor area has a positive correlation with carbon emissions and that of Disli et al., (2016) [27] that there is an inverted U-shaped relationship between carbon emissions income.
However, the findings of Martinez and Maruotti, (2012) [28] reveal that the efficiency of
carbon emission is strongly dependent on the energy consumption. Therefore, carbon emission must be integrated into estimating energy efficiency.
2.3 Methodology
DEA method is chosen for this study because it can accommodate multiple variables regardless
of the measurement units and can provide the efficiency of the individual participating
5
Table 1. Correlation analysis of the variables
Research Income
Teaching student
Research student FTE
Carbon enission (CO2e)
Total staff FTE
Total GIA (m2)
Total energy consumption
Research Income 1
Teaching student 0.379 1
Research student FTE 0.875 0.447 1
Carbon enission(CO2e) 0.815 0.447 0.836 1
Total staff FTE 0.907 0.545 0.922 0.847 1
Total GIA (m2) 0.748 0.546 0.786 0.841 0.866 1
Total energy consumption 0.657 0.445 0.638 0.732 0.688 0.851 1
Table 2. Descriptive statistics of input/output indicators in from 2008-2015 for Russell HEIs
Indicators Mean SD Median Max Min
Research income (£) 206670775 1.44E+08 159240000 737287000 38578000
Teaching student FTE 18847.26492 5330.589 18450.669 32556.279 8163
Research student FTE 2163.365494 1038.79 1949.8125 4775 475
Total scope 1 and 2 carbon emissions (Kg CO2e) 49050634.28 18919750 46529027 95045107 10948600.2
Total staff FTE 5873.054031 2267.873 5465.6 12305 1885
Total GIA (m2) 466548.8136 159342.7 451219 887531.8 117852.61
Total energy consumption (kWh) 140130988.3 72394250 144836071 294033938 31757
Table 3. Descriptive statistics of input/output indicators in from 2008-2015 for Non-Russell HEIs
Indicators Mean SD Median Max Min
Research income (£) 17129703.6 24349587.39 7101000 157390000 1000
Teaching student FTE 9680.22101 6293.911743 9882.4 29850.846 35
Research student FTE 323.394978 314.8313504 242.9 1803.013 0.9
Total scope 1 and 2 carbon emissions (Kg CO2e) 10592439.4 8015409.387 9200693.397 47944220 521085.568
Total staff FTE 1540.551 988.6596166 1502.355 5995 66
Total GIA (m2) 126928.675 84201.34376 118913 460671 5517
This study utilizes CRS and VRS DEA models under the input orientation approach. The CRS model (also known as CCR model) is built on the assumption that a small firm should be able to operate efficiently as a large one while (VRS also known as BCC model) recognizes positive or negative economies of scale. Based on these differences, many authors prefer to evaluate efficiency using both models. The linear programming formulation of these models are given belowː
CRS Model [29] [19]
( , ) = ( , ) =
− ≥ 0 − =
Subject to: ʏ ≥ : ʏ = +
≥ 0 (1) ℮ = 1 (2)
Where y0 and xo vector are output and input quantities respectively, l indicates the weights, X and ʏ represents the input and output matrix. The key discrepancy between these two models is the introduction of convexity constraint (℮l= 1), this produces the pievewise linear and concave identities.
This study also uses DEA Malmquist productivity Index (MPI) to measure change in efficiency under input orientation. MPI decomposes change in efficiency into five componentsː efficiency change, pure technical change, technological change, scale efficiency change and total factor productivity change. MPI estimates utilized in this is calculated using Fare et al., (1994) [30] mathematical formulation as given in equation 3.
, = ( , )
( , )
( , )
( , )
( , )
( , )
Where t represents the base year (2008), t+1 represents the reference technology, x and y represent the input and output quantities, I indicates input orientation, D indicates the distance function. The scores are categorized into three: when it is equal to 1, it means there is no change (no improvement), greater than 1 (>1) means a positive change and values lesser than one (<1) depicts a negative change, regression especially for technological change.
3. RESULTS AND DISCUSSION
3.1 Efficiency Estimates Under CRS, VRS and Scale Assumptions
The results of the top energy efficiency
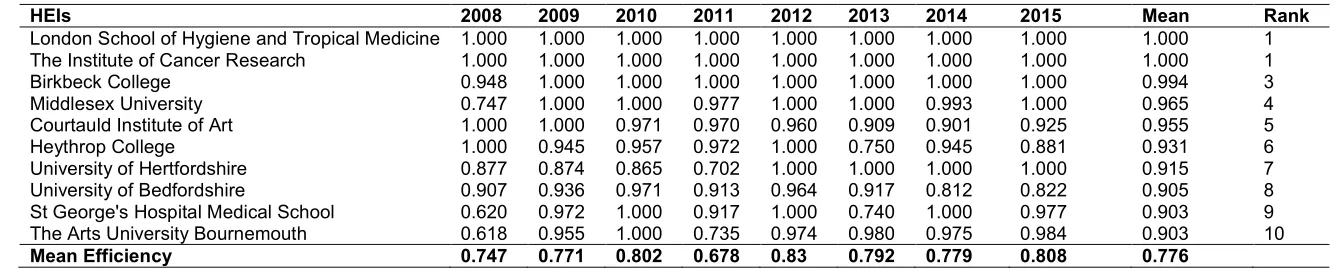
performers for Russell and non-Russell HEIs are presented in Tables 4 and 5 respectively. As
shown in the Table 4, the mean technical efficiency score under CRS assumption for the 20 Russell universities are 97.8%, 97%, 96.7%, 93.7%, 97.6%, 95.3%, 98.8%, 98.5%, and while that of the 111 non-Russell HEIs are 74.7%, 77.1%,80.2%,67.8%,83%,79.2%, 77.9%, 80.8%, and for 2008 to 2015 respectively. Their mean annual technical efficiency score across the
sample years are 96.9% and 77.6%, this indicates that the overall efficiency level of UK universities is relatively high. However, the Russell group is more energy efficient than their counterpart non-Russell group. The efficiency profile also shows the HEIs have the potential for reducing their energy by 3.1%(Russell HEIs) and 22.4%(non-Russell HEIs) under the same technology. Conversely, should non Russell HEIs were efficient for each year, their carbon emissions could have declined by 25.3%, 22.9%, 19.8%, 32.2%, 17%, 20.8%, 22.1% and 19.2%, respectively for their corresponding level of outputs from 2008 to 2015 respectively. Notably, more russell HEIs (an average of 56%) are found to be efficient than inefficient, specifically, in 2008 and 2014, fourteen (14) out of twenty (20) are identified to be efficient using CRS. The following Russell HEIs top the efficiency performance as they maintain the efficiency cross the 8 years period; King's College London, The University of Cambridge, The University of Exeter, The University of Glasgow, The University of Oxford, and University College London, only two HEIs (London School of Hygiene and Tropical Medicine, and The Institute of Cancer Research) achieve this feat among the Non-Russell group.
1/2
(3)
7
Table 4. Top performers under CRS model for russell group HEIs
HEIs 2008 2009 2010 2011 2012 2013 2014 2015 Mean Rank
King's College London 1 1 1 1 1 1 1 1 1 1
The University of Cambridge 1 1 1 1 1 1 1 1 1 1
The University of Exeter 1 1 1 1 1 1 1 1 1 1
The University of Glasgow 1 1 1 1 1 1 1 1 1 1
The University of Oxford 1 1 1 1 1 1 1 1 1 1
University College London 1 1 1 1 1 1 1 1 1 1
London School of Economics and Political Science 1 0.983 1 1 1 1 1 0.986 0.996125 7
The University of Southampton 1 0.967 0.996 0.968 1 1 1 1 0.991375 8
The University of Nottingham 1 1 0.997 0.951 1 0.948 1 1 0.987 9
The University of Leeds 0.96 0.971 1 0.953 0.978 0.964 1 0.983 0.976125 10
Mean efficiency 0.978 0.97 0.967 0.937 0.976 0.953 0.988 0.985 0.969
Table 5. Top Performers under CRS Model for Non Russell Group HEIs
HEIs 2008 2009 2010 2011 2012 2013 2014 2015 Mean Rank
London School of Hygiene and Tropical Medicine 1.000 1.000 1.000 1.000 1.000 1.000 1.000 1.000 1.000 1 The Institute of Cancer Research 1.000 1.000 1.000 1.000 1.000 1.000 1.000 1.000 1.000 1
Birkbeck College 0.948 1.000 1.000 1.000 1.000 1.000 1.000 1.000 0.994 3
Middlesex University 0.747 1.000 1.000 0.977 1.000 1.000 0.993 1.000 0.965 4
Courtauld Institute of Art 1.000 1.000 0.971 0.970 0.960 0.909 0.901 0.925 0.955 5
Heythrop College 1.000 0.945 0.957 0.972 1.000 0.750 0.945 0.881 0.931 6
University of Hertfordshire 0.877 0.874 0.865 0.702 1.000 1.000 1.000 1.000 0.915 7
University of Bedfordshire 0.907 0.936 0.971 0.913 0.964 0.917 0.812 0.822 0.905 8
St George's Hospital Medical School 0.620 0.972 1.000 0.917 1.000 0.740 1.000 0.977 0.903 9 The Arts University Bournemouth 0.618 0.955 1.000 0.735 0.974 0.980 0.975 0.984 0.903 10
8
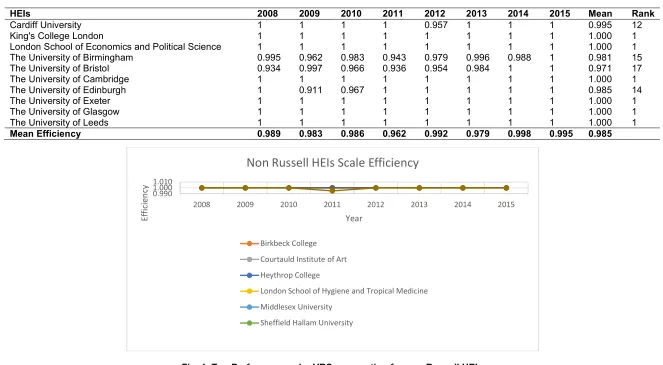
Table 6. Top Performers under VRS assumption for Russell HEIs
HEIs 2008 2009 2010 2011 2012 2013 2014 2015 Mean Rank
Cardiff University 1 1 1 1 0.957 1 1 1 0.995 12
King's College London 1 1 1 1 1 1 1 1 1.000 1
London School of Economics and Political Science 1 1 1 1 1 1 1 1 1.000 1
The University of Birmingham 0.995 0.962 0.983 0.943 0.979 0.996 0.988 1 0.981 15
The University of Bristol 0.934 0.997 0.966 0.936 0.954 0.984 1 1 0.971 17
The University of Cambridge 1 1 1 1 1 1 1 1 1.000 1
The University of Edinburgh 1 0.911 0.967 1 1 1 1 1 0.985 14
The University of Exeter 1 1 1 1 1 1 1 1 1.000 1
The University of Glasgow 1 1 1 1 1 1 1 1 1.000 1
The University of Leeds 1 1 1 1 1 1 1 1 1.000 1
Mean Efficiency 0.989 0.983 0.986 0.962 0.992 0.979 0.998 0.995 0.985
Fig. 1. Top Performers under VRS assumption for non-Russell HEIs 0.990
1.000 1.010
2008 2009 2010 2011 2012 2013 2014 2015
Ef
fi
ci
en
cy
Year
Non Russell HEIs Scale Efficiency
Birkbeck College
Courtauld Institute of Art
Heythrop College
London School of Hygiene and Tropical Medicine
Middlesex University
9
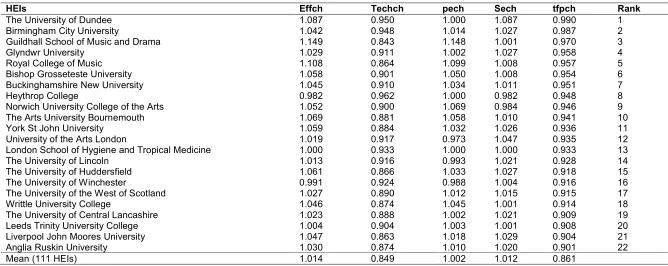
Table 7. The mean Malmquist index in the Non-Russell group HEIs, 2008-2015
HEIs Effch Techch pech Sech tfpch Rank
The University of Dundee 1.087 0.950 1.000 1.087 0.990 1
Birmingham City University 1.042 0.948 1.014 1.027 0.987 2
Guildhall School of Music and Drama 1.149 0.843 1.148 1.001 0.970 3
Glyndwr University 1.029 0.911 1.002 1.027 0.958 4
Royal College of Music 1.108 0.864 1.099 1.008 0.957 5
Bishop Grosseteste University 1.058 0.901 1.050 1.008 0.954 6
Buckinghamshire New University 1.045 0.910 1.034 1.011 0.951 7
Heythrop College 0.982 0.962 1.000 0.982 0.948 8
Norwich University College of the Arts 1.052 0.900 1.069 0.984 0.946 9
The Arts University Bournemouth 1.069 0.881 1.058 1.010 0.941 10
York St John University 1.059 0.884 1.032 1.026 0.936 11
University of the Arts London 1.019 0.917 0.973 1.047 0.935 12
London School of Hygiene and Tropical Medicine 1.000 0.933 1.000 1.000 0.933 13
The University of Lincoln 1.013 0.916 0.993 1.021 0.928 14
The University of Huddersfield 1.061 0.866 1.033 1.027 0.918 15
The University of Winchester 0.991 0.924 0.988 1.004 0.916 16
The University of the West of Scotland 1.027 0.890 1.012 1.015 0.915 17
Writtle University College 1.046 0.874 1.045 1.001 0.914 18
The University of Central Lancashire 1.023 0.888 1.002 1.021 0.909 19
Leeds Trinity University College 1.004 0.904 1.003 1.001 0.908 20
Liverpool John Moores University 1.047 0.863 1.018 1.029 0.904 21
Anglia Ruskin University 1.030 0.874 1.010 1.020 0.901 22
10
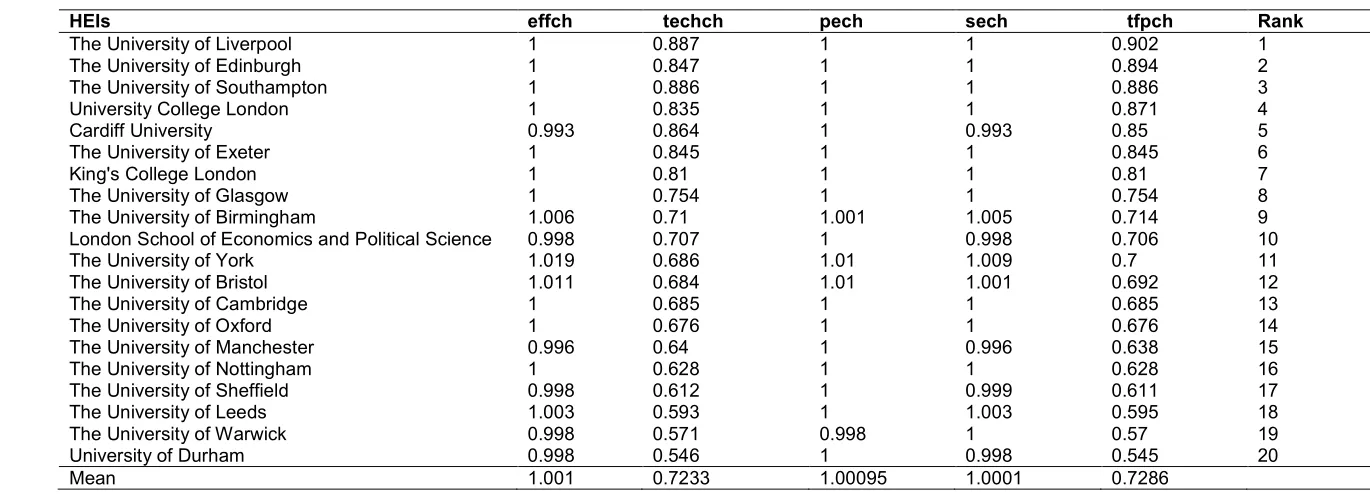
Table 8. The mean Malmquist index in the Russell group HEIs, 2008-2015
HEIs effch techch pech sech tfpch Rank
The University of Liverpool 1 0.887 1 1 0.902 1
The University of Edinburgh 1 0.847 1 1 0.894 2
The University of Southampton 1 0.886 1 1 0.886 3
University College London 1 0.835 1 1 0.871 4
Cardiff University 0.993 0.864 1 0.993 0.85 5
The University of Exeter 1 0.845 1 1 0.845 6
King's College London 1 0.81 1 1 0.81 7
The University of Glasgow 1 0.754 1 1 0.754 8
The University of Birmingham 1.006 0.71 1.001 1.005 0.714 9
London School of Economics and Political Science 0.998 0.707 1 0.998 0.706 10
The University of York 1.019 0.686 1.01 1.009 0.7 11
The University of Bristol 1.011 0.684 1.01 1.001 0.692 12
The University of Cambridge 1 0.685 1 1 0.685 13
The University of Oxford 1 0.676 1 1 0.676 14
The University of Manchester 0.996 0.64 1 0.996 0.638 15
The University of Nottingham 1 0.628 1 1 0.628 16
The University of Sheffield 0.998 0.612 1 0.999 0.611 17
The University of Leeds 1.003 0.593 1 1.003 0.595 18
The University of Warwick 0.998 0.571 0.998 1 0.57 19
University of Durham 0.998 0.546 1 0.998 0.545 20
Similarly, as revealed in Table 6 and Fig. 1, the mean efficiency under VRS scale assumption ranges from 96.2% to 99.5%(Russell group) and 79.8 to 85.3%(non-Russell group) for 2008
to 2015 and their average annual means are 98.5% and 86.5%. This implies that the two UK HEI groups have the potential of
reducing their carbon emission levels by 1.5% and 13.5% for Russell and non-Russell HEIs respectively and still maintain their present level of outputs.
It is worth noting that common to the two HEI groups, is a gross drop in technical efficiency in 2011 this is as a result of decline in research income by 2.08% and research student by 1.74% for non-Russell group while 4.81% and 3.71% decline in staff population and research student are chiefly responsible for Russell group worst efficiency record. Non-Russell HEIs also suffer a dip in their efficiency in 2008 (25.3% inefficiency) consequent to extremely cold weather conditions in that year which required high energy consumption and conversely high emissions level since two-thirds of energy are sourced from fossil [30]. Hence, only 9 HEIs are on the efficiency frontiers while 45 HEIs are below 70% efficiency.
As expected the CRSTE scores are lower than VRSTE scores because, efficiency estimations under VRS for each institution is calculated relative to institutions with similar size while CRS efficiency is calculated without regard to scale (size of operation). A similar result is found in Zefeng et al., (2015) [31] study, where mean CO2 technical efficiency scores for Michigan Greenhouse Growers are 0.387 and 0.505 under CRS and VRS model respectively. Results for 2014 reveal remarkable performance of HEIs above all other years. Although the mean efficiency for all the HEIs is 88.7% depicting potential for input reduction by 11.3%, the number of efficient institutions have grossly increased to 28 from 12 in 2010 under VRS assumption. About 80% of the HEIs are closer to the frontier under the two models, only 4 institutions are far from the frontier.
The results suggest that the sources of HEIs inefficiency can be as a result of scale or non-scale factors. The estimate of non-scale efficiency (SE) indicates whether HEIs are operating on the right. It is calculated from the ratio of constant returns to scale technical efficiency score (CRSTE) to the variable return to scale technical efficiency scores (VRSTE). The results for the
top performers in Scale efficiency are presented in Table 3 and Fig. 2.
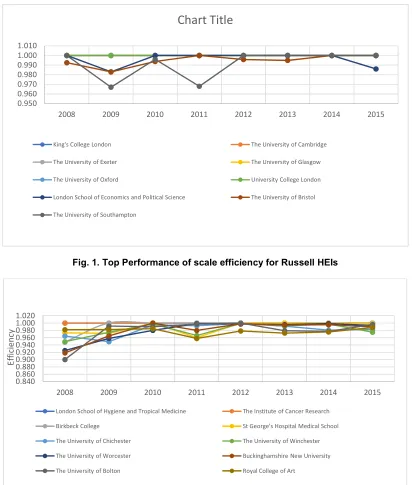
More so a relatively high scale efficiency performance is found for all the HEIs (Figs. 2 and 3), this suggests that all HEIs are operating in the right scale, most especially the Russell group, their efficiency range between 97.4%to 99%. Notwithstanding, a lower mean annual scale efficiency score is found across all the 111 Non Russell institutions of 90.3%, implying that the mean size of these institutions is less than 10% from the optimal size. Some of the HEIs in this group are most likely affected by their scale of operation.
Consistent with CRS and VRS results, in the year 2011 the SE plummets to the least for all the HEIs.
In general, considering the results obtained from three DEA models, HEIs do not show a distinct efficiency pattern. The average annual efficiency undulates across the 8 year period, this suggests that energy consumption has not been overtaken by the right technology that will perpetually upwardly push the efficiency. This therefore implies that the success of HEIs in increasing their energy efficiency will therefore not bother on operating at the right scale or cutting down activities. Interestingly, the results obtained from the scale efficiency dissociates HEIs from being affected by operational size.
Although, the CRS and VRS models show that Russell group HEIs are more energy efficient than the non-Russell group HEIs. In practice, this may not be holistically due to the difference in their sample size. According to Nguyen et al. (2016) [32], DEA could result in biased efficiency scores when comparing samples of varying sizes. Malmquist index analysis is therefore another important tool used in this study to further probe the efficiency change across the HEIs and years. Additionally, it will offer in-depth evidence about the productivity of these HEIs and alleviate the DEA sensitivity to sample size.
3.2 Malmquist Productivity Index Estimates
change index (sech), total factor productivity indexes (tfpch) are (1.0141, 0.849, 1.002, 1.012, 0.861- non Russell group) and (1.001, 0.7233, 1.00095, 1.0001, 0.7286- Russell group) respectively. Notably, among the 131 institutions, none experiences productivity improvement and technological progress. Across the five Malmquist index spectrums, Russell group do not hold substantial performance, as none records
improvement in TECHCH and TFPCH. However, 80% of these HEIs maintain a constant pure technical efficiency change while only 15% records growth. With respect to non-Russell HEIs, a significant number of HEIs (82 out of 111), record improvement in their scale efficiency change and about 60% HEIs improve in their pure technical efficiency.
Fig. 1. Top Performance of scale efficiency for Russell HEIs
Fig. 2. Top Performance of scale efficiency for Non Russell HEIs 0.950
0.960 0.970 0.980 0.990 1.000 1.010
2008 2009 2010 2011 2012 2013 2014 2015
Chart Title
King's College London The University of Cambridge
The University of Exeter The University of Glasgow
The University of Oxford University College London
London School of Economics and Political Science The University of Bristol
The University of Southampton
0.840 0.860 0.880 0.900 0.920 0.940 0.960 0.980 1.000 1.020
2008 2009 2010 2011 2012 2013 2014 2015
Ef
fi
ci
en
cy
London School of Hygiene and Tropical Medicine The Institute of Cancer Research
Birkbeck College St George's Hospital Medical School
The University of Chichester The University of Winchester
The University of Worcester Buckinghamshire New University
The technological efficiency change (techch) and total factor productivity (tfpch), indicate a negative trend of efficiency drop by 27.7% and 27.1% respectively Russell HEIs and 15.1% and 14%. However, the pure efficiency change, scale efficiency change(pech) [0.1%-Russell, 1.36% -non-russell], and efficiency change (effch), [0.01%, and and 1.16%] depict improvement. With a mean annual total factor productivity change score of 0.860 and 0.729 for Russell and non-Russell HEIs respectively, it shows that the level of efficiency has declined over the whole period. The source of this regression is primarily due to technological change (0.723 and 0.860 for Russell and non-Russell HEIs respectively) and the source of inefficiency is principally a scale issue. By implications, most of the HEIs who are not efficient in their energy utilization are probably not exploring latest technology for their energy consumption. Conversely, this finding indicates that UK HEIs are yet to make significant achievements in technological innovation that could influence their energy efficiency positively and that HEIs operational efficiency level does not notably depend on its size or its function.
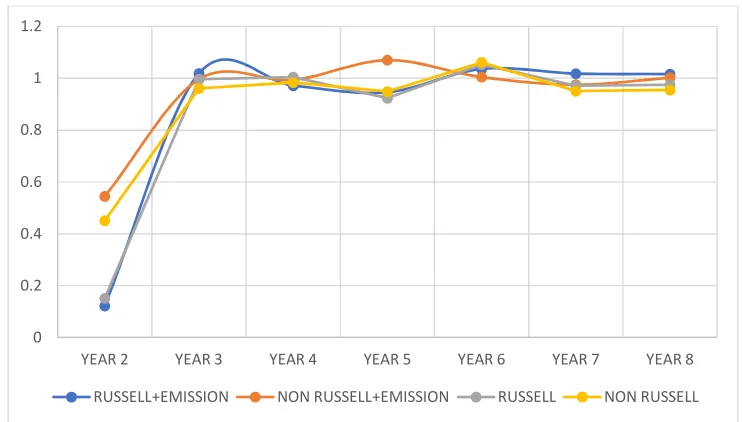
According to Li and Lin (2015) [33], the total-factor energy productivity analysis framework, delivers a viable orientation database for assessing the potential for energy efficiency improvement. As shown in Fig. 4, there is no significant difference in the productivities of
Russell and Non Russell HEIs. However, comparatively, the growth rate of Russell group in year 2 is relatively slower than their counterpart non-russell group. The principal reason for this is that the pure technical progress and scale efficiency change of non Russell HEIs improve (1.061 and 1.002 respectively) while that of Russell group regresses (0996 and 0.999 respectively). By year 4 (2011), the gap is bridged and overtaken in the subsequent year 5, this trend afterwards relatively remains the same. In clear terms, these results show that all HEIs have a huge need and potential to improve on their technological progress. Based on the overall integrated total factor productivity index, the best performing in descending order among non –Russell group HEIs are ; Birmingham City University, Guildhall School of Music and Drama, Royal College of Music, Bishop Grosseteste University, Buckinghamshire New University, Norwich University College of the Arts, and The Arts University Bournemouth while that of Russell group HEIs are The University of Liverpool, The University of Edinburgh, The University of Southampton, University College London, Cardiff University, The University of Exeter and King's College London.
Therefore, since the overall energy efficiency due to technological changes and productivity of UK HEIs are low, more attention and effort should be focused on improving their technological innovation.
Fig. 4. Comparison of Total factor productivity change of Russell and Non-Russell Groups, 2008-2015
0 0.2 0.4 0.6 0.8 1 1.2
Year 2 Year 3 Year 4 Year 5 Year 6 Year 7 Year 8
TF
P
C
H
3.3 Efficiency Performance without Emission Metrics
Another approach to evaluating HEIs energy efficiency performance is to shift attention from the reduction of CO2 emission. In this regard, emission metric is excluded from the performance indicators, this essentially would help provide further evidence on the HEIs energy
efficiency status and sources since it is shown that technological innovation is the
backstop of HEIs efficiency relative to carbon emission.
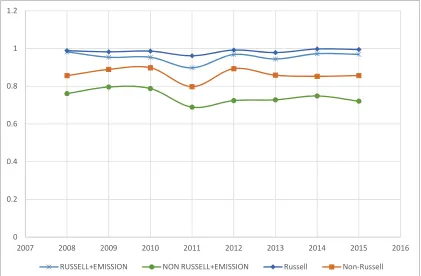
As revealed in Fig. 5, neglecting CO2 emission gives rise to higher mean annual energy efficiency levels for both HEIs groups (representing 98.5% and 86.3%) with Russell group maintaining the efficiency lead. More so, consistent efficiency pattern is also observed across the years. The implication of this is that emission reduction has a significant influence on the overall energy efficiency. Hence, policy makers will default in attaining an adequate reduction of energy efficiency if they fail to take carbon emission levels into account.
Notably, the total factor productivity reflects the overall efficiency of all inputs to a production process and its connection to technological
improvements and other non-technical factors. As shown in Figs. 6 and 7, a further
regression is recorded in the mean annual total factor productivity (-13.2%russell and -9.81%non-Russell) across the two HEIs groups which is a direct product of decline in the technological innovation (13.8%russell and -10.2%non-Russell). However, it is evident that with further regression in technological change, both Russell and non Russell HEIs needs to invest more in available best effective technologies.
According to Yang, (2010) [34], there is a significantly relationship between energy or carbon performance and better resource grants. Hence, TPFCH and TECHCH results raise
questions for policymakers on the effect of the deployment of the latest efficient
technologies on energy and carbon efficiency; and to what extent can increase in research grant promote overall energy efficiency and carbon reduction.
Fig. 5. Comparing VRS efficiency of Russell and Non-Russell with and without CO2 emission factor
0 0.2 0.4 0.6 0.8 1 1.2
2007 2008 2009 2010 2011 2012 2013 2014 2015 2016
Fig. 6. Comparing TECHCH efficiency of Russell and Non-Russell with and without CO2 emission factor
Fig. 7. Comparing total factor productivity of Russell and Non-Russell with and without CO2 emission factor
4. POLICY IMPLICATIONS AND RECOMMENDATIONS
The findings from this study have some policy implications which however should be considered as speculative. Firstly, since there is significantly high relationship between Total staff FTE and the following; research student FTE, research income and carbon emission equivalent representing 90.7%, 92.2% and 84.7%
respectively. The staffs should carefully consider the emission implications of their research and teaching activities with the aim of emission savings.
Secondly, from the viewpoint of technical efficiency, the investigated Russell group were more efficient, this seems to reflects the substantial impact of research income and research personnel (staffs and students) on 0
0.2 0.4 0.6 0.8 1 1.2 1.4
YEAR 2 YEAR 3 YEAR 4 YEAR 5 YEAR 6 YEAR 7 YEAR 8
RUSSELL+EMISSION NON RUSSELL+EMISSION RUSSELL NON RUSSELL
0 0.2 0.4 0.6 0.8 1 1.2
YEAR 2 YEAR 3 YEAR 4 YEAR 5 YEAR 6 YEAR 7 YEAR 8
universities carbon emission performance. If more resources (research grants) are allocated to the non-Russell HEIs, there is possibility of realizing enormous dip in emission production and energy usage.
Since DEA does not adequately address issues related to measurement error, one future opportunity is to apply the mixed DEA and stochastic frontier analysis (DEA-SFA) approach. With this method, the impact of statistical noise would be addressed and the estimation of an individual institution’s efficiency that SFA cannot account for is also made possible.
5. CONCLUSION
This study utilizes DEA model to evaluate the energy efficiency of 131 higher education institutions in the UK. The HEIs are divided into Russell and non-Russell groups from which 20 and 111 HEIs respectively are analyzed. Malmquist index analysis is also conducted to assess changes in the overall integrated efficiency change, productivity improvement and to rank the energy efficiency performance of the HEIs from 2008 to 2015.
The key findings from this study are outlined below:
1. Constant return to scale (CRS) and the variable to scale (VRS) assumptions show that there is no discrete efficiency pattern, instead, it undulates across the 8 years period of investigation. Based on the mean annual, HEIs have relatively high energy efficiency scores of 96.9% and 77.6% (CRS) and 98.5%, 86.3% (VRS) for Russell and non-Russell groups respectively. The results of these estimates suggest that Russell HEIs are operating on variable return to scale rather than constant return to scale, since more of HEIs efficient on the latter and are less affected by scale. Additionally, the results suggest that Russell HEIs are more efficient than the non-Russell HEIs. However, since DEA results are sensitive to sample size, caution is essential in applying the results implicitly in any policy framework.
2. Notably, the results obtained show that 2011 is the worst performing year due to a dip in research income by 2.08% and research student by 1.74% for the non-research based group while efficiency
decline is principally a product of reduction in the staff population by 4.8%. 2010 is also a bad performing year for the non-Russell group as a result of the extreme cold weather conditions that account for high energy demand. No Russell group HEI is below 70% efficiency regardless of the assumption model while no greater than 30% of the HEIs have their energy efficient gradient below 70% except for 2008 (45 out 111 HEIs) and 2011(65 out of 111 HEIs) are grossly inefficient. The evidence from this study reveals that an increase in the energy efficiency of these institutions is feasible with the present operating scale. This requires that institutions work on their technical progress in order to become energy efficient. 3. There is a general carbon emission
efficiency improvement over the years as the relative carbon emission performance of HEIs across the period of observation increased slightly.
4. Based on the Malmquist index analysis for the research and non-research groups, the improvement of efficiency change for both HEI groups fluctuate with values of 1.001 and 1.014 respectively, technological innovation (0.7233 and 0.849, which both depicts regression), pure technical efficiency (1 and 1.002, Russell group remain unchanged , non-Russell improves), scale efficiency change(1.0001 and 1.012, depicts both improves), and total factor productivity change (0.7286 and 0.861, means both deteriorates).
5. Malmquist index analysis confirms the lack of technological innovation, which impedes HEIs energy efficiency and productivity gain. While pure technical efficiency accounts for the annual efficiency obtained in the DEA model, the technological progress in contrast is the source of their energy inefficiency.
address this subject is to review and improve the efficiency of resource allocation, and specific actions include increasing the enrolment of research students and research grants.
7. UK HEIs have high energy consumption and total carbon emission rates, the long-term approach for reducing energy consumption would principally require diversification from fossil-based energy sources.
ETHICAL APPROVAL
All authors hereby declare that all analysis have been examined and approved by the appropriate ethics committee and have therefore been performed in accordance with the ethical standards laid down in the 1964 declaration of Helsinki.
ACKNOWLEDGEMENT
The corresponding author thank Chevening Scholarships, the UK government’s global scholarship programme, funded by the Foreign and Commonwealth Office (FCO) and partner organisations for sponsoring his academic programme.
COMPETING INTERESTS
Authors have declared that no competing interests exist.
REFERENCES
1. Al-Shemmeri T, Naylor L. Energy saving in UK FE colleges: The relative importance of the socio- economic groups and environmental attitudes of employees. Renewable and Sustainable Energy Reviews. 2017;68:1130-1143.
2. Darby H, Elmualim A, Clements-Croome, D, Yearley T. and Box, W. Influence of occupants' behaviour on energy and carbon emission reduction in a higher education building in the UK. Intelligent Buildings International. 2016;8(3):157-175. 3. HEFCE. Carbon reduction target and
strategy for higher education in England, Higher Education Funding Council for England, Bristol;2010.
4. Universities UK 2016 [online]. Patterns and trends in UK higher education; 2016. available:http://www.universitiesuk.ac.uk/fa
cts-and-stats/data-andanalysis/Pages/ patterns-and-trends-uk-higher-education-2016.aspx ;
[Accessed: Mar 2018]
5. Bailey G, LaPoint T. Comparing greenhouse gas emissions across texas Universities. Sustainability. 2016;8(1):80. 6. Brite Green 2016. Carbon emissions in
higher education, 2020 carbon target progress report for the academic year; 2014/2015.
7. Roy I. Green house gas warming. Climate Variability and Sunspot Activity. Springer. 2018;187-195.
8. Adan H, Fuerst F. Do energy efficiency measures really reduce household energy consumption? A difference-in-difference analysis. Energy Efficiency. 2016;9:1207– 1219
9. Chou J, Bui D. Modeling heating and cooling loads by artificial intelligence for energy-efficient building design. Energy and Buildings. 2014;82:437-446.
10. Filippini M, Hunt LC. Energy demand and energy efficiency in the OECD Countries. A Stochastic Demand Frontier Approach. The Energy Journal. 2011;32(2):59-80. 11. Zhou P, Poh KL, Ang BW. A non-radial
DEA approach to measuring environmental performance. European Journal of Operational Research. 2007;178:1-9. 12. Mukherjee K. Energy use efficiency in US
manufacturing: A nonparametric analysis. Energy Economics. 2008;30:76-96
13. Bian Y, Hu M, Wang Y, Xu H. Energy efficiency analysis of the economic system in China during 1986–2012: A parallel slacks-based measure approach. Renew Sustain Energy Rev. 2016:55:990-998. 14. Athanassopoulos AD, Shale E. Assessing
the comparative efficiency of higher education institutions in the UK by the means of data envelopment analysis, Educ. Econ. 1997;5:117-134.
15. Johnes G, Tone K. The efficiency of higher education institutions in England revisited: Comparing alternative measures, Tertiary Education and Management. 2017;23(3): 191-205.
16. Agasisti T, Johnes G. Beyond frontiers: Comparing the efficiency of higher education decision‐making units across more than one country. 2009;17(1):59-79. 17. Flegg AT, Allen DO, Field K, Thurlow TW.
envelopment analysis, Education Economics. 2004;12:231–249.
18. Peter B, Jesper W. Benchmarking of elementary and lower secondary schools in Denmark Temanord, Nordic Economic Policy. 2011;257-294.
19. Banker RD, Charnes A, Copper WW. Some models for estimating technical and scale inefficiencies in data envelopment analysis. Management Science. 1984; 30(9):1078-1092.
20. Yang L, Zhang X. Assessing regional eco-efficiency from the perspective of resource, environmental and economic performance in China: A bootstrapping approach in global data envelopment analysis. Journal of Cleaner Production. 2018;173:100-111. 21. Zhou P, Ang BW, Han JY. Total factor
carbon emission performance: A Malmquist index analysis. Energy Economics. 2010;32(1):194-201.
22. Said K, Hammami S. The impact of CO2 emissions and economic growth on energy consumption in 58 countries. Energy Reports. 1. 2015;62-70.
23. H.E.S.A, Higher Education Student Statistics: UK 2016/17, HESA Promenade; 2018.
24. Chang YTN. Zhang D. Danao, N. Zhang. Environmental efficiency analysis of transportation system in China: A non-radial DEA approach. Energy Policy. 2013;58:277-283.
DOI:10.1016/j.enpol.2013.03.011
25. Fetcher N. OOS 12-3: Scaling of greenhouse gas emissions with institution size for colleges and universities in the United States. In 95th ESA Annual Meeting. Pittsburgh, Pennsylvania. 2010;4.
26. Klein-Banai C, Theis T. Quantitative analysis of factor affecting greenhouse gas emissions at institutions of higher
education. Journal of Cleaner Production. 2013;48:10.
27. Disli M, Ng A, Askari H. Culture, income and CO2 emission. Renewable and Sustainable Energy Reviews. 2016;62:11. 28. Martínez-Zarzoso I, Maruotti A. The impact
of urbanization on CO2 emissions: Evidence from developing countries. Ecol. Econ. 2011;70:1344-1353.
29. Coelli T, Rao DSP, Battase GE. An introduction to Efficiency and Productivity Analysis. Kluwer, Boston; 1998.
30. Färe R, Grosskopf S, Norris M, Zhang Z. Productivity Growth, technical Progress, and efficiency change in industrialized countries. The American Economic Review, 1994:84(1):66-83.
Available:http://www.jstor.org/stable/21179 71
31. Zefeng D, Zhengfei G, Kelly GA, Theodoros S. Energy and environmental efficiency of greenhouse growers in michigan. Southern Agricultural Economics Association (SAEA)> 2015 Annual Meeting. Atlanta, Georgia; 2015.
32. Nguyen HO, Nguyen HV, Chang YT, Chin ATH, Tongzon J. Measuring port efficiency using bootstrapped DEA: The case of Vietnamese ports. The Flagship Journal of International Shipping And Port Research. 2016;43(5):644-659.
33. Li K, Lin B. Metafroniter energy efficiency with CO2 emissions and its
convergence analysis for China. Energy Economics. 2015;48: 230-241.
34. Yang H. Carbon efficiency, carbon reduction potential, and economic
development in the People’s Republic of China: A total factor production model. Mandaluyong City, Philippines: Asian Development Bank; 2010.
_________________________________________________________________________________ © 2019 Oloruntoba and Oladipo; This is an Open Access article distributed under the terms of the Creative Commons Attribution License (http://creativecommons.org/licenses/by/4.0), which permits unrestricted use, distribution, and reproduction in any medium, provided the original work is properly cited.
Peer-review history: