A Tracing Toolset for Embedded Linux Flash File Systems
Pierre Olivier*, Jalil Boukhobza*,
Mathieu Soula
+, Michelle Le Grand
+,
Ismat Chaib Draa
+Univ. Bretagne Occidentale
UMR6285 Lab-STICC
F29200 Brest, France
*fi[email protected]
+fi[email protected]
Eric Senn
Univ. Bretagne Sud
UMR6285 lab-STICC
F56100 Lorient, France
[email protected]
ABSTRACT
NAND flash memory integration in the traditional I/O soft-ware stack of Unix-like operating systems (OS) was achieved without modifying most of the OS layers. In fact, one can dissociate two categories of flash memory devices: (1) those which intricacies are abstracted to the OS (e.g. SSDs, USB sticks), and (2) raw flash memory chips driven by a spe-cific Flash File System (FFS) such as JFFS2 and UBIFS. In the latter case, the operating system I/O software stack low level layers (i.e. file system and driver) were upgraded while the higher levels (virtual file system and related buffers) were not. In order to optimize the system behavior in such a case, one must understand the interactions between the different I/O software management layers, and the perfor-mance impact of each layer for a given I/O workload. For this sake, we developed a tracing toolset allowing to under-stand the impact of each layer on the I/O request flow, for instance: caching, overheads, and fragmentation. The de-veloped framework proved to be precious to apprehend the interactions between OS flash specific layers and traditional layers for a better system performance understanding.
Categories and Subject Descriptors
D.4.2 [Operating Systems]: Storage Management—sec-ondary storage, main memory, storage hierarchies; D.4.3 [Operating Systems]: File Systems Management—access methods; D.4.8 [Operating Systems]: Performance—mea-surements, modeling and prediction
Keywords
NAND Flash Memory, Flash File Systems, Monitoring
1.
INTRODUCTION
NAND Flash memory is the mainstream storage technol-ogy for embedded systems and are more and more used in
mass storage systems. It has known a tremendous devel-opment in recent years thanks to the smart phone market explosion. Flash memory is seen as a pivot technology for many data-centric applications such as Cloud computing, In-ternet of Things, and Wireless Sensors. In fact, there is an exponentially growing need of data storage and some tight constraints on both performance and energy. The confluence of these trends puts more pressure on storage system scien-tists to design more efficient flash based storage systems.
Flash memory has been integrated into the I/O storage software stack without many modifications [1]. In fact, one can find two integration ways according to the OS upgrades performed to support it: (1) flash memory devices which intricacies are abstracted to the OS level (e.g. SSDs, USB sticks), in this case traditional interfaces and most are used of the OS I/O layers stay unchanged. (2) Raw flash mem-ory chips managed by specific Flash File Systems (FFS) such as JFFS [16], UBIFS [14] and YAFFS [8]. In this embed-ded system specific case, low level layers (file systems and drivers) are flash-aware, but still the above layers (such as the VFS) remain unchanged .
Many studies have revealed some very peculiar I/O per-formance behaviors for flash specific file systems [11, 5]. Those behaviors are due for some part to the FFS intricacies, but also to the interactions between the different I/O soft-ware stack layers. In order to optimize such FFS behavior, one should understand the implications of the integration of flash-specific layers into the I/O path. As detailed in the next sections, the main layers crossed by an I/O request in a Linux OS are: the Virtual File System (VFS) and its caches, the FFS, and the NAND flash memory driver named the Memory Technology Device (MTD) (see Figure 1). Each of these layers has a strong impact on the issued I/O requests latencies. So, in order to understand the subsequent I/O performance, one should analyze how the I/O request flow is modified at each layer. In order to ease this I/O explo-ration and characterization, we propose a toolset allowing to analyze and understand the I/O request flow. Indeed there are many existing powerful tools that allow to understand the OS internals such as Strace, SystemTap, Oprofile, and others, but these are not specific to I/O system and the user is to go through cumbersome installation procedures (when possible) and/or timely familiarization to get started.
We propose a homogeneous toolset consisting of three main tools: (1) VFSMon, kernel tool allowing to understand the impact of the VFS and FFS layers on the I/O request. 3HUPLVVLRQWRPDNHGLJLWDORUKDUGFRSLHVRIDOORUSDUWRIWKLVZRUNIRU
SHUVRQDORUFODVVURRPXVHLVJUDQWHGZLWKRXWIHHSURYLGHGWKDWFRSLHV DUHQRWPDGHRUGLVWULEXWHGIRUSURILWRUFRPPHUFLDODGYDQWDJHDQGWKDW FRSLHVEHDUWKLVQRWLFHDQGWKHIXOOFLWDWLRQRQWKHILUVWSDJH7RFRS\ RWKHUZLVHWRUHSXEOLVKWRSRVWRQVHUYHUVRUWRUHGLVWULEXWHWROLVWV UHTXLUHVSULRUVSHFLILFSHUPLVVLRQDQGRUDIHH
9$/8(722/6'HFHPEHU%UDWLVODYD6ORYDNLD &RS\ULJKWk,&67
'2,LFVWYDOXHWRROV
VFSMon traces kernel events and related parameters, such as VFS levels data read and write requests, page cache hits / misses, and Linux read-ahead calls. (2) Flashmon tool that reveals how the I/O request flow is translated to flash memory operations at the FFS output. This tool traces I/O operations at the driver level (close to the hardware). (3) FuncMon is a generic tool that allows to give quantitative information about the execution times of kernel functions on the I/O path. This is of great help when trying to model the performance behavior of the system. In order to illus-trate the use of the developed tools, we give a case study on modeling of I/O read operation performance on the JFFS2 file-system. Indeed, the tools can help in different phases of the modeling process: exploration, modeling and validation. The paper is organized as follows: next section gives some background on NAND flash and its management in embed-ded Linux. After a section concerning related works, the proposed framework is presented. Next, a toolset use-case is given, before concluding in a final section.
2.
NAND FLASH MEMORY BASICS
2.1
Background on NAND Flash Memory
NAND flash memory has some constraints caused by its internal intricacies. Basically, the smallest addressable data unit in flash memory is a page (2 to 8 KB), and a fixed set of pages (usually 64) composes a block. Read and write NAND flash memory operations are executed on pages while erase operations are executed on blocks. The main con-straints are: 1) Write/Erase (W/E) asymmetry: writes are performed on pages whereas erasures are realized on blocks. 2) Erase-before-write limitation: a costly erase operation is necessary before data can be modified. 3) Limited number of W/E cycles: the average number is between 5000 and 105 depending on the technology used.
A flash memory specific component (either software or hardware) is generally used to overcome the aforementioned limitations: 1) The erase-before-write and the W/E granu-larity asymmetry constraints imply that data updates should be performed out-of-place. Hence, a logical-to-physical map-ping scheme, which is a critical issue, is used to manage these updates. 2) Out-of-place data updates require the use of a garbage collector to recycle blocks enclosing invalid pages in order to recover free space. 3) To minimize the limitation on the number of W/E cycles, flash memory management sys-tem try to evenly distribute the wear over the memory cells. This wear leveling prevents some memory cells wearing out more quickly than others.
2.2
Flash Chip Management with Linux
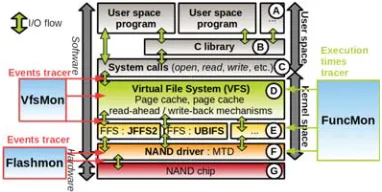
Figure 1 illustrates the software / hardware stack involved in managing the secondary storage with embedded flash chips in Linux. User space applications (A on Figure 1) ac-cess files using system calls (C) which can be encapsulated in some library (B). System calls are received by VFS (D) in kernel space. VFS role is to abstract the use of multiple file systems in one operating system, and to maintain some caching and I/O optimization mechanisms. VFS dispatches requests to the corresponding file system, which in our case is a FFS (E). The FFS handles the requests and eventually performs flash operations on the memory chip (G) through the NAND driver, named the Memory Technology Device (MTD) layer (F).
Figure 1: FFS storage management with Linux.
Traditional VFS layer: The VFS layer [2] allows var-ious file systems operating on multiple storage devices to coexists in the OS, and to be transparently accessed by the user. Several OS level optimization mechanisms are imple-mented by the VFS layer. The Linuxpage cacheis a RAM data cache buffering read and written file data.
There are two other mechanisms implemented at the VFS level which aim to respectively enhance read and write per-formance between the page cache and the file system. First, thepage cache read-ahead mechanism mainly targets hard disk drives. During a file read operation, if the system de-tects a sequential pattern, it prefetches data sequentially from the file system. Read-ahead system is based on the fact that hard disks drives show better sequential pattern performance reducing time consuming head moves. Read-ahead, enabled by default, has proven to be ineffective when working with some FFS [15]. Nevertheless it is still active in YAFFS2 and JFFS2, but deactivated in UBIFS. The sec-ond mechanism is the page cache write-back. When en-abled, pages in the page cache are updated on writes but not directly synced on the storage media. This is done later through a kernel thread namedpdflush, which actually asyn-chronously writes groups of dirty pages on the storage media. The aim of this mechanism is to make profit from temporal locality and absorb write updates at the page cache level. The write-back feature is supported by UBIFS (and may be disabled by hand), not by YAFFS2 and JFFS2. So writes in these FFS are fully synchronous at the VFS level (some minor buffering at the FFS level is still performed).
FFS & MTDFlash-specific layers : Below VFS are the flash specific layers. The FFS handles file I/O requests, maintains its own metadata, and perform flash operations. The three main FFS supported by Linux are JFFS2 [16], YAFFS2 [8] and UBIFS [14]. The way file data and meta-data are read from / written to flash memory is very specific to the FFS model considered. Nevertheless, all FFS must cope with flash memory constraints. They all perform out-of-place data updates and old data invalidation, leading to garbage collection (GC). GC is done online with I/O re-quests when the amount of free space is critically low, and asynchronously through a kernel thread. FFSs also imple-ment wear leveling policies in their write strategies and GC victim block selection algorithms. MTD [10] is a generic driver for all NAND chips supported by Linux. It allows the FFS to perform flash operations. One can note that MTD maintains in RAM a read buffer which has the size of one underlying flash page. A read flash page is kept in the buffer until another one is read or written.
One can see that the performance of a FFS storage
tem depends of the interractions between multiple software layers. Before proposing optimizations, those interractions must first be understood. This is the aim of the tracing toolset presented in this paper.
3.
RELATED WORKS
Many tools have been developed to help understand Linux I/O behavior. Blktrace [3] is a reference tool allowing to trace at a block level. Unfortunately, this tool is not of help when using raw flash chips based on MTD layer. To our knowledge, there is currently no software specifically target-ting the trace of FFS based systems. Many tools exist that allow to trace and monitor kernel system calls and events, one can cite SystemTap [4], Oprofile [7], Ftrace [13], etc. Those tools are very powerful and can help in understanding the I/O request flow. However, their use is cumbersome and their installation could be very hard on embedded platforms due to compiling and dependency issues. The objective of the presented toolset is: (1) to provide users with very easy to use and yet powerful tools, (2) to focus on FFS-based storage systems, (3) to be homogeneous as it is based on the same light (non intrusive) Kprobe facility, and (4) easy to install (one just needs to compile the modules against the kernel code and insert the modules).
4.
PROPOSED TOOLSET
The tracing toolset consists of three main tools depicted in figure 1.VFSMon: a VFS level Monitor. Flashmon: a flash memory operations monitor that traces events at the MTD level. Finally,FuncMon traces different function execution times at all the levels of the I/O software stack.
4.1
Fundamental Design Concepts
The three tools are Linux kernel modules written in C. Kernel modules are built against a kernel source directory tree without the need of (re)compiling the whole kernel. They are loaded and unloaded on demand at runtime. The three developed modules can run concurrently.
Kprobes: All the tools rely on Kprobes [6]. Kprobe stands for kernel probe and is a low-overhead functional-ity provided by Linux kernel to obtain information about kernel function execution at run-time. Kprobes were used because of three main reasons : their portability as they are natively supported by Linux, their simplicity as one does not need to familiarize with a complex framework to de-velop/modify them, and their non-intrusivity as they were reported to infer a very small overhead [6]. Kprobes must be used in kernel code. In our case each module places Kprobes on various functions corresponding to the kernel events to trace. The Jprobe subtype allows the tracer to access the values of the parameters of the traced function. Jprobes are used by VFSMon and Flashmon to trace events and the re-lated parameters. For example a flash block erase operation is traced as a call to the MTD functionnand erase(), which has a parameter indicating the number of the flash block erased. Kretprobessubtype allows tracing the entry and re-turn times of a function. Kretprobes are used by FuncMon to measure relevant functions execution times.
Internal data structures: Each tool maintains in RAM an array of traced events or execution times. These arrays of fixed size are pre-allocated when the modules are inserted to the kernel. We chose to use pre-allocated arrays instead
of allocating a new entry each time an event is traced. In-deed, the latter solution would add an additional overhead corresponding to the allocation during the tracer runtime. Moreover it would lead to a non-deterministic and poten-tially large (according to the traced workload) RAM usage for the tracing toolset, which is not efficient in an embed-ded environment. Fixed size arrays allow the user to control the tracing tools’ RAM footprint according to the execution platform resources. The arrays are circular buffers: in case of overflow the older events are overwritten with newer ones.
Results retrieval: Each tool creates a virtual file in the /procspecial file system directory. This file can be read to retrieve the tracing output (built on demand). It can also be written to send commands to the tools: e.g. pause or restart the tracing process. Results are available in a easily usable CSV file. Each event traced corresponds to one line of the output (a log), with the type of event and the value of the related parameters. Each line also contains a timestamp and the name of the process executed on the CPU when the event was traced. Timing values are obtained through thektime get()kernel function, providing an absolute time (system clock) with a nanosecond granularity. The three traces can be merged and sorted according to timestamps.
4.2
VFSMon
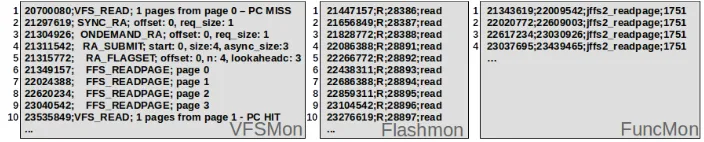
VFSMon traces VFS related events using Jprobes. VFS events can be decomposed into three classes: VFS inputs, VFS internal events, and VFS outputs (which actually are the FFS inputs). VFS inputs are high level functions cor-responding to the file system calls entry points at the VFS level. Functions such asvfs read(),vfs write()orvfs open() are traced along with the related parameters: file identifier (inode), offset and size of data read / written, etc. VFS in-ternal events are related cache mechanisms (page cache read-ahead and write-back) mentioned earlier. VFSMon traces page cache hits and misses on read operations. Several read-ahead related events and parameters are also traced, allowing mainly to observe the prefetching window size evo-lution. There is no particular event traced concerning the page cache write-back mechanism as its behavior can be ob-served when tracing asynchronous write calls to the FFS, i.e. FFS inputs. Traced FFS inputs, or VFS outputs, are the entry points of the FFS level. The three main func-tions at this level arexxx readpage() (xxx being the name of the FFS) which is called by VFS to ask the FFS to read a page of a file from the storage media and places it in the page cache. This function is called on a page cache miss or during a read-ahead prefetching pass.xxx write begin()and xxx write end()are called to write the data of a page on the storage media, for instance, in case of a write-back dirty page flush. VFSMon takes as input the partition for which the user needs to trace file I/Os. This allows to filter file oper-ations related to other peripherals, partitions, pipes, etc by tracing a dedicated flash partition. The user can start, stop, pause, and reset VFSMon very easily through the /proc di-rectory. A sample of VFSMon output is presented on the left part of Figure 2. The field on the left is the logged time (ns). Aread()system call ends up in avfs read()call (line 1) to read the first page of a file. It generates a page cache miss and triggers a read-ahead pass (lines 2-5), reading the first four pages of the file through the ffs readpage() func-tion (lines 6-9). The next call tovfs read()asking the second page of the file is then a page cache hit (line 10) because the
Figure 2: Sequential file read - output samples for VFSMon (left), Flashmon (center) and FuncMon (right).
page was prefetched.
4.3
Flashmon
Flashmon traces flash memory driver level events. As we are at this level very close to the hardware, Flashmon uses Jprobes placed on low level driver functions to trace flash page read / write and block erase operations with the re-lated parameters, mainly the numbers of flash pages and blocks accessed. As compared to its previous version [12], Flashmon has been upgraded to trace cache hits and misses in the MTD read buffer previously presented. Located in the generic MTD layer, this tracer is FFS and hardware ag-nostic. Moreover, Flashmon detects automatically the most adequate level/function (lowest) to trace according to the kernel version. Flashmon takes as input (1) the partition to trace, if not provided, Flashmon traces all the partitions, (2) it allows to choose whether to trace MTD cache events or not, (3) the size of the circular buffer which stores the results, and (4) whether the user needs to log the currently executed process name during the flash memory operation (this name can have an impact on the trace size). The user can start, stop, pause, and reset Flashmon through the /proc directory. One can also have the possibility to interact with Flashmon via /proc to isolate I/Os generated from a given program to make the trace more readable. For instance, one might develop a program that performs some read opera-tions, after each read request, the user program can send a command to Flashmon via /proc in order to insert a marker allowing to clearly see flash operations generated for each applicative read operation. Flashmon allows to collect two types of outputs: a spatial view of the flash memory, and an event log. The spatial view represents the number of op-erations (read, write, and erase) sustained by each block of the flash memory since the module insertion. It allows to have a clear idea of the distribution of the I/O operations on the flash memory for a given application and/or partition. The event log logs the operations with their timestamps. Figure 2 (center) represents a sample of Flashmon output when reading a file. It is a sequence of flash page read op-erations. The third column is the page read index, and the last index is the process responsible of the operation (a C program named ”read”).
4.4
FuncMon
FuncMon is a multi-level kernel function execution time tracer. It works by placing Kretprobes on the (a) entry and (b) exit points of relevant functions of the I/O software stack. One Kretprobe is associated to each traced function. For a given traced function, to each trace point (entry and exit) is associated a Kretprobe handler which is executed (1) when the traced function is called and (2) when it returns. System time is obtained on both the entry and exit handlers,
and the the execution time is then inferred. FuncMon can be used with any function of the I/O kernel storage stack. The user can start, stop, and reset FuncMon through the /proc directory. Figure 2 presents an example of FuncMon out-put, configured to track thejffs2 readpage()function (read-ing 4KB of data from the flash media and stor(read-ing it as a page in the page cache). The first and second columns represent the entry and exit times (ns) of the traced function.
5.
CASE STUDY: MODELING JFFS2 READ
PERFORMANCE
This section describes a use-case of our tracing toolset in the context of studying and modeling the read perfor-mance of JFFS2 on a hardware platform which is theMistral Omap3evmembedded board, referred to as thetest platform. It contains an ARM Cortex A8 TI OMAP3530 CPU (520 Mhz), 256 MB of RAM and 256 MB of Micron SLC NAND flash [9].
Modeling the global read performance Before go-ing through the details of JFFS2 modelgo-ing, we give some clues on the use of the tools for modeling I/O performance. One can split up the I/O operation performance into three phases: VFS phase, FFS phase, driver and flash phases. If one is interested in I/O response time analysis, the contri-bution of each above-cited layer to the global response time request is needed: (1) all the VFS behavior and latencies can be measured thanks to VFSMon: overheads, cache manage-ment (hits and misses) and output to the FFS ; (2) the FuncMon monitor allows to have a precise idea of the FFS latency for a given request (illustrated in the next sections) ; (3) finally, the driver and flash memory operations are traced thanks to Flashmon giving accurate measures on the flash memory operations from qualitative (types of opera-tions) and quantitative (response time per operation) points of view, in addition to information about MTD driver and cache behavior. Consequently with the three developed tools one can have a precise idea on the latencies induced by each layer on the I/O software stack. All on a synchronized ho-mogeneous (from a user point of view) set of tools.
The case of JFFS2JFFS2 [16] is a mature and widely used flash file system, mainlined into Linux sources since 2001. For obvious reasons we cannot describe all the inter-nals of JFFS2 in this paper. Write operations are packed by JFFS2 into so-called data nodes which are written on flash. The data contained in one Linux page from one file can be scattered into several nodes at various on-flash off-sets. This potential fragmentation can have a strong impact on JFFS2 read performance. Fragmentation occurs when a file is written/updated randomly. This phenomenon is studied in the next section. In this work JFFS2 compres-sion feature was disabled as it adds a potentially important
and varying overhead on the performance. In the presented case-study, we are interested in thejffs2 readpage() kernel function execution time which reads a 4KB Linux page from flash memory and places it in the VFS page cache. As we are at the FFS level, we ignored the page cache and read-ahead mechanisms. The model is simple and focused on a specific operation to illustrate the use of the developed tools.
Modeling MethodologyThe modeling methodology con-sists of : (A)an exploration phase: the tracing toolset is used to identify the various parameters impacting JFFS2 read performance ; (B)a modeling phase: based on the output of the exploration phase, a theoretical model is built ; (C)a validation phase: once again the tracing frame-work is used to create a performance profile for the tested hardware / software platform and validate the previously built model against a given I/O workload.
5.1
Exploration Phase
The objective of the exploration phase is to determine the major factors having a significant impact onjffs2 readpage() call execution times. To do so, a series of tests has been conducted. The tests consist in simple C micro benchmark programs reading data from a file written on a clean JFFS2 formatted flash memory partition. The page cache was emp-tied before each test. We mainly varied three parameters: the access pattern (random and sequential), the inter ar-rival times, and the file fragmentation. We did not vary the request size as at the FFS level only 4KB system pages requests are issued. This behavior can be confirmed using VFSMon. Measures on thejffs2 readpage()execution times were achieved thanks to FuncMon.
From the experimentations, three observations can be done: (1) the main factor influencing thejffs2 readpage()execution times is the file fragmentation. Figure 3 illustrates the ex-ecution time (FuncMon output) of eachjffs2 readpage call for sequential read operations on both fragmented and non-fragmented. Results show that the execution times on the fragmented file are significantly higher and more scattered (from∼500 to∼4500μs) than the fragmented ones (∼500
μs). (2) Inter-arrival times do not have any impact at this level as we are below the VFS containing the read-ahead mechanism that could interleave I/O reads asynchronously. (3) Sequentially reading a file was slightly (15%) faster than in random mode. With Flashmon we monitored the MTD (driver) read buffer behavior and found that it reduced the number of flash pages read in sequential access mode.
5.2
Proposed Simple Model
When comparing the previous FuncMon outputs (FFS level) with the related Flashmon outputs (driver level), one can conclude that the execution time of a jffs2 readpage() call is mostly related to the number of flash pages read op-erations. Then it can be modeled as follows:
Tjf f s2readpagef,p=Nf lash pagesf,p∗Tf lash page read+Toverhead
WhereTjf f s2readpagef,pis the execution time of a call to
thejffs2 readpage() function on the Linux page of index p
inside a filef. Nf lash pagesf,p is the number of flash pages
concerned,Tf lash page readis the time to read one flash page
at the driver level (just below the FFS), and finally,Toverhead
is the additional time related to JFFS2 internal operations.
Nf lash pagesf,p depends on the on-flash physical location
of the nodes composing the Linux page as each node can be written in one or many flash pages. Moreover, the MTD
Figure 3: jffs2 readpage() latencies for sequentially reading a fragmented / non fragmented file.
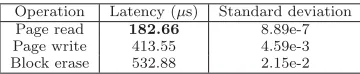
Operation Latency (μs) Standard deviation Page read 182.66 8.89e-7 Page write 413.55 4.59e-3 Block erase 532.88 2.15e-2
Table 1: Traced driver level flash latencies.
read buffer presence implies that the same flash page read consecutively many times would trigger only one flash page read operation. We define the termfragmentation map as being the ordered sequence of physical flash page numbers needed to be read in order to retrieve all the FFS nodes composing a Linux page. For example, if a Linux pagepof a filef is composed of two 2 KB sized nodes, with the first one physically located on flash pages 12 and 13, the second on flash pages 13 and 14, and the fragmentation map for the Linux page in the file isF ragf,p ={12,13,13,14}. So
Nf lash pages is equal to the size of the fragmentation map
minus the number of potential MTD cache hits in case a flash page is accessed two or more times repeatedly.
Nf lash pagesf,p=|F ragf,p| −Nread cache hitsf,p
Here |F ragf,p| is the size of the fragmentation map of the page p in file f. Nread cache hitsf,p is the number of
cache hits in the MTD read cache. In our example with
F ragf,p={12,13,13,14}this value is 1 because flash page
13 is read twice in a row.
5.3
Estimator and Model Validation
An estimator implementing the model was developed and used to analyze the model accuracy. This program estimates the time taken to read a JFFS2 file in a given hardware / software environment. It takes as input an I/O trace a trace describing the order in which the Linux pages of the file are read, and a description of the environment in terms of: (A) theTf lash page readandToverhead values for the model
parameters, and (B) the fragmentation map for each Linux page of the file being read.
5.3.1 Parameters Extraction
We used both FuncMon and Flashmon to retrieve the tim-ing values (Tf lash page read andoverhead) for a given
plat-form and the fragmentation map for a given file.
Timing ParametersFuncMon was used to monitor the execution time of a flash page read operation at the driver level. For information purpose we also monitored the page write and block erase driver level execution times.
jffs2 readpage() Mean Standard execution times set overhead (μs) deviation Seq. read non-frag. file 41.73 9.34e-3 Sequentially read frag.file 48.40 1.50e-2 Mean the two sets 45.06 1.23e-2
Table 2: jffs2 readpage overhead results.
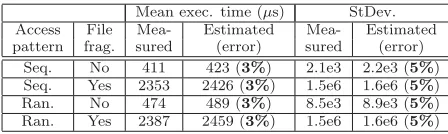
Mean exec. time (μs) StDev. Access File Mea- Estimated Mea- Estimated pattern frag. sured (error) sured (error)
Seq. No 411 423 (3%) 2.1e3 2.2e3 (5%) Seq. Yes 2353 2426 (3%) 1.5e6 1.6e6 (5%) Ran. No 474 489 (3%) 8.5e3 8.9e3 (5%) Ran. Yes 2387 2459 (3%) 1.5e6 1.6e6 (5%)
Table 3: Validation results: measured vs estimated.
Toverheadis found by reversing the preceding equation :
Toverhead=Tjf f s2readpage−Nf lash pages∗Tf lash page read
We measured with FuncMon the execution times of multi-ple calls tojffs2 readpage(). Nf lash pageswas obtained from
Flashmon andTf lash page readfrom previous measures (with
FuncMon, see Table 1). The overhead was estimated based on two sets ofjffs2 readpage()execution times obtained with FuncMon while sequentially reading (A) the non-fragmented and (B) the fragmented file. Results are presented in Table2.
Fragmentation MapTo build the fragmentation map for a given file, we relied on two software tools. The first is jffs2dumpdeveloped by JFFS2 contributors. Given the raw (binary) content of a jffs2 flash partition, it outputs the list of nodes and details about its location and state. We built a second tool that takes the output of jffs2dump and builds the fragmentation map for each Linux page of each file.
5.3.2 Estimator Proposal and Model Validation
Validation ProcessThe estimator gives the execution times of a series of calls tojffs2 readpage() on a given file. It takes as input: the fragmentation map, the timing values
Tf lash page readandToverhead previously presented, and an
input I/O trace file obtained thanks to VFSMon and Flash-mon running with a test programs performingread() calls on a JFFS2 file on our test platform. Alongside, correspond-ing test programs were launched on the test platform and FuncMon was used to measure execution times. Real mea-sures and estimated values were then compared to check the model validity and determine its accuracy.
Validation scenarios and metricsWe validated the model against four scenarios representing reading operations on fragmented / non-fragmented 10 MB file, with a random / sequential pattern.
ResultsTable 3 presents, for each scenario, the mean and standard deviation values for the measured versus estimated jffs2 readpage()execution times. As one can see the model gives accurate results, the maximum error being 5.38%. The fragmentation impact on performance is visible on real and estimated values: execution times while reading fragmented files are significantly longer (more than five times) as com-pared to reading a non-fragmented file. The MTD cache effect is also visible on the non-fragmented measures with around 15% better execution times for sequential pattern.
6.
CONCLUSION
This paper presents a set of tools helping users to
un-derstand embedded FFS-based storage system performance behaviors. Each tool focuses on the understanding of some specific layers crossed by the I/O requests flow. VFSMon traces events at the VFS layer and FFS input, including the page cache read-ahead and write back mechanisms. Flash-mon traces events at the driver layer (FFS output). Func-Mon measures execution times of kernel functions on the I/O path. The tools are synchronized on the same kernel clock making them complementary in the I/O behavior un-derstanding. We also present a case study, using the tools to extract information on the fragmentation impact on JFFS2 and the storage system performance. The tools are FFS ag-nostic and can be used with all FFS built above the MTD layer, which is the case of most FFSs. All the developed tools will be available online with an open source license.
7.
REFERENCES
[1] M. Bjørling, P. Bonnet, L. Bouganim, and N. Dayan. The necessary death of the block device interface. In Conference on Innovative Data Systems Research (CIDR), Asilomar, USA, 2013.
[2] D. P. Bovet and M. Cesati.Understanding the Linux kernel. O’Reilly Media, 2005.
[3] A. D. Brunelle. Blktrace user guide, 2007. [4] F. C. Eigler, V. Prasad, W. Cohen, H. Nguyen,
M. Hunt, J. Keniston, and B. Chen.Architecture of systemtap: a Linux trace/probe tool. 2005.
[5] T. Homma. Evaluation of flash file systems for large NAND flash memory. Embedded Linux Conference, San Francisco, USA, 2009.
[6] J. Keniston, P. S. Panchamukhi, and M. Hiramatsu. Linux kernel probes documentation, 2014.
[7] J. Levon. OProfile manual, 2004. [8] C. Manning. How YAFFS works, 2010.
[9] Micron Inc. NAND flash and mobile LPDDR 168-ball package-on-package (PoP) MCP combination memory (TI OMAP) datasheet, 2009.
[10] MTD Contributors. Memory technology device general documentation, 2008.http:
//www.linux-mtd.infradead.org/doc/general.html. Online, accessed 2009/23/09.
[11] P. Olivier, J. Boukhobza, and E. Senn.
Micro-benchmarking flash memory file system wear leveling and garbage collection: A focus on initial state impact. InComputational Science and Engineering (CSE), 2012 IEEE 15th International Conference on, pages 437–444, Paphos, Cyprus, 2012. [12] P. Olivier, J. Boukhobza, and E. Senn. Flashmon v2:
Monitoring raw NAND flash memory i/o requests on embedded linux.SIGBED Rev., 11(1):38–43, 2014. [13] S. Rostedt. Ftrace documentation, 2008.
[14] A. Schierl, G. Schellhorn, D. Haneberg, and W. Reif. Abstract specification of the UBIFS file system for flash memory. InFM 2009: Formal Methods, pages 190–206. Springer, 2009.
[15] UBIFS Contributors. Readahead - UBIFS documentation, 2008.http:
//www.linux-mtd.infradead.org/doc/ubifs.html
Online, accessed 2014/09/23.
[16] D. Woodhouse. JFFS2: The journalling flash file system version 2. InOttawa Linux Symposium, Ottawa, Canada, 2001.