A New QoE-Driven Video Cache Allocation
Scheme for Mobile Cloud Server
Xiaojiang Zhou, Mengyao Sun, Yumei Wang, Xiaofei Wu
Key Lab of Universal Wireless Communication, Ministry of Education of P.R.C Beijing University of Posts and Telecommunications
Beijing, China
{zhouxiaojiang, sunmengyao, ymwang, wuxf}@bupt.edu.cn
Abstract-- With the advent of mobile cloud computing, video cache technologies at local cellular networks have attracted extensive attention. Nevertheless, existing video cache allocation schemes mostly made decisions only according to the video coding requirements, without considering users’ individual perception for the video service. In this paper, we propose a new video cache allocation scheme with the consideration of quality of experience (QoE) of users under limited storage space. We make use of the linear regression algorithm to map the relationship between the requested video rate, the replied video rate, the channel condition and the QoE value, which then helps to obtain the different video rates to be stored in the server. Meanwhile, we define the parameter to represent the popularity of a video clip. We optimize the cache space allocation for each video clip based on these parameters in the mobile cloud server of local cellular networks. The experiments demonstrate that the proposed scheme has a better performance in terms of the overall QoE of users with the constraint of the total cache size.
Keywords–Quality of Experience; Mobile Cloud Computing; Video Cache Allocation
I. INTRODUCTION
Mobile cloud computing has become increasingly important with the development of cloud technology. And mobile video also has gradually become a hot research field in the last few years. According the Cisco’s prediction, global mobile video traffic will account for about 69.1% of total mobile data traffic in 2018 [1]. However, because of the bandwidth limitation and long scheduling time at local cellular networks, frequent video rebuffering events take place when video data are transmitted under unreliable wireless environment. Although the technology of the content distribution network (CDN) helps to reduce the consumption of the bandwidth, it does not account for the radio access network (RAN) that supervises the resource scheduling of video traffic, which plays the key role of affecting users’ perception of video services, i.e. the quality of experience (QoE).
In order to adapt to the time-variation of wireless transmission conditions, HTTP Adaptive Bit Rate (ABR) has been proposed as the main solution. In this way, the cache or the server needs to store different bit-rate versions for the same video clip, and then responds with the most suitable bit rate according to the client’s request and its transmission condition. Whereas, the decision that which bit
rates should be stored in the mobile cloud server or the cache is a troublesome problem.
To tackle the problem of cache management, the studies in [2, 3, 4] focused on that different conditions of clients should be responded with different bit rates to maximize the QoE. On a different track, researches like [5] and [6] have been devoted to solve how to maximize the content and the network resources under different QoE requirements. On the other side, researches like [1] mainly contributed to the maximization of QoE with the caching of different bit rates, only accounting for the required bit rate.
In this paper, we aim to propose a new cache management scheme for mobile cloud server. First of all, we study the popularity features of video clips in a cell and establish a cache at the edge of RAN. Based on the ranking of the popularity, we allocate different storage spaces to different videos. And then we investigate the relationship between the user’s QoE score and the request rate, the client’s transmission bandwidth and the response rate of the server. We design experiments to find out the best response bit rate in different cases. At last, according to the relationship, we deduce which bit rates of a video should be stored in the cache to maximize the QoE by using the Lagrange multiplier method.
To the best of our knowledge, this is the first work to synthesize the request bit rate, the response bit rate and the bandwidth to weigh the QoE, and then store partial bit rates with a QoE-driven strategy. Our comprehensive research gives an insightful guideline to provide cache management, for example, for the commercial platform of CDS-IS from Cisco.
The rest of the paper is organized as follows. In section II, we firstly introduce how to obtain the video’s popularity. Then we introduce the linear-regression model that maps the required bit rate, the response bit rate, the bandwidth and the QoE. In section III, we leverage the results of the video’s popularity to assign the cache space for different videos. And then the Lagrange multiplier method is introduced to solve the convex problem obtained from the above mapping relationship. In section IV, we introduce the experiment settings and provide the experimental results. In section V, we conclude the paper.
II. SYSTEM MODEL AND PROBLEM FROMULATION A. System Architecture
This subsection describes the overall architecture for the cache management. Our proposed cache management architecture is illustrated in Fig. 1. It consists of three parts, This work is partially supported by the Fundamental Research Funds
for the Central Universities under grant No. 2014ZD03-02, National Science Foundation of China (No. 61171098), and the 111 Project (No. B08004).
QSHINE 2015, August 19-20, Taipei, Taiwan Copyright © 2015 ICST
Media Cache Engine Band Allocation
Engine
Base Station RAN Cache Server Client Engine
Figure.1 The proposed cache management architecture
i.e. Media Cache Engine, Bandwidth Allocation Engine and Client Engine. The functionalities of these three modules are explained as follows.
Media Cache Engine (MCE): Considering that this paper focuses on the RAN, we only research the cache server in cellular networks. MCE mainly stores the different videos with different bit rates, which could efficiently provide the most suitable videos to the clients.
Bandwidth Allocation Engine (BAE): This engine is implemented by the base station. It connects the client and the MCE, responsible for allocating the bandwidth to the clients.
Client Engine (CE): This engine is implemented in the client to request the video rate according to the user’s requirement and to collect the user’s QoE value. This paper assumes that a number of clients request the cache server for different videos with different rates. As the clients don’t know the channel condition of their terminals as well as the storage situations of the server completely, they cannot estimate the trade-offs nor estimate the most suitable video quality in this circumstance. Therefore, each client only asks for a most desired video rate r, and waits for a response from the server. The cache server has stored some different rates ri of this video in advance, to quickly
respond to the request of the clients. Whereas, how to cache the video bit rate is an essential problem. After the server receives the request, it will balance among the request video rate r, the rate version it has stored in the cache, and the client bandwidth B. The most suitable rate ri of the video
that obtains the highest QoE score under current r and B will be sent to the client. Therefore it is important to give the relationship between r, B, ri and the QoE score to judge
which ri is the most suitable rate to be stored in the cache.
Here, we use MOS, i.e. Mean Opinion Score to represent the users’ QoE. And we will model the relationship in the next subsection. What’s more, it is important to decide which rates should be stored in the cache to meet with most of the requests, and to obtain the highest average QoE score for different users. We will formulate this problem by Lagrange multiplier method later.
B. System Model
In this subsection, we will present mathematical models to optimize the cache management, including the popularity video model, the request rate model, the bandwidth allocation model, the mapping model that balances between the request rate, the response rate, the bandwidth and the QoE, and the cache storage model.
1) The Popularity Video Model
The cache cannot allocate sufficient storage spaces to all the videos with all bit rates. So first of all, we need to consider allocating cache spaces according to the popularity of videos. A more popular video ought to be allocated with more storage space.
We utilize the Zipf model to solve the problem. The model is famous in the metrology, which has a good effect on request discipline. Thus, we use this model to research the popularity of a cell’ videos and to find their relative relationships. The function is as follows.
rank q
c p
rank
= (1)
Where, prankmeans the probability of request. Rank means the rank of the probability of the video’s request. c and q are constants that are determined by the content of the video. In this way, the space that the rankth video can obtain is written as:
rank rank
C = p C (2)
Where C is the total space of the cache.
2) The Request Rate Model
Clients nearly know nothing about how the server works and what the network channel conditions of their terminals are. Therefore they cannot give an accurate rate request to choose from the stored video rates in the cache. In this case, the clients could ask for a most desired rate r.
The selection of the request rate mostly depends on the physical capability of the media outlet (e.g., the resolution of terminals) and the clients’ preference. To simplify the model, we model r as a random variable with an even distribution from r0 to rn, where
r
0and rn are the lower andupper bounds of r, respectively. In this case, the probability density function can be written as:
( )
00
1
, ,
R n
n
f r r r r
r r
= ∈
− (3)
3) The Bandwidth Allocation Model
In this paper, we utilize the bandwidth to represent the channel condition of each client. The bandwidth cannot be known by the clients precisely. It is the server’s duty to decide which rate should be sent, and it has to refer to the bandwidth B of the client. The bandwidth is allocated by the base station. Similar with the distribution of r, to simplify the model, B is modeled as a random variable which follows a uniform distribution from Bmax to Bmin,
where Bmin and Bmax are the lower and upper bounds of B,
respectively. In this case, the probability density function can be written as:
( )
1, ,
B max min
max min
f b r b b
b b
= ∈
− (4)
4) The Mapping Model
response rate ri and the bandwidth B to the QoE score. This
is one of the essential parts of the cache management that guarantees the cache responding with the most suitable rate ri,which represents the highest QoE score under a specified
r and B. Here, we use the linear regression to simulate the mapping relationship. The function is described as in equation (5).
0 1 2 3
( , , )i i
Q r r B = a + a r + a r + a B (5)
Where , , and are the constants representing the different applications. The solving process will be elucidated in Section IV.
5) The Cache Storage Model
In the HTTP ABR streaming system, the server cache should pre-store different kinds of rates for a video to rapidly respond according to different conditions. To further formulate the storage problem in the next section, we firstly model how the system stores the video here.
Assume that n different kinds of rates for a video are stored in the server cache in the order of
0 1 1
0 < r < r < < rn− . The size of each file with different rates can be formed as:
( )i i
s r = ar + b (6)
Where,ariis the size of the media content stored on the server cache, and b represents the meta data. In this way, the total storage space C for n files in the cache is
1 0 ( ) n i i
C s r
−
=
=
(7)C. Problem Formulation
In this paper, we want to find a cache management scheme that can maximize the clients’ QoE under limited cache storage space. First, we use the popularity video model to determine the space Crank of each video. Because
the Crank is finite, the total space to store different bit rates
for a video is limited also. What’s more, the stored video bit rate should be larger than . It should be an ascending series with the increase of i. Given these restrictions, the cache desires to respond with the most suitable bit rate to each client, which brings the highest total QoE score. Hence the equation of the cache management can be written as follows:
1 max min 1 0 1 0 1
Max ( , , )
s.t. ( )
0 ( 0,1,..., 1) i
i i
n r B
i r B r i n i rank i i i
F Q r r B drdB
ar b C
r r i n
+ − = − = + = + ≤
− < = −
(8)Replacing the QoE function with its reverse, we can transfer the Max problem into the Min problem:
1 1 0 1 0 1
Min ( , , )
s.t. ( )
0 ( 0,1,..., 1) i max
i min i
n r B
i r B r i n i rank i i i
D Q r r B drdB
ar b C
r r i n
+ − = − = + = − + ≤
− < = −
(9)III. SOLUTION OF VIDEO CACHE MANAGEMENT In this section, we will leverage the Lagrange multiplier method to solve the Equation (9) with the method adopted by [7].
A. Derivation of Optimal Solution
Using the Lagrange method, the Equation (9) can be written as:
1 1
1 1
0 0
)
( , , )i i [n ( i rank] n i (i i )
i i
L r γ u D γ ar b C u r r
− −
+ +
= =
= +
+ − +
− (10)Where γ and are the Lagrange's method’s coefficients, and D is defined by (11).
1
0 0 1 2 3 1
0
( )
i n i
n r B
i
i r B
D + a a r a r a BdrdB
−
=
− + +
=
+ (11)First, we prove that it is a convex problem by checkout Hessian matrix of the objective function. Then, KKT condition is utilized to solve the equation, and a set of slack variable z and di are introduced to the equation. So the
Equation (10) can be rewritten as in (12).
1 1 2 1 1 0 0 2 ( , , , ) [ ( ] ( , ) )
i i i
n n
i rank i i i i
i i
L r u z d
D ar b C z u r r d
γ
γ − − + +
= =
=
+
+ − + +
− + (12)Leverage the KKT condition, we take the partial derivatives to each variable. From Equation (12), we can obtain the function as follows:
1 1 1 0
i i i i i
i
r qr sr ta u u
r L
p − + + + + + +
∂ = − =
∂ (13)
1 0 2 ) 0 ( n i rank i L b
ar C z
γ −
= −
∂ = + + =
∂
(14)2 0
L z
z γ
∂ = =
∂ (15)
2
1 i 0
i
i i L
r r d
u +
∂ = − + =
∂ (16)
2 i i 0 i
u d L d
∂ = =
∂ (17)
Where p, q, s, t are constants that represent the multiplier before the variables.
B. Analysis of Optimal Solution
It is obvious that ≠ 0, because if = 0, can be equal to , which goes against the assumption of the condition. Moreover, we want to maximize the total QoE, so we must fully utilize the space of the cache. And in this case, the variable z should be equal to zero. Therefore we can simplify the above function as follows.
1 1 1 0
i i i i i
r qr sr
p − + + + + ta+ u+ − u = (18)
1
0
2
( ) rank 0
n i i b z ar C − = + − + =
(19)1
2 0
i i i
Finally, to solve this nonlinear system, we use the method of trust-region-dogleg [8]. We leverage the solver (i.e. fsolve) provided by MATLAB to solve it, which implement the trust-region-dogleg algorithm. We will discuss more details in Section IV.
IV. EXPERIMENTALRESULTS
In this section, we provide the experimental results of the cache management for HTTP ABR streaming. Firstly, we describe experimental settings, and then analyze the experimental results. Following that, we will present the specified cache management.
A. Experimental Settings and Result Analysis
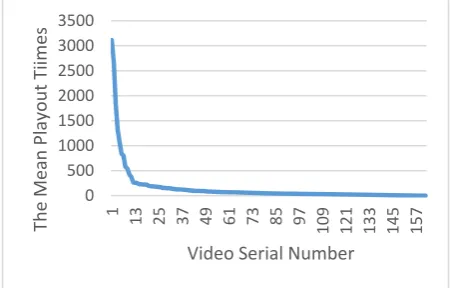
The Popularity Video Model: This model is to ensure the size of each video stored on the cache. We investigate the whole community’s playout video investigated, whose IP is http://bt.byr.cn/. We use the times of playout to present the popularity of the video for each video. With the statistics, we obtain Fig. 2.
In Fig. 2, the horizontal axis is the number of clicks of video watching, and the vertical axis is the number of clicks for each video in descending order. From the figure, we can obviously obtain that the playout time of the top video occupies the majority of the clients’ requests, which is equal to say that providing more space to more popular video is very necessary. And then, we can calculate the spaces allocated for different videos according to Equation (2).
The Mapping Model: This experiment aims to find out the mapping among the request rate, the response rate, the bandwidth and the QoE. The experiment is divided into two parts: the client and the server .The client part is modeled by Potplayer which is a player that can get the request by the URL. And the server part is simulated by the Apache on the Linux (Kernel 2.6). The function of the server includes two parts: (1) store the video clips requested by the users; (2) control the e-gress traffic of the server, which is implemented by the TC.
QoE can be measured by the Mean Opinion Score (MOS) from 1 to 5, where 5 represents the most excellent and 1 represents the worst. We have conducted an experiment to test the MOS of QoE with different request rates and different bandwidths. In this subjective tests, we invited 20 no-experiment viewers with normal or correct-to-normal vision.to join the single simulated test for
Figure.2 Distribution of the video popularity
TABLE I. The example of test Data The request
rate(KB) bandwidth(KB) The response rate(KB) MOS 3500 3000 2700 4.2 3500 3000 2000 3.7 3500 3000 1300 3.1 2000 2000 1700 4.8 2000 1500 1700 4.7 2000 1000 1700 3.0 2000 700 1700 1
evaluation based on the Adjectival Categorical Judgment Methods in [1].And the test condition includes the viewing, facility setup and data screen following the ITU recommendations [9] and [10]. In our experiment, we have three independent variables and one dependent variable. For each test, we fix two independent variables and change the third one. The test data are exemplified in Table I.
The whole experiment data are illustrated in Fig. 3. It provides the rate-MOS results for the selected videos. From the figure we can see that the relationship of the request rate, the response rate and the bandwidth is almost a linear relation. This result verifies the QoE Equation of (5).
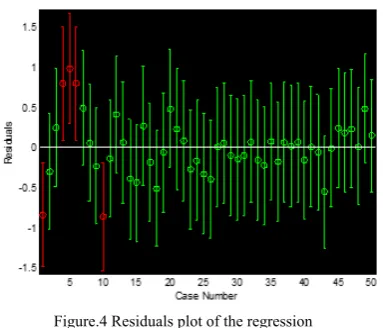
In order to solve the QoE function, we leverage the solver (i.e. Regression) provided by MATLAB. Fig. 4 shows that the effect of the regression is excellent. From this residual plot, we can obviously see that only a few of the items deviated from the confidence intervals. The results of the regression are shown in Table II.
B.The Solution of the Cache Management for a Specified Bandwidth Distribution
In this section, the specified result will be presented for a fixed bandwidth distribution. We assume that the distribution of the bandwidth conforms to a uniform distribution. The biggest bandwidth is 7000KB, and the smallest bandwidth is 200KB. And the total size of the cache is 5000 KB. The specified cache management results are presented in Table III. From TABLE III we can see that in our scheme, when the number of stored video is 5, the QoE reaches the maximal value.
Figure.3 The mapping of the QoE function 0
500 1000 1500 2000 2500 3000 3500
1 13 25 37 49 61 73 85 97
109 121 133 145 157
The
Mean Playout Tiimes
Video Serial Number 3000
4000 5000
6000
0 2000 4000 6000
0 1000 2000 3000 4000 5000 6000
( )
The Request Bite Rate KBPS The Response Bite Rate(KBPS)
T
h
e
B
and
W
idt
h(K
)
Figure.4 Residuals plot of the regression
TABLE II. Coefficients for the QoE function in Equation (5)
TABLE III.The Specified Distribution of the Cache Management
V. CONCLUSION
In this paper, we propose a new QoE-driven video cache allocation scheme for mobile cloud server in cellular networks. The cache management changes dynamically with the clients’ transmission condition, such as the bandwidth. We first presented a mapping model between the request rate, the response rate, the bandwidth and the QoE. Then, the Lagrange multiplier method is introduced to solve the mapping equation, and to obtain the number of versions that need to be stored in the cache server. As future work, we will consider other distribution models of the bandwidth to emulate the real condition more appropriately. And we will also consider how to find the optimal number of cached videos.
REFERENCES
[1] Cisco, Cisco Visual Networking Index: Forecast and Methodology, 2012 - 2017, 2013. .
[2] I. Hofmann, N. Farber, and H. Fuchs, “A study of network performance with application to adaptive HTTP streaming,” in Proc. IEEE Int. Symp. Broadband Multimedia Systems and Broadcasting (BMSB), 2011, pp. 1–6. [3] C. Liu, I. Bouazizi, and M. Gabbouj, “Rate adaptation for adaptive HTTP streaming,” in Proc. 2nd Annu. ACM Conf. Multimedia Systems, 2011, pp. 169–174.
[4] V. Adzic, H. Kalva, and B. Furht, “Optimized adaptive HTTP streaming for mobile devices,” in Proc. SPIE, 2011, vol. 8135, pp.81350T–81350T-10.
[5] A. B. Reis, J. Chakareski, A. Kassler, and S. Sargento, “Distortion optimized multi-service scheduling for next-generation wireless mesh networks, “in Proc. INFOCOM IEEE Conf. Computer Communications Workshops, 2010, pp. 1–6.
[6] S. Thakolsri, W. Kellerer, and E. Steinbach, “QoE-based rate adaptation scheme selection for resource-constrained wireless video transmission, “in
Proc. ACM Multimedia, 2010, pp. 783–786
[7] Zhang W, Wen Y, Chen Z, et al. QoE-driven cache management for HTTP adaptive bit rate streaming over wireless networks[J]. Multimedia, IEEE Transactions on, 2013, 15(6): 1431-1445.
[8] J. Nocedal and S. J.Wright, Numerical Optimization. NewYork, USA: Operations Research, Springer, 1999.
[9] ITU-R Rec. BT.500 -11, Methodology for the subjective assessment of the quality of televisions pictures, 2002.
[10] ITU-R Rec. P.910,Subjective video quality assessment methods for multimedia applications, 1999
R
2.3991 -0.3379 0.5483 0.1981 0.9198
N (The number of
video version)
The stored versions of different video rates
The MOS of The
fixed version 4 200KB,299.4KB,1299.2KB,3199.4KB 3.4 5 200KB,278.8KB,500.5KB,1306.9KB,2
713KB
4.2
6 200KB,256KB,550.3KB,1000.7KB,129 3.5KB,1700.3KB