Journal of Engineered Fibers and Fabrics 19 http://www.jeffjournal.org
Effect of Alkali Treatment on the Quality of Hemp Fiber
Jie Zhang; Hua Zhang; Jianchun Zhang
Beijing University of Chemical Technology, Beijing, Beijing CHINA
Correspondence to:
Jie Zhang email: [email protected]
ABSTRACT
An orthogonal experimental design was employed to study the effects of the bath ratio, time, and alkali dosage of alkali treatment on the chemical composition, fineness, average length, and staple rate of hemp fiber. Through normalization and average weight distribution of multiple indices, the quality of hemp fiber was quantified. Results of range analysis showed that the optimum quality of hemp fiber can be achieved under the following conditions: alkali treatment bath ratio, 1:10; time, 5 h; alkali dosage, 10 g/L; and length of hemp fiber, 16 mm to 29 mm. The reliability and repeatability of the best experimental conditions were further confirmed.
Keywords: hemp fiber, orthogonal experiment,
chemical composition, fineness, normalization
INTRODUCTION
In recent years, hemp fiber has attracted considerable attention because of its good antibacterial properties and unique appearance and feel. Research on hemp fiber and its applications continues to expand [1]. As an important member of bast fibers, hemp has low cellulose content, and thick fiber [2] because of the massive non-cellulose compositions on its surface. These compositions bind cellulose molecules, binding originally fine and short single fibers into fiber bundles through mutual adhesion [3]. After reaping, separation, and processing, the non-cellulose compositions (lignin and pectin) of hemp bast are removed constantly; hence, the content and fineness of the fiber gradually increase, whereas the fiber length shortens continuously [4-5]. Therefore, determining how to acquire a hemp fiber that complies with all quality indices well and averagely by controlling the treatment technology in the processing and manufacturing processes is a key research subject.
Alkali treatment has been used for years as an important method for studying the structures and properties of natural fibers. Several studies reported on the structures and properties of fibers, such as cotton, ramie, and so on [6-9]. Alkali treatment can also be used to remove non-cellulose compositions in
hemp bast [10-11]. Although this treatment remarkably improves fiber quality [12-14], it gives rise to salient environmental pollution. Therefore, bioiological or physical processes are used to replace chemical processes in the production of hemp bast [15]. However, replacing chemical processes completely by a single biological or physical process cannot achieve the appropriate effects required in practical application [16], because hemp bast contains massive non-cellulose compositions. Hence, to date, alkali treatment is still the most direct and efficient way of improving hemp fiber quality.
In this paper, the effects of alkali treatment on hemp fiber qualities, such as chemical compositions, fineness, length, and distribution were investigated. The effects of different factors on hemp fiber quality were determined through normalization and average weight distribution of the multiple indices of hemp fiber quality. The optimum conditions for alkali treatment were also provided, serving as a theoretical basis for hemp fiber processing and manufacturing.
MATERIALS AND METHODS Materials
The hemp studied in this paper is the local hemp variety planted in Beian, Heilongjiang Province. After warm water retting and stalk and bast separation, the hemp was processed into hemp bast. The fiber length was 80 cm to 100 cm, fineness was 11.11 dtex to 14.29 dtex, and regain was 11.4%. The chemical composition was 7.06% pectin, 18.17% hemicellulose, 20.92% lignin, and 53.85% cellulose. The experimental facility used is the HUHT-250/350 yarn package dyeing machine (1 kg) produced by Hisaka Corporations Ltd., processing 600 g of samples per batch.
Methods
Experiment Design
on multiple fiber indices by adopting the orthogonal experimental method. Based on the selected Orthogonal Table L16 (43), three influencing factors
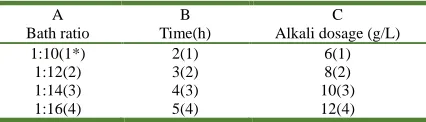
were divided into four levels. A total of 16 experiments were performed, with the samples designated as s1 to s16. The alkali treatment was carried out at a temperature of 120 °C and a pressure of 0.2 MPa. Table I lists each factor and its level. Before the alkali treatment, the hemp bast was pretreated at 50 °C in 2 g/L sulfuric acid solution for 30 min. After the alkali treatment, the fiber was refined using a mild low alkali concentration. The hemp fiber was obtained after bleaching and carding.
TABLE I. Factors and levels in the orthogonal test.
A Bath ratio
B Time(h)
C Alkali dosage (g/L)
1:10(1*) 2(1) 6(1)
1:12(2) 3(2) 8(2)
1:14(3) 4(3) 10(3)
1:16(4) 5(4) 12(4)
* Levels refer to the bracket part.
Chemical Composition Analysis
The chemical composition of the fiber was determined according to the Chinese textile industry standards[17]. The steps are as follows:
(1) A total of 1.2 g of each sample was placed into a weighing bottle, dried to a constant weight at 105 °C, and then weighed after cooling (W0).
(2) The samples were placed in 100 mL conical flasks with stoppers and then washed two or three times with 70% ethanol. Then, the ethanol was removed,
and a 50 mL solution of 0.5%
ethylenediaminetetraacetic acid was added, extracting for 30 min at 105 °C. The solution was filtered with a core funnel, washed four to five times with hot distilled water, dried to a constant weight at 105 °C, and then cooled. The residue was washed one time or two times with acetone in the core funnel and then placed in 100 mL conical flasks with stoppers after air drying. A total of 50 mL 0.5 mol/L hydrochloric acid was added, hydrolyzing the solution for 60 min at 105 °C. The solution was filtered again with the core funnel and then washed four to five times with hot distilled water. The solution was dried to a constant weight at 105 °C and then weighed after cooling (W1).
(3) The residue was washed one time or two times with acetone in the core funnel and then placed into 150 mL tall beakers after air drying. A total of 15 mL 72% sulfuric acid was added, and the mixture was extruded with glass rod several times until the
solution became homogenate. A total of 100 mL distilled water was added and left overnight. The solution was filtered with a core funnel of a known weight and washed five to six times with hot distilled water. The residue was kept, dried together with the core funnel to a constant weight at 105 °C, and then weighed after cooling. Deducting the weight of the core funnel, we obtained the weight of lignin (W2).
The cellulose content (%) was calculated as follows:
(1)
Fineness
The test for fiber fineness was conducted according to the Chinese national standards [18], and the steps are as follows:
(1) A total of 300 mg fibers were taken to be tidied by hand pulling and then tiled straightly and averagely. The fibers were combed two to three times with a card wire. These samples were divided into several groups according to their different lengths, with a regular end and an end with a width of approximately 10 mm to 15 mm.
(2) Each fiber group was cut into 10 mm samples with a Y171 cutter and placed in a glass pane in order.
(3) A total of 200 fibers were counted from each group to be weighed, and these fibers were pressed with pieces of glass. For the incompletely separated fibers whose bifurcation lengths reached ≥5 mm, the number of fibers was counted according to the bifurcated fibers.
(2)
(3)
where i is the fiber group (generally four to five groups), niis the number of fibers in group i (pieces),
Mi is the weight of group i (mg), Di is the fineness of
group i (dtex), and D is the fineness of the samples (dtex).
Length
Journal of Engineered Fibers and Fabrics 21 http://www.jeffjournal.org
TABLE II. Results of the orthogonal test.
Sample
Cellulose(%) Fineness(dtex) Average length(mm) Staple rate (%)
Fiber quality
s01 80.60(0) 4.82(0.38) 26.51(0.79) 5.12(1) (0.54) s02 89.25(0.84) 5.54(0) 24.47(0.63) 13.16(0.87) (0.58) s03 85.69(0.50) 5.43(0.06) 22.26(0.45) 20.37(0.75) (0.44) s04 86.87(0.61) 4.19(0.72) 23.36(0.54) 32.15(0.55) (0.61) s05 82.40(0.18) 4.22(0.70) 20.12(0.28) 22.86(0.71) (0.47) s06 81.04(0.04) 4.99(0.29) 24.66(0.64) 22.67(0.71) (0.42) s07 88.60(0.78) 4.96(0.31) 20.05(0.28) 33.34(0.53) (0.47) s08 88.74(0.79) 4.60(0.50) 29.22(1) 12.69(0.88) (0.79) s09 88.70(0.79) 4.23(0.70) 25.37(0.70) 6.52(0.98) (0.79) s10 87.86(0.71) 3.66(1) 16.97(0.03) 53.33(0.21) (0.49) s11 88.32(0.75) 4.61(0.49) 24.07(0.59) 14.63(0.84) (0.67) s12 88.83(0.80) 5.49(0.03) 16.53(0) 65.79(0) (0.21) s13 89.66(0.88) 3.75(0.95) 24.84(0.66) 19.64(0.76) (0.81) s14 90.88(1) 4.68(0.46) 27.67(0.88) 11.55(0.89) (0.81) s15 86.06(0.53) 4.96(0.31) 27.33(0.85) 22.29(0.72) (0.60) s16 84.99(0.43) 4.82(0.38) 24.63(0.64) 35.22(0.50) (0.49)
(1) A total of 150 mg fibers were taken to be tidied by hand pulling and then tiled straightly and averagely. The fibers were combed two to three times with a card wire for 2 to 3 times. These samples were divided into several groups according to their different lengths, with a regular end and an end with a width of approximately 10 mm to 15 mm.
(2) One end was held by hand, and the other end was pulled into the shape of a pen point. The fibers were extracted with a clip from the long ones to the short ones, and the fibers were tiled from left to right along a straight line averagely and in parallel.
(3) The fiber lengths were measured with a measure gauge, and the fibers were grouped by a class interval of 10 mm (fibers with a length of ≤15 mm were considered short). The fibers in all groups were taken with a pair of tweezers, and the lengths of each group were recorded in order. The fibers were weighed correspondingly.
(4)
where is the average fiber length (mm), Gi is the
weight of each group of fibers (mg), and Li is the
average length of the corresponding group of fibers (mm).
For fibers with a length of ≤15 mm, the staple rate was calculated according to the following formula:
(5)
where G is the gross of staple fibers with a length of ≤15 mm (mg) and Gi is the weight of each group of
fibers (mg).
RESULTS AND DISCUSSION Analysis of Orthogonal Experiment
Based on earlier research and analysis on the chemical compositions of hemp fibers, a high content of lignin is present in hemp bast, and a proper temperature for alkali treatment is the best way to remove lignin efficiently. The best temperature for removing lignin is 175 °C, and a temperature of over 175 °C would not have an obvious beneficial effect on lignin removal. In obtaining high-purity cellulose products, the alkali treatment at high temperatures removes the non-cellulose compositions excessively, causing short fibers and high staple rates. Hence, the current paper replaced the traditional alkali treatment at high temperatures by applying a mild alkali treatment to obtain high-quality hemp fibers, having the temperature maintained at approximately 120 °C. This paper studied some key indices that affect fiber product quality to obtain fiber products that meet all indices. Such qualities include cellulose content, fineness, average length, length distribution, and staple rate of ≤15 mm. The results are presented in
84 86 88
Staple rate Fineness
A1 A2 A3 A4 B1 B2 B3 B4 C1 C2 C3 C4 A1 A2 A3 A4 B1 B2 B3 B4 C1 C2 C3 C4 Cellulose
4.0 4.5 5.0
20 22 24 26
A1 A2 A3 A4 B1 B2 B3 B4 C1 C2 C3 C4 A1 A2 A3 A4 B1 B2 B3 B4 C1 C2 C3 C4 Average length
10 15 20 25 30 35 40 45
FIGURE 1. Relationship between factors and individual indices.
As shown in Figure 1, alkali dosage has the greatest effect on cellulose content, followed by time. Bath ratio has the smallest effect on cellulose content. The larger the alkali dosage, the higher the cellulose content. However, when the alkali dosage exceeds 10 g/L, the cellulose content begins to fall. A longer time is also good for increasing the cellulose content, but it should not be too long either; 4 h is the optimum time obtained in this experiment. Considering that bath ratio has a minor effect on cellulose content, a small bath ratio should be selected to improve the efficiency of the alkali treatment in increasing cellulose content.
The alkali dosage also has the largest effect on fiber fineness, followed by bath ratio. The alkali treatment time has the smallest effect. Over time, fineness initially decreases and then increases. Generally, large alkali dosage, long treatment time, and small bath ratio are good for improving fiber fineness.
Bath ratio and alkali dosage are the primary factors affecting the staple rate of fibers that are ≤15 mm, followed by treatment time. The effects of each factor on the staple rate have no obvious patterns; however, generally, small bath ratio, alkali treatment time, and proper alkali dosage are beneficial for decreasing the staple rate.
Alkali treatment time and alkali dosage have large effects on the average fiber length. Increasing treatment time and alkali dosage initially shortens and then lengthens the average fiber length. An alkali treatment time of 5 h and an alkali dosage of 10 g/L are quite effective. A change in bath ratio has an almost negligible effect on the average fiber length. Hence, selecting a small bath ratio is more appropriate. After the alkali treatment, the length has an obvious tendency to be distributed, as shown in
Figure 2. Domestically, cotton fibers with lengths of ≤15 mm are classified as short fibers, whereas those with lengths of >29 mm are classified as long staples
of good quality. Therefore, the paper divides the fiber lengths of each group into three distribution ranges: area I (≤15 mm), area II (16 mm to 29 mm), and area III (≥30 mm). Area I has short fibers, low weight fraction, and moderate number of points (31 points); area II has moderate fiber length and weight fraction but the most number of points (42 points); area III has long fibers, the highest weight fraction, and the least number of points (16 points). This distribution shows that the hemp fiber lengths are roughly distributed in area II within the range of 16 mm to 29 mm.
10 15 20 25 30 35 40 45
0 5 10 15 20 25 30 35 40 45 50 55 60
s01 s02 s03 s04 s05 s06 s07 s08 s09 s10 s11 s12 s13 s14 s15 s16 Polynomial Fit of the optimum
W
ei
gh
t p
er
cen
tag
e (
%
)
Length (cm)
Ⅲ Ⅱ
Ⅰ
FIGURE 2. Length and its distribution of a hemp fiber.
Normalization
Measuring the quality of fiber products is not enough because of multiple indices. Moreover, the simple advantage of these four indices does not reflect the real quality of the fiber products because the digital quantization among multiple indices is different. Hence, this paper adopts the normalization method
y = (x - MinValue) / (MaxValue - MinValue), where x
and y represent the values before and after transformation, respectively, and MaxValue and
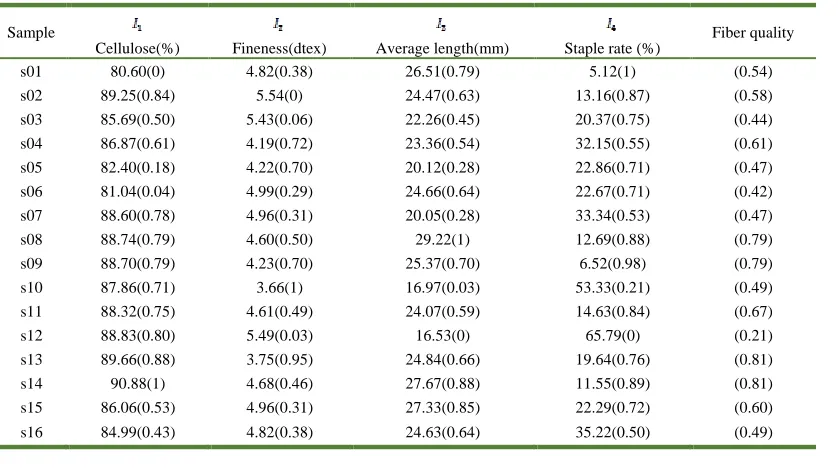
MinValue represent the maximum and minimum numbers of samples, respectively. The normalized data were obtained after the normalized processing of multiple indices. The best value among each independent index is defined as 1, and the worst 0. We presumed that the four independent indices have the same effects on hemp fiber quality, that is, each index takes up one fourth, and no mutual interaction exists among each index. Fiber quality was quantified and defined as the sum of the normalized data of the four independent indices. Bracket part in Table II
shows the normalized data of the multiple indices and the calculated fiber quality.
Journal of Engineered Fibers and Fabrics 23 http://www.jeffjournal.org
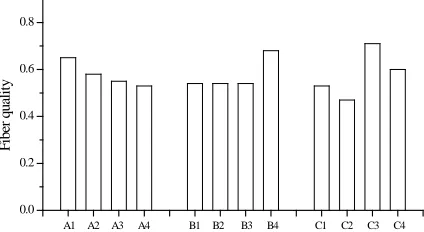
that the alkali dosage is the primary factor that affects fiber quality, whereas bath ratio and treatment time have similar effects on fiber quality. A comparison of the qualities of the samples shows that as the bath ratio increases, the fiber quality gradually decreases, and a bath ratio of 1:10 achieves the best effect for the alkali treatment. In addition, the change in fiber quality is not apparent for an alkali treatment time of 4 h; thus, 5 h is more appropriate. Alkali dosage has a large effect on fiber quality, but without an apparent pattern. The optimum fiber quality can be obtained at an alkali dosage of 10 g/L. Therefore, evaluation of fiber quality suggests that the optimum experimental conditions are as follows: bath ratio, 1:10; treatment time, 5 h; and alkali dosage, 10 g/L. Based on these optimum conditions, confirmatory experiments were conducted. Table III lists the experimental results.
0.0 0.2 0.4 0.6 0.8
A1 A2 A3 A4 B1 B2 B3 B4 C1 C2 C3 C4
F
ibe
r qua
li
ty
FIGURE 3. Relationship between the factors and quality of hemp fiber.
TABLE III. Confirmatory experiments on the optimum experimental conditions.
Cellulose (%) Fineness (dtex)
Average length (mm)
Staple rate (%)
88.23 4.31 28.60 16.1
The curve portion of Figure 2 shows the fiber length and its distribution in the confirmatory experiment. After a polynomial fitting of the length distribution of the best scheme, we obtained
y = 0.0136x3 - 1.0722x2 + 26.693x - 188.93 and the correlation coefficient R² = 0.9996, where x
represents the fiber length and y represents the fiber quality. By comparing the fitted curve of the best scheme with the distribution points of each group’s fiber lengths in the orthogonal experiment, we found that their distributions are basically the same, reflecting the overall distribution of hemp fiber lengths. The four independent indices in the best scheme do not reach the maximum values of each single index in the orthogonal experiment, but these indices are at an ideal level. These results indicate that the experiment has certain reliability and repeatability.
CONCLUSION
In this paper, hemp fibers of good quality were obtained through the alkali treatment. The following conclusions are drawn by adopting the orthogonal experimental design.
(1) In the orthogonal experiment of the alkali treatment, small bath ratio and proper alkali dosage are conducive for increasing cellulose content and improving fiber fineness and staple rate of ≤15 mm.
(2) The fiber lengths are distributed in three ranges: area I (≤15 mm), area II (16 mm to 29 mm), and area III (≥30 mm). Area I has short fibers and low weight fractions; area II has moderate fiber lengths and weight fraction; area III has the longest fibers and the highest weight fraction. The hemp fiber lengths are roughly distributed in the range of 16 mm to 29 mm.
(3) Through the normalization and digitalization of multiple indices, the quantitative definition of fiber quality, and the range analysis, the best alkali treatment conditions were found to be as follows: bath ratio, 1:10; treatment time, 5 h; and alkali dosage, 10 g/L. Such conditions make each quality index of the hemp fiber ideal. The fiber length distribution in this experiment roughly represents the general distribution of hemp fiber lengths.
REFERENCES
[1] Mirjana K, Biljana P, Petar S, “Quality of chemically modified hemp fibers”, Technology, 99, 2008, 94-99.
[2] Jaldon C G, Dupeyre D, Vignon M R, “Fibres from semi-retted hemp bundles by steam explosion treatment”, Biomass and Bioenergy, 14, 3., 1998, 251-260.
[3] Zhang J C, “Structure and properties of china hemp fiber”, Chemical Industry Press., Beijing, 2009, 34-37.
[4] Hobson R N, Hepworth D G, Bruce D M, “Quality of fibre separated from unretted Hemp Stems by Decortication”, Journal of Agricultural Engineering Research, 78, 2., 2001, 153-158.
[5] Kamat J, Roy D N, Goel K, “Effect of Harvesting Age on The Chemical Properties of Hemp Plants”, Journal of Wood Chemistry and Technology, 22, 4, 2002, 285-293.
[7] Mwaikambo L Y, Ansell M P, “Chemical Modification of Hemp, Sisal, Jute, and Kapok Fibers by Alkalization”, Journal of Applied Polymer Science, 84, 2002, 2222-2234.
[8] Niaz A, Tahir K, “Effect of Temperature of Alkali Solution on Mercerization”, Textile Research Journal, 59, 1989, 772.
[9] Eronen P, Osterberg M, “Anna-Stiina Jaaskelainen. Effect of alkaline treatment on cellulose supramolecular structure studied with combined confocal Raman spectroscopy and atomic force microscopy”, Cellulose, 16, 2009, 167-178.
[10] Feng X X, Chen J Y, Zhang H P, “Effect of High Temperature Alkali Cooking on the Constituents, Structure and Thermal Degradation of Hemp Fiber”, Journal of Applied Polymer Science, 208, 2008, 4058-4064.
[11] Wang H M, Postle R, Kessler R W, et al. “Removing Pectin and Lignin during Chemical Processing of Hemp for Textile Applications”, Textile Research Journal, 73, 2003, 664.
[12] Zhang J Q, Zhang J C,” Effect of Refined Processing on Physical and Chemical Properties of Hemp Bast Fibers”, Textile Research Journal, 80, 8, 2010, 744-753. [13] Zhang J Q, Zhang J C, “Effect of finishing
treatment with softening agent on spinnability of hemp fibre”, Indian Journal of Fibre & Textile Research, 35, 2010, 115-120.
[14] Kostic M, Pejic B, Skundric P, “Quality of chemically modified hemp fibers”, Bioresource Technology, 99, 2008, 94-99. [15] Nykter M, Kymalainena H R, Thomsen A B, et
al,” Effects of thermal and enzymatic treatments and harvesting time on the microbial quality and chemical composition of fibre hemp (Cannabis sativa L.)”, Boomass and Bioenergy, 32., 2008, 392-399.
[16] Zhang J C, Zhang H,” Combined Degumming Technology of Hemp Bast Fiber”, Proceedings of the international conference on advanced textile materials & manufacturing technology, HangZhou, China, 2008, 185-187.
[17] FZ/T30001-92 Quantitative analysis method of the main chemical compositions in ramie. [18] GB/T 18147.4-2000 Test method for hemp
fiber- Part 4: Test method for fineness of hemp fiber.
[19] GB/T 18147.3-2000 Test method for hemp fiber- Part 3: Test method for length of hemp fiber.
[20] Zhuang C Q, He C X, “Application of mathematical statistics”, 3rd ed., South China Science and Technology University Press., Guangzhou, 2006, 249.
AUTHORS’ ADDRESSES
Jie Zhang Hua Zhang Jianchun Zhang
Beijing University of Chemical Technology 15 Beisanhuan East Road, Chaoyang District Beijing, Beijing 100029