Elhassan. World Journal of Engineering Research and Technology
ACCURACY COMPARISON OF TOTAL STATION (TS) AND GLOBAL
POSITIONING SYSTEM (GPS) IN DETERMINING HEIGHT WITHIN
AN URBAN ENVIRONMENT
Prof. Ismat M. Elhassan*
Civil Engineering Department, College of Engineering, KSU, Riyadh Saudi Arabia.
Article Received on 10/01/2019 Article Revised on 31/01/2019 Article Accepted on 22/02/2019
ABSTRACT
Positioning accuracy of earth surface points is usually needed for
various surveying and engineering projects. All the traditional methods
of spatial measurement such as theodolites and differential levels give
highly acceptable accurate spatial data. They are however, time
consuming and consequently expensive. The use of modern technology
such as GPS and Total Station is becoming favorite in the field of spatial measurement. For
this reason, such techniques of point poisoning are becoming widely used. Considerable
research results showed that GPS horizontal positioning accuracy compete well with Total
Station. The objective of this paper, however, is to evaluate and compare accuracy of Total
Station (TS) and Global Positioning System (GPS) in height determination within an urban
environment. Network of height control points for accuracy comparison of these two
techniques was established using a digital level.Test results show that GPS is 5 times less
accurate than TS in elevation determination. Height accuracy obtained using TS was 0.004m,
while height accuracy obtained using GPS in Fast Static mode was 0.020m in an urban
environment for a nine points traverse of total distance around 400m.
KEYWORDS: Accuracy; height; GPS; Total Station; Control Network; Standard Deviation.
1. INTRODUCTION
One of the main objectives of surveying is the determination of the terrestrial or
three-dimensional position of points on the earth surface. These points are usually used to establish
World Journal of Engineering Research and Technology
WJERT
www.wjert.org
SJIF Impact Factor: 5.218*Corresponding Author
Prof. Ismat M. Elhassan
control points for topographic or detailed maps and boundaries for cadastral survey.
Topographic mapping using digital photogrammetry or any other approach requires ground
control established in three dimensions.
Topographic maps are important for various applications such as planning and construction
of engineering projects related to ground surface, geological exploration, hydrological and
meteorological services and submerged topography or bathymetry (Akpinar and Aykut,
2017).
Contour maps indicating the shape and elevation of the land over the entire parcel is usually
required for many applications, some of which are given below
Spot heights covering the entire survey area showing high points, low points, grade
changes, and representation of the general character of the terrain.
Longitudinal and cross sections for earthwork calculations
Main floor elevations of buildings.
Elevations of lakes, rivers, streams or drainage courses.
Elevation of bench marks used as control for the survey.
One of the output of three dimensional spatial measurements is the digital elevation model
(DEM). DEMs support all construction activities and infrastructure engineering in urban and
rural environments, as well as mapping and monitoring the natural environment.
The vertical precision is also important for many applications (Lin, 2004; Kutalmis, et al,
2017; Alizadeh-Khameneh, et al, 2018; Weaver, et al, 2018).
The fundamental basics of land surveying have been in use for long time. One of the most
important elements that affect the accuracy of land surveys are the tools that the land
surveyors use. The tools and apparatus used in surveying, however, have passed drastic
development that has really improved the accuracy of land surveys.
One of the most popular and preferred tools used to ensure the accuracy of land surveys is the
total station (TS). The TS is an electronic theodolite which includes an electronic distance
measurement device (EDM) and a processing unit. GPS systems are also preferred and used
crowded with buildings and with dense tree cover or construction areas (Pirti, et al, 2009;
Schloderer, et al, 2017).
Considerable research results showed that GPS horizontal positioning accuracy compete well
with Total Station. On the other hand the height accuracy obtained using GPS is debatable
and not always satisfactory (Ahmed, 2000; Choi, et al, 2007; Kizil and Tisor, 2011; Diwakar
et al, 2014; Sama and Stombaugh, 2014). In the following section a summary of some tests
carried out to investigate height accuracy for TS and GPS will be outlined.
2. LITERATURE REVIEW AND PAPER OBJECTIVE
During the last three decades, a lot of research have been made in analyzing accuracy of both
TS and GPS. Some of the results of such work will be outlined in this section in order to give
brief idea about the overall concept of accuracy of the two techniques: TS and GPS:
In order to check the compatibility of the GPS RTK method with that of total station
method, Ahmed, (2000) tested GPS RTK and total station measurements on an existing
network. According to the result, the difference between the coordinates of total station
and GPS RTK was 2 cm for the horizontal and 3 cm for the vertical coordinates.
According to Featherstone and Stewart, 2001 a 60-point test network, established on Curtin University of Technology’s Bentley Campus in Perth, Western Australia, has been
used to evaluate the accuracy of three different models of RTK GPS equipment as used
by three different contractors. Therefore, these evaluations assess the combined
performance of the RTK GPS equipment as used by each contractor, since they are
inextricably linked. No evidence of any vertical bias in the test network was detected, and
the estimated error in the control WGS84 ellipsoidal heights of 15 mm (95% confidence)
appears to be realistic.
Ceylan, et al 2005 carried out tests to compare height accuracy obtained by different
techniques: geometric levelling using Automatic level with a wooden rod, a Digital level
with a bar coded rod, Trigonometric levelling using a theodolite, a Total Station and a
GPS. The root mean square errors obtained from using these techniques were
respectively: ±3.7mm, ±2.0mm, ±16.4mm, ±14.7mm and ±18.8mm. The last two results
show that Total station height accuracy is better than GPS height accuracy by 25%.
Saghravani, et al, 2009 investigated accuracy comparison of RTK-GPS and automatic
Their results indicate that accuracy of 0-10 cm in the measurement of elevation by
RTK-GPS can be obtained.
Chekole, 2014 carried out a test to compare accuracy and time expenditure of total
station, RTK GPS and terrestrial laser scanner (TLS) using a reference network composed
of 14 control points established by using a Leica 1201 TS. Tet results revealed that TS
giving 1 mm for both horizontal and vertical coordinates, while RTK GPS gave 9 mm in
horizontal and 15mm accuracy in vertical coordinates.
The objective of this paper is to present test height accuracy of TS and GPS that had been
carried out in an open area within an urban environment, KSU campus, where a net of nine
control points were established using a differential digital level.
Methodology of the test including test site and instruments used will first be outlined. Test
operations, results, analysis and conclusions will then follow.
3. METHODOLOGY
In order to evaluate the height accuracy of the instruments under test (a Total Station and a
GPS), a network of control points which can serve as a reference for the comparison was
established. The reference network established is composed of nine control points selected in
a limited open area within King Saud University campus, north of Riyadh, capital of
Kingdom of Saudi Arabia. Sokkia Digital Level SDL30 was used to establish levels of the
control network.
3.1. Test Site
The Kingdom of Saudi Arabia (KSA) occupies about 80% of the Arabian Peninsula (the
world's largest peninsula), lying between latitudes 16° and 33° N, and longitudes 34° and 56°
E. The estimated area of KSA is about 2,149,690 Km2. Riyadh, capital of kingdom of Saudi
Arabia, lies in the center of Arabian Peninsula on latitude 34° - 38’ north and longitude 46o –
43’ east approximately 600 meters above Mean Sea Level in Eastern Najd, a region largely
Fig. 1: Saudi Arabia Map and Riyadh Location.
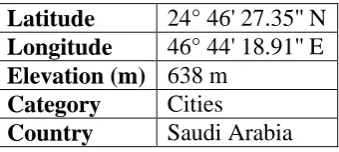
Geographic information of Riyadh city are given in table 1 below:
Table 1: Riyadh Geographic information.
Latitude 24° 46' 27.35'' N
Longitude 46° 44' 18.91'' E
Elevation (m) 638 m
Category Cities
Country Saudi Arabia
The site test is an area within King Saud University (KSU) which falls in the north part of the
city of Riyadh, the capital of KSA. (Figures. 2a and 2b).
Fig. 2a: King Saud University Campus. Fig. 2b: Test Area bounded by red line.
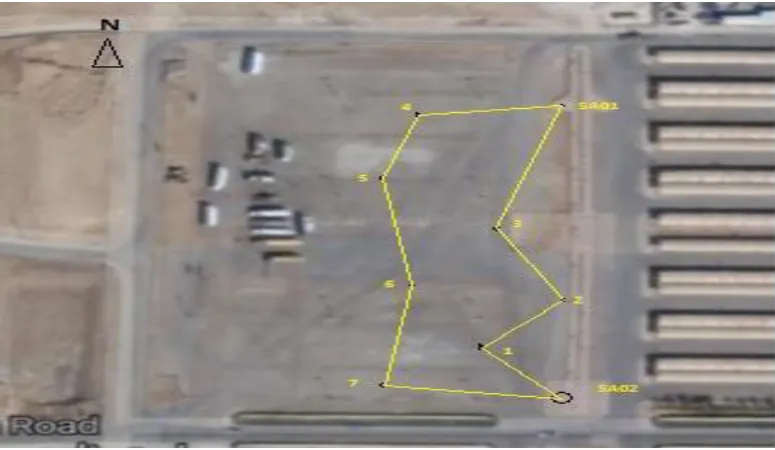
Figure 3 shows the selected nine points traverse connected with traverse lines. The site is a
Fig. 3: Test Site and Control Traverse. 3.2 Test instruments and Techniques
A digital level to determine levels of the nine-points traverse test, while a TS and a GPS were
tested to evaluate the accuracy of each. These instruments will be introduced in the coming
sections.
Differential Digital Level
Leveling is a process of finding the elevation of a given point with respect to the given or
assumed datum. There are three leveling techniques: differential, trigonometric, and
barometric. Differential leveling is the most accurate of the three methods. With the
instrument locked in position, readings are made on two calibrated staffs held in an upright
position ahead of and behind the instrument. The difference between readings is the
difference in elevation between the points. Trigonometric leveling involves measuring a
vertical angle from a known distance with a theodolite and computing the elevation of the
point. With this method, vertical measurements can be made at the same time horizontal
angles are measured for triangulation. It is, therefore, a somewhat more economical method
but less accurate than differential leveling. It is often the only practical method of
establishing accurate elevation control in mountainous areas. In barometric leveling,
differences in height are determined by measuring the differences in atmospheric pressure at
various elevations. Air pressure is measured by mercurial or aneroid barometer, or a boiling
point thermometer. Although the accuracy of this method is not as great as either of the other
There are different models of differential levels. From the point of view of technical design
they can be classified as Optical and Electronic (digital) levels.
The differential level used in this project to provide the height of points of control network is
the digital Sokkia SDL30, with Fiberglass RAB-Code Staff, of accuracy claimed to be ±1mm
for 1 km double run levelling (Figure 4).
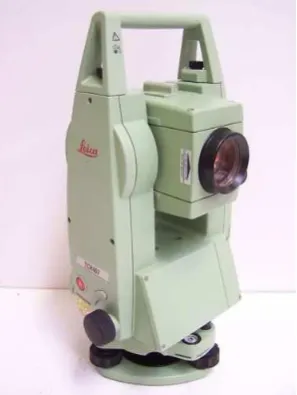
Fig. 4: Sokkia SDL 30 Digital Level. Total station
A TS is a modern surveying instrument that integrates an electronic theodolite with an
electronic distance meter (EDM), in addition to a processing unit.
In this project, Total Station Leica TC 407 (Figure 5) with distance accuracy of 2mm ±2ppm
and angular accuracy of 7” available in the civil engineering department surveying
laboratory, KSU has been selected to be used in height accuracy test.
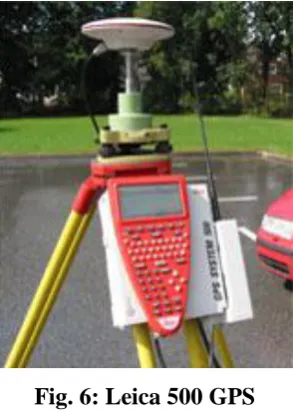
GPS
The Global Positioning System (GPS) is a space based radio navigation system that
provides geolocation and time information to a GPS receiver anywhere on or near the Earth
Surface where there is an unobstructed line of sight to four or more GPS satellites. The GPS
used in this test is Leica 500 (Figure 6). The main components of System 500 are the AT502
dual frequency antenna and SR530 Receiver. Ancillary components are the Terminal,
Batteries, PC Cards and cables.
Fig. 6: Leica 500 GPS
Techniques of GPS measurement that are utilized by surveyors
Static GPS is used for determining accurate coordinates for survey points by simultaneously
recording GPS observations over a known and unknown survey point for at least 20 minutes.
The data is then processed in the office to provide coordinates with an accuracy of better than
5mm depending on the duration of the observations and satellite availability at the time of the
measurements. This procedure allows various systematic errors to be resolved when
high-accuracy positioning is required. Static GPS surveying is a relative positioning technique
which employs two (or more) stationary receivers simultaneously tracking the same satellites.
One receiver, the base receiver, is set up over a point with precisely known coordinates such
as a survey monument. The other receiver is set up over a point whose coordinates are
unknown. This method of surveying is based on collecting simultaneous measurements at
both receivers for a certain period of time, which, after processing, yield the coordinates of
the unknown point. This type of survey is primarily used to create control where no control
exists to very high accuracies (Anquela, et al, 2013). To derive ellipsoid heights on passive
adjustment of long-duration, static, post-processed global navigation satellite system (GNSS)
sessions (Weaver, et al, 2018).
Fast-static GPS surveys are similar to static GPS surveys, but with shorter observation periods (approximately 5 to 10 minutes). Similar to Static mode, it is a carrier-phase-based
relative positioning technique employing two or more receivers simultaneously tracking the
same satellites. However, with rapid static surveying, only the base receiver remains
stationary over the known point during the entire observation session while the rover receiver
remains stationary over the unknown point for a short period, and then moves to another
point whose coordinates are to be determined (Bakula, 2012). This method is suitable when the survey involves a number of unknown points located within the survey area. After collecting and downloading the field data from both receivers, the PC software is used for data processing giving the coordinates of the unknown points.
Advantages of Fast Static mode include
Observation time is dependent on (a) length of the baseline (b) number of visible satellites
No continuous locking is required with moving rover from one station to the next since
each baseline is processed independent of each other. In fact, receivers can be turned off
to preserve batteries (though not recommended).
It may be noted that the initial phase ambiguities can be resolved within a minute for a dual frequency receiver (3-5 minutes for single frequency receivers).
The method does not require re-observation of remote stations like pseudo-kinematic or
reoccupation method.
Accuracies : Similar to static: ± (5-10 mm + 1 ppm); 1:100,000 to 1:1,000,000
Applications of this mode includes: fixing control surveys, detail surveys as well as replacing traversing and ground triangulation.
Advantages: easy, quick, efficient and ideal for short range survey.
Real Time Kinematic (RTK) Observations: This is where one receiver remains in one position over a known point – the Base Station – and another receiver moves between
positions – the Rover Station. The position of the Rover can be computed and stored within a
Table 2: Comparison between Static and Rapid Static GPS Survey.
GPS Mode Observation Time Applications Accuracy
Static Long Control network Higher accuracy
Rapid Static Shorter Many Survey Applications:
engineering, cadastral Lower Accuracy
3.3 Establishment of Height Control Net
A geodetic control network is a network, usually of triangles whose vertices positions are
precisely determined using terrestrial survey methods.
It consists of stable, identifiable points with published datum values derived from
observations that tie the points together.
The digital level Leica SLD 30 was used to determine levels of the traverse net points already
shown in Figure 3 with points SAO1 and SAO2 with levels 658.827m and 657.438m,
respectively, (Table 3) used as bench marks.
Table 3: Coordinates of Control Points SA01 and SA02.
Point East (m) North (m) Elevation (m)
SAO1 663230.700 2735312.290 658.827 SAO2 663230.593 2735177.595 657.438
The closure error of height observation was 0.001m. Elevations of traverse points were
adjusted to close with zero error given in Table 4. These were then used to compare accuracy
of elevations of traverse points obtained by using TS and GPS.
Table 4: Traverse control points (Elevations determined using Digital Level). Point Elevation (m)
SA02 657.438
1 657.575
2 658.122
3 658.699
SA01 658.827
4 658.500
5 658.622
6 658.016
4. TESTS AND RESULTS 4.1Total station Test and results
The Total Station was centered on the control point SA02. Its coordinates were fed in and the
instrument telescope was directed towards the second point SA01, hence recording azimuth
of the reference line. Test points whose levels were already determined using the precise
digital level were observed in turn and their coordinates were recorded as in Table 5. Total
station test results including difference from the precise level results, minimum, maximum,
standard deviations and rmse are given in Table 5.
Table 5: Test points (Elevations determined using TS compared to those determined from Digital Level).
Point Elevation (m) Digital Level Elevation (m) TS dh (m) TS
SA02 657.438 657.438 0.000
1 657.575 657.574 -0.001
2 658.122 658.125 0.003
3 658.699 658.703 0.004
SA01 658.827 658.833 0.006
4 658.500 658.506 0.006
5 658.622 658.625 0.003
6 658.016 658.022 0.006
7 656.991 656.992 0.001
Min 0.001
Max 0.006
Mean 0.004
Standard Deviation, σ 0.004
rmse 0.004
4.2GPS TEST AND RESULTS
Rapid Static mode was used in this test. Steps of measurement are summarized as follows:
- Before data collection planning was carried out to observe theoretical satellite availability.
Most GPS software has the ability to provide a theoretical estimate of the satellite availability
at a given location and time. Data collection is hence planned to be done at times when there
is optimum satellite availability and when the satellites are at appropriate configuration to
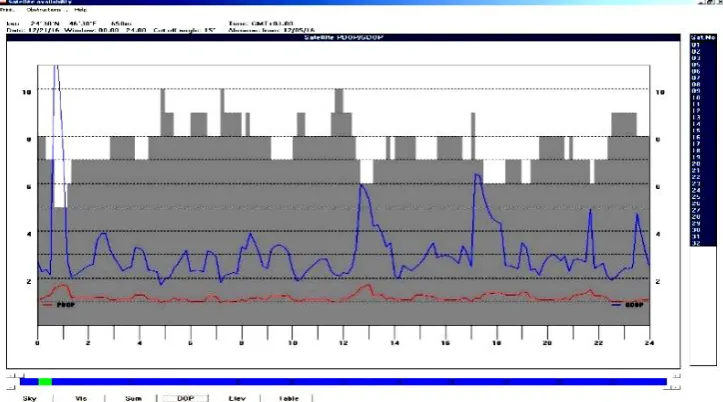
produce an acceptable (lower) PDOP value.Using Satellite Availability program the suitable
dates and intervals for Observations were selected from the charts shown below as given for
both stations SA01 and SA02: Figures 7 and 8 show observation date plan, while Table 6
Fig. 7: SA01 Observation date plan.
Fig. 8: SA02 Observations date plan. Table 6: GPS Observations specifications.
Point GDOP PDOP Period Interval Number of visible satellites
SA01 Max 3.3 Max 1.8 3 Hours 8.35 – 11.48 10
SA02 Max 3.9 Max 1.5 3 Hours 7.43 – 10.45 10
- Set the reference receiver at the reference point (control point: SAO2)
- Set the rover at each point of the nine traverse points for 5 minutes.
- Process the measured data by SKI Program.
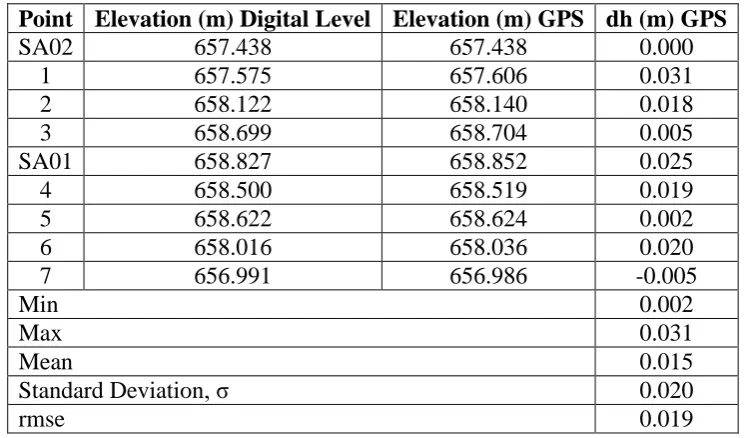
Table 7: GPS Test Results.
Point Elevation (m) Digital Level Elevation (m) GPS dh (m) GPS
SA02 657.438 657.438 0.000
1 657.575 657.606 0.031
2 658.122 658.140 0.018
3 658.699 658.704 0.005
SA01 658.827 658.852 0.025
4 658.500 658.519 0.019
5 658.622 658.624 0.002
6 658.016 658.036 0.020
7 656.991 656.986 -0.005
Min 0.002
Max 0.031
Mean 0.015
Standard Deviation, σ 0.020
rmse 0.019
It is noticed that the errors in both results were in one direction except for point 1 in TS
results and point 7 in GPS results. Subtracting a constant value equal to the standard
deviation from each computed height will improve the results as shown in the table. The
standard deviation of height from TS will be 0.0026m and from GPS will be 0.0137m.
5. ANALYSIS OF RESULTS
Results of both instruments, TS and GPS as compared to the Digital Level are summarized in
Table 8 below.
Table 8: TS and GPS Test Results.
Point Dh (m) (TS) Adj=-0.004m dh (m) (GPS) Adj=-0.020m
SA02 0.000 0.000
1 -0.001 -0.005 0.031 0.011
2 0.003 -0.001 0.018 -0.002
3 0.004 0.000 0.005 -0.015
SA01 0.006 0.002 0.025 0.005
4 0.006 0.002 0.019 -0.001
5 0.003 -0.001 0.002 -0.018
6 0.006 0.002 0.020 0.000
7 0.001 -0.003 -0.005 -0.025
Min 0.001 0.001 0.002 0.001
Max 0.006 0.005 0.031 0.025
Mean 0.004 0.002 0.015 0.008
σ 0.004 0.003 0.020 0.014
From the above table of results the maximum and minimum height closure errors when using
TS are 6mm and 1mm respectively, while the rmse of heights is ±3mm. For the GPS the
maximum and minimum height errors are 31mm and 2mm, respectively, and the rmse is
±13mm. This means that the height accuracy of the GPS is almost 1/4th of the TS height
accuracy. This result confirms what is usually stated by other researchers when comparing
height accuracy of TS and GPS.
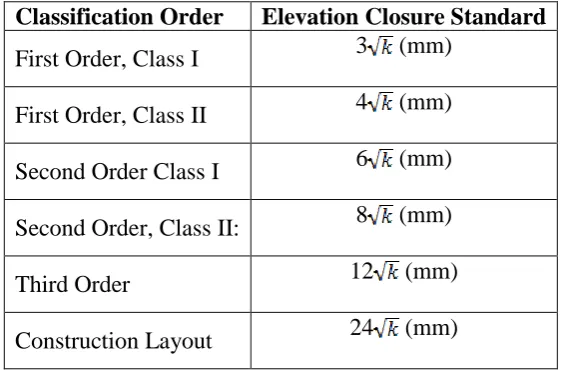
California Department of Transportation (CARLTRANS), 2015 adopts the minimum closure
standards for vertical controls set by Federal Geographic Data Committee (FGDC) which is
given in Table 9 below.
Table 9: Minimum Elevation Closure Standards for Vertical Control Surveys. Classification Order Elevation Closure Standard
First Order, Class I 3 (mm)
First Order, Class II 4 (mm)
Second Order Class I 6 (mm)
Second Order, Class II: 8 (mm)
Third Order 12 (mm)
Construction Layout 24 (mm)
Comparing the height accuracy obtained using GPS Fast Static Mode with the elevation
closure standard set by FGDC, it can be deduced that GPS can easily be used for height
determination for construction works, since it satisfies a height closure of 20
USGS topographic maps adhere to "National Map Accuracy Standards". The vertical
accuracy standard requires that the elevation of 90 percent of all points tested must be correct
within half of the contour interval. On a map with a contour interval of 1.0 m, the map must
correctly show 90 percent of all points tested within 50 cm of the actual elevation. Hence
6. CONCLUSIONS AND RECOMMENDATIONS
The purpose of this research is to compare accuracy in elevation between Total Station and
GPS where the references are a set of traverse points whose elevations were determined using
a digital level.
A network of nine control points was constructed using the digital level, with 2 control points
already existing. Test of GPS was based on Fast-Static mode.
The obtained results from this test confirmed previous results about height accuracy of the
Total Station and GPS in fast static mode. One can differentiate which instrument should be
used for which specific application depending on the presented results and the project
requirements.
GPS Fast Static can fairly be used for height determination for construction works where the
minimum height standard error is to be less than 24 .
For survey applications which require high accuracy to serve as height reference, such as
height control point establishments, it is recommend to use TS instead of GPS.
REFERENCES
1. Ahmed, E.M. Performance Analysis of the RTK Technique in an Urban Environment,
Australian Surveyor, 2000; 45(1): 47-54.
2. Akpinar, B. and N. O. Aykut Determining the Coordinates of Control Points in
Hydrographic Surveying by the Precise Point Positioning Method. Journal of Navigation,
2017; 70(6): 1241-1252.
3. Alizadeh-Khameneh, M. A., Horemuz, M., M. Jensen, A. B. O. and Andersson, J. V.
Optimal Vertical Placement of Total Station. Journal of Surveying Engineering, 2018;
144(3).
4. Anquela A.B., Martin A., Berné J. L. and Padín J. GPS and GLONASS Static and
Kinematic PPP Results. Journal of Surveying Engineering, 2013; 139(1): 47–58.
5. Bakula, M. An approach to reliable rapid static GNSS Surveying. Survey Review, 2012;
44(327): 271-285.
6. California Department of Transportation. Classification of Accuracy and Standards,
7. Ceylan, A., Inal, C. and Sanlioglu, I., Modern Height Determination Techniques and
Comparison of Accuracies. FIG Working Week 2005 and GSDI-8., 2005; 14.
8. Chekole, S. D. Surveying with GPS, total station and terrestrial laser scanner a
comparative study. Master of Science Thesis in Geodesy No. 3131, TRITA-GIT EX
14-001, School of Architecture and the Built Environment, Royal Institute of Technology
(KTH), Stockholm, Sweden, 2014.
9. Choi, D. C. T., J. Y. K. Wong, and B. S. B. Chan. Investigation on GPS Height Accuracy
with the use of Hong Kong Satellite Positioning Reference Station Network. FIG
Working Week, 13-17 May 2007, Hong Kong SAR, China, 2007.
10.Diwakar, P. S., A. Kumar and S. K. Katiyar. Horizontal Accuracy Assessment of
Differential GPS. International J. of Emerging Technology and Advanced Engineering,
2014; 4(12): 356-360.
11.Ehsani, M. R., S. K. Upadhyaya and M. L. Mattson. Seed Location Mapping Using RTK
GPS. Transactions of the ASAE, 2004; 47(3): 909−914.
12.Featherstone, W. E. and Stewart, M. P., Combined Analysis of Real-Time Kinematic
GPS Equipment and Its Users or Height Determination. Journal of Surveying
Engineering, 2001; 127(2).
13.Geodetic Survey Section, Survey and Mapping Office, Lands Department, Accuracy
Standards of Control Survey (Version 2.0). www.geodetic.gov.hk/data
/specifications/Accuracy%20Standards, 2010.
14.Kizil, U. and L. Tisoe. Evaluation of RTK-GPS and Total Station for Applications in
Land Surveying. J. Earth Systems Sciences, 2011; 120(2): 215-221.
15.Kutalmis, G. K., M. Q. Selbesoglu and C. T. Celik Accuracy investigation of height
obtained from Classical and Network RTK with ANOVA test”. Measurement, 2016; 90:
135-143.
16.Leica Geosystems, 2000. GPS 500 System, General Guide to Static and Rapid Static.
Geosystems AG, Heerbrugg, Switzerland, 2000. http://www.surveyequipment.com
/PDFs/GPS500-General-Guide.pdf.
17.Lin, L.S. (2004). Application of GPS RTK and total station systems on dynamic
monitoring land use. Proceedings of the ISPRS Congress, Vol. XXXV, ISSN 1682-1750,
12-23 July, Istanbul, Turkey, 2004.
18.Pirti, A., N. Arslan, B. Deveci, O. Aydin, H. Erkaya, & R. G. Hosbas, Real-Time
Kinematic GPS for Cadastral Surveying. Survey Review, 2009; 41: 314. 339-351
19.Sama, M. P. and T. S. Stombaugh, Performance Evaluation of a Tracking Total Station
as a Position Reference for Dynamic GNSS Accuracy Testing. Applied Engineering in
Agriculture, 2014; 30(4): 557-563 © 2014 American Society of Agricultural and
Biological Engineers ISSN 0883-8542 DOI 10.13031/aea.30.10596.
20.Schloderer, G., Bingham M., Awange J. L. and Fleming K. M., Application of
GNSS-RTK derived topographical maps for rapid environmental monitoring: a case study of
Jack Finnery Lake (Perth, Australia).Journal of Surveying Engineering, 2017; 143(30).
21.Weaver, B., D. T. Gillins and M. Dennis, Hybrid Survey Networks: Combining