Copyright © The Author(s). All Rights Reserved. Published by American Research Institute for Policy Development DOI: 10.15640/jeds.v7n2a4 URL: https://doi.org/10.15640/jeds.v7n2a4
Multi-Drug Resistant Tuberculosis in Developing and Developed Countries: A Study of
GNI per capita, Human Development Index and the incidence of Multi-Drug Resistant
Tuberculosis
Gina Dhinsa
1& Bosu Seo
2Abstract
This paper explores the factors contributing to Multi-Drug Resistant Tuberculosis (MDR-TB) in developing and developed countries. Existing studies indicated that low income and low human development factors contribute to widespread antimicrobial resistance in developing countries. Such factors are examined in depth by performing statistical measures on a sample size of 171 countries from recent data provided by the World Bank and the United Nations Development Programme. First, the relationship between Gross National Income (GNI) per capita and incidence of MDR-TB was tested and a strong correlation was not found. Second, the Human Development Index and incidence of MDR-TB are researched and a strong correlation was not found. The findings of this study indicate that despite the perception that a low income and human development index are among the main causes of antimicrobial resistance, underdevelopment and poverty may not play as large of a role in antimicrobial resistance as originally thought. Thus, policies aiming to combat antimicrobial resistance cannot group countries based on their level of development or income – there are several other factors that must be accounted for. Policies tailored to individual countries and their existing antimicrobial environment is recommended to combat antimicrobial resistance.
Keywords: Antimicrobial Resistance, GNI per capita, Human Development Index, Multi-Drug Resistant Tuberculosis, Statistical Analysis
1. Introduction
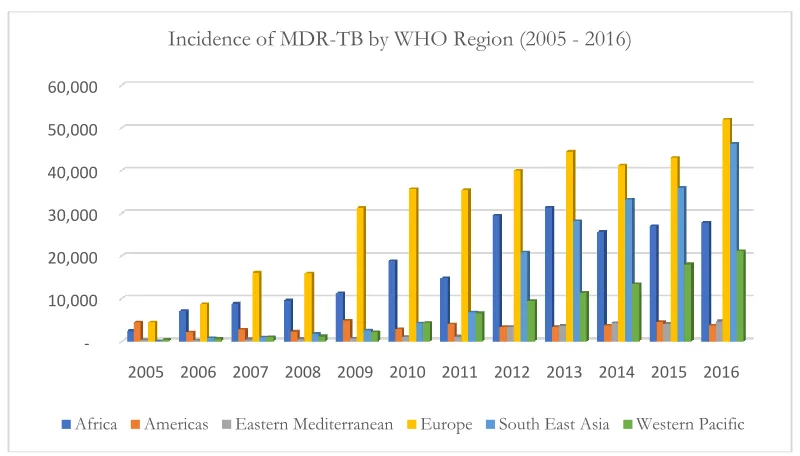
In September of 2016, world leaders gathered at the United Nations General Assembly to address the recent and ever-growing threat of antimicrobial resistance (AMR) (Fleck & Humphreys, 2016). AMR has the serious potential of reversing achievements made by modern medicine by resurfacing communicable diseases that caused substantial mortality prior to the use of antibiotics (WHO, 2014). For example, in 2016 there were 600,000 new cases of Multi-Drug Resistant Tuberculosis (MDR-TB) alone, leaving a significantly large portion of the global population without the means to treat TB (WHO, 2017).The WHO is placing an increased importance on the growing issue of MDR-TB (see Figure 1).
Through the use of recent country-level data provided by the World Health Organization (WHO), the United (UN) and the World Bank (WB), this paper analyzes the issue of MDR-TB from a development economics standpoint. First, the relationship between Gross National Income (GNI) per capita of a country and its incidence of MDR-TB is researched. Second, the relationship between a nation’s Human Development Index (HDI) and incidence of MDR-TB is examined to gain an extensive understanding of the factors that may affect antimicrobial resistance.
Tuberculosis (TB) is an infectious, communicable disease that causes illness in approximately 10 million people worldwide each year(WHO, 2017).TB is the ninth leading cause of worldwide death, and the WHO has placed a large emphasis on combating it (WHO, 2017). Multi-Drug Resistant TB (MDR-TB) is defined as a resistance to anti-TB drugs rifampicin and isoniazid (WHO, 2017).
1 Global Development Studies, University of the Fraser Valley
According to the Oxford Vaccine Group (2018), the bacilli Calmette-Guérin vaccine used to prevent TB is only effective 70-80% of the time in preventing severe forms of TB and is even less effective at preventing the most common form of TB (pulmonary).The WHO (2017) continues to stress the importance for a more effective TB vaccine to be developed.
2. Review of existing literature
Several works of literature discussing the relationship between antimicrobial resistance (AMR), income and human development have been compiled and grouped together by theme to provide insight into the current understanding of AMR. On the whole, it is argued that countries with lower human development and GNI per capita experience a high prevalence of AMR, largely due a high burden of disease and malnutrition, the cost and quality of antibiotics, and the types of health care systems in place (Alsan et al., 2015; Atabe, Ayukekbong & Ntemgwa, 2017; Bhutta et al., 2005; WHO, 2017).
2.1 High burden of disease and malnutrition
The high burden of disease in developing countries is one of the central reasons that underdevelopment and antibiotic misuse are linked. Those living in developing countries are exposed much more frequently to infectious diseases than those in developed countries, largely due to living conditions (Atabe et al., 2017; Okeke, 2010). This significantly affects the ability of populations to lead healthy lives and provides an explanation for the increased presence of AMR in less developed countries (Atabe et al., 2017; Byarugaba, 2004).
For example, developing countries (predominantly in Africa), are currently facing an AIDS epidemic, and due to a weakened immune state, HIV-positive populations are extremely vulnerable to acquiring TB (WHO, 2017). 1.0 million of the 10.3 million cases of TB reported globally in 2016 occurred in HIV-positive populations (WHO, 2017). Such patients require an increased use of antimicrobials to fight disease, increasing the risk for developing drug resistant strains. Further, HIV positive patients in hospitalized settings often face a high rate of exposure to drug resistant pathogens as a result of poor infection control, largely increasing the incidence of antimicrobial resistance in countries with large HIV/AIDS-positive populations (Bhutta et al., 2005; WHO, 2017).
Additionally, it is argued that MDR-TB is more common in countries with lower income and human development due to the high prevalence of malnutrition in these countries (WHO, 2017). Malnutrition weakens the body’s immune defense against infection and has been labeled by the WHO (2017) as a leading risk factor for acquiring TB. Due to the large undernourished population in low-income/less developed countries, malnutrition is responsible for nearly twice as many TB cases as HIV – 1.9 million of the 10.4 million globally reported cases of TB in 2016 were due to malnutrition (WHO, 2017). Those unable to afford proper nutrition are at an income level with low access to antibiotics, resulting in the misuse of the limited antibiotics available and an increased number of MDR-TB strains(Alsan et al., 2015; WHO, 2017).
2.2 Antibiotic cost and quality
The high prevalence of MDR-TB in developing countries is largely due tothe economic implications of receiving antibiotics and the resulting quality of antibiotics received (Atabe et al., 2017; WHO, 2017). In many developing countries, access to suitable medical care is often costly and inaccessible, resulting in inexperienced individuals practicing self-medication, or seeking medical care from less regulated private health care providers(Alsan et al., 2015; WHO, 2017).
Additionally, those living in poverty often receive weakened doses of antibiotics, shorten treatment cycles, and/or use lower quality and expired antimicrobials, due to the high cost of these drugs (Atabe et al., 2017). Byarugaba (2004) argues, “Economic hardships in developing countries lead to premature cessation of treatment or sharing one single dose of treatment by a whole family.” Such practices increase the incidence of MDR-TB in developing countries. Due to this high prevalence of AMR in developing countries, more toxic and costly forms of antimicrobials must be produced, deepening the cycle of unaffordability and resistance (Byarugaba, 2004).
2.3 Health care system
The coexistence of public and private healthcare system options in many developing countries also contributes to an increased incidence of antimicrobial resistance, including MDR-TB (Alsan et al., 2015; WHO, 2017). It was found in a study published by The Lancet Infectious Disease in 2015 that out-of-pocket health expenditures are strongly related to antimicrobial resistance in developing countries (Alsan et al., 2015). This data was retrieved from 47 developing countries requiring fixed payment amounts for specific services, called co-payments, on antimicrobials in the public sector (Alsan et al., 2015).
It is argued that high co-payment costs for public sector antibiotics in developing countries causes large portions of populations to seek less expensive private-sector care (Alsan et al., 2015). This is due to private healthcare systems existing alongside public health care systems in developing countries, to the extent by which an increase in price in one sector increases demand, or use, in the other sector for antibiotics (Alsan et al., 2015). Consequently, incentives are often created for informal private suppliers to overprescribe antibiotics (which are often low-quality), resulting in increased incidences of AMR in developing countries (Alsan et al., 2015). For example, Nigeria has one of the highest global incidences of MDR-TB (WHO, 2017), and it was found that 78% of low-quality drugs prescribed in Nigeria were from private health care providers who shortened treatments and/or provided drugs at weakened strengths (Alsan et al., 2015). Thus, co-payments in the public sector may lead to a problematic increase in less regulated private-sector drug prescriptions, and in turn, resistance to drugs used to treat TB and other diseases.
3. Data collection and results
MDR-TB data, GNI per capita data, and HDI data have been gathered using a sample size of 171 countries. The sampled countries used in this study are listed in Appendix A& B of this report, and represent all countries with available MDR-TB, GNI per capita, and HDI data.
First, we explore a possible correlation between a country’s GNI per capita in 2016 (World Bank Atlas method) and its incidence of MDR-TB in 2016. A negative relationship between GNI per capita and MDR-TB is hypothesized, by which an increase in GNI per capita will denote a decrease in the incidence of MDR-TB. This hypothesis arose based on the literature cited in the previous section, which qualitatively explains that low human development and low incomes create widespread antibiotic resistance in less developed countries.
Second, we explore the relationship between the level of human development and incidence of MDR-TB. HDI and incidence of MDR-TB will be correlated such that an increase in a nation’s HDI will denote a decrease in its incidence of MDR-TB. This hypothesis comes from the understanding in the cited literature that less developed countries (in terms of income and education/health) will have a very high prevalence of antimicrobial resistance.
3.1. GNI per capita and MDR-TB
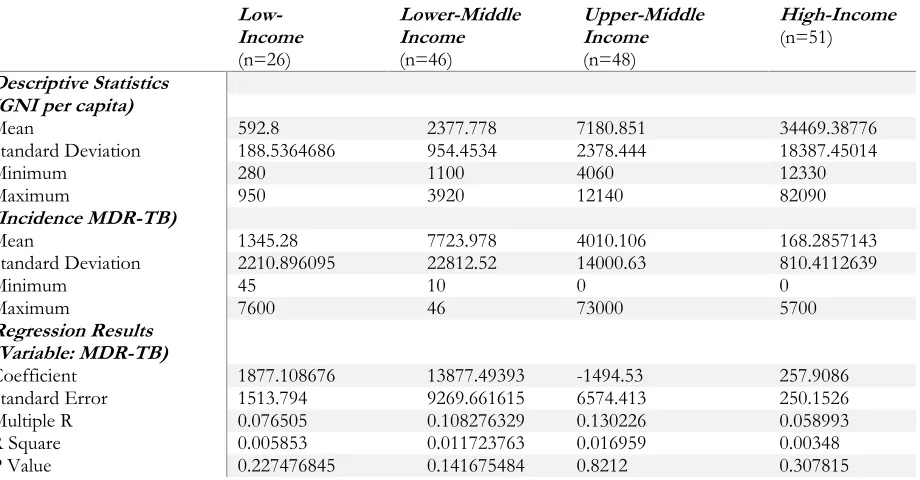
Table 1. Statistical results – GNI per capita &Incidence of MDR-TB Low- Income (n=26) Lower-Middle Income (n=46) Upper-Middle Income (n=48) High-Income (n=51) Descriptive Statistics (GNI per capita)
Mean 592.8 2377.778 7180.851 34469.38776
Standard Deviation 188.5364686 954.4534 2378.444 18387.45014
Minimum 280 1100 4060 12330
Maximum 950 3920 12140 82090
(Incidence MDR-TB)
Mean 1345.28 7723.978 4010.106 168.2857143
Standard Deviation 2210.896095 22812.52 14000.63 810.4112639
Minimum 45 10 0 0
Maximum 7600 46 73000 5700
Regression Results (Variable: MDR-TB)
Coefficient 1877.108676 13877.49393 -1494.53 257.9086
Standard Error 1513.794 9269.661615 6574.413 250.1526
Multiple R 0.076505 0.108276329 0.130226 0.058993
R Square 0.005853 0.011723763 0.016959 0.00348
P Value 0.227476845 0.141675484 0.8212 0.307815
When observing the relationship between the GNI-per capita and the prevalence of MDR-TB and in low-income countries, the correlation coefficient is 0.077 and the coefficient of determination is 0.006. These low r and R2 values indicate that there is not a strong correlation between GNI per capita and MDR-TB in low-income countries. This contradicts the overall perception that the lower the level of income is, the higher the prevalence of MDR-TB will be. However, the p-value is 0.227, which indicates that the null hypothesis should not be completely rejected.
Similarly, the correlation coefficient is 0.108 and the coefficient of determination is 0.012 when studying a correlation between GNI per capita and MDR-TB in lower-middle income countries. The p-value is also relatively high in this relationship, with a value of 0.142.In upper-middle income countries, the correlation coefficient and coefficient of determination are also low, respectively, 0.130 and 0.017. The p-value is highest in this income group, with a value of 0.821, indicating that the null hypothesis should not be rejected.
The regression results in regards to high income countries produced a relatively low correlation coefficient of 0.059 and a coefficient of determination of 0.003. The p-value is 0.308, again indicating that the null hypothesis should not be entirely rejected. Upon observing the descriptive statistics in the relationship between GNI per capita and MDR-TB, interesting findings can also be observed. Most notably, the mean incidence of MDR-TB does not consistently decrease as income increases. Instead, the order from the highest to lowest mean incidence of MDR-TB is: lower-middle income countries, upper-middle income countries, low-income countries, and then high income countries. In regards to the average incidence of MDR-TB, as income increases, MDR-TB does not necessarily decrease. This questions some of the qualitative information discussed in the existing literature section of this paper that heavily credits income-related factors to antimicrobial resistance.
3.2. Human Development Index and MDR-TB
Table 2 shows descriptive statistics as well as a regression analysis performed on the relationship between HDI and the incidence of MDR-TB. Among low HDI groups, human development and incidence of MDR-TB produced a correlation coefficient of 0.15478 and a coefficient of determination of 0.024, which indicate a relatively weak correlation between HDI and MDR-TB. The p-value is 0.563, demonstrating that the null hypothesis should not be rejected.
Table 2. Statistical results– HDI & Incidence of MDR-TB
Low HDI
(n=36) Medium HDI (n=38) High HDI (n=50) Very High HDI (n=47)
Descriptive Statistics (HDI)
Mean 0.467 0.628789474 0.753897959 0.881
Standard Deviation 0.050395495 0.047612262 0.028302124 0.040690703
Minimum 0.352 0.55 0.701 0.8
Maximum 0.541 0.698 0.796 0.949
(MDR-TB)
Mean 1872.028571 8159 2731.306122 1567.695652
Standard Deviation 3717.828236 24974.05495 10815.30943 9297.133988
Minimum 29 10 0 0
Maximum 20000 147000 73000 63000
Regression Results (Variable: MDR-TB)
Coefficient -3431.5 5746.324 34406.78 55377.12
Standard Error 5881.084 54372 41341.5 28328.87
Multiple R 0.15478 0.007468 0.11018 0.272823
R Square 0.023957 5.58E-05 0.01214 0.074433
P Value 0.56342 0.916419 0.409385 0.056836
When observing the relationship between HDI and the incidence of MDR-TB in countries with medium human development, we found extremely low correlation and the coefficient of determination. Consistent with the previous findings in this report, the p-value when analyzing HDI and MDR-TB in countries with medium human development was high (0.916).
For countries with high human development, low coefficients of correlation and determination and relatively high p-values were found when analyzing the relationship between HDI and MDR-TB. High human development countries have a correlation coefficient of 0.110, a coefficient of determination of 0.012 and a p-value of 0.409. The coefficient of correlation, determination and p-value for countries classified as very high human development are, respectively, 0.273, 0.074 and 0.057. The p-value for countries with very-high human development thus drops from the p-value seen in high human development countries. The regression findings are significant, as they do not completely support the current understanding of AMR in the existing literature section of this paper, which states that underdevelopment and poverty are among the leading causes of antimicrobial resistance. By considering health, education and income factors, the regression in regards to HDI and MDR-TB revealed that underdevelopment and poverty may not play as large of a role in antimicrobial resistance as originally thought.
Descriptive statistics performed on the data collected further support this idea, as it was found that the mean incidence of MDR-TB does not consistently decrease as human development level increases. The order from the highest to lowest mean incidence of MDR-TB was found to be: medium human development (8159), high human development (2731.3), low human development (1872) and very high human development (1567.7). Among one of the most notable observations is that countries will low human development and high human development do not differ significantly in regards to their incidence of MDR-TB. These findings question the idea that lower levels of human development and high incidences MDR-TB are strongly related.
4. Policy implications and concluding remarks
Byarugaba (2004) summarizes this standpoint by stating that, “the problem of antimicrobial resistance is greatly influenced by poverty and the factors related to it.” The results from the statistical measures performed on nation-level data in regards to GNI per capita, HDI and MDR-TB indicate that the issue of antimicrobial resistance is complex and the root causes of this issue are much deeper than just a low incomeor low human development index. This contradicts the general understanding that poverty and underdevelopment are among the leading factors contributing to MDR-TB. There is still evidence, however, to place importance on the fact that a low GNI per capita and a low HDI are contributing factors to MDR-TB.
Thus, in order to address the complex global issue of antimicrobial resistance, this study argues in favour of approaches that break down this global issue to the individual nation-level. The statistical evidence produced in this study shows that when determining the causes of antimicrobial resistance, we cannot group countries based on their level of development or income – there is ample variation that must be accounted for. This variation, and a specific country’s root causes of AMR, could be explained and combated by working with individual governments and organizations to create national AMR frameworks. By working with individual countries, policies would be appropriate to and tailored for the specific environment they are being implemented in.
For example, in India the incidence of MDR-TB is extremely high (147,000 cases reported in 2016), despite the nation being considered a lower-middle income nation and holding medium human development. Studies just observing AMR in India indicate that resistance is seriously prevalent due to over-the-counter sales making antibiotics accessible to populations at large (Chaundry & Laxminarayan, 2016; Divyapriya, Nambi, Sivagami, Srinivasan, & Vignesh, 2018). Similarly, Chaundry & Laxminarayan (2016) argue that rapid economic growth combined with poor public health infrastructure, rising incomes, high burdens of disease, as well as low-cost and low-regulated antibiotic sales account for the high rates of drug resistant strains in India. Therefore, policies aiming to combat antimicrobial resistance in India could be more tailored to antibiotic accessibility and regulation, rather than just income or development level.
In many ways, the World Health Organization and its partner agencies have developed action plans and key policy recommendations to combat AMR, including: national plans and accountability, surveillance and laboratory capacity, access to essential medicines, regulation of medicines, education and awareness, infection prevention and control, and innovation and research (WHO, 2015). The results of this study support such measures and would argue for the increased use of national plans.
Additionally, individual countries should ensure that policies are appropriate for their unique regions, rather just implementing policies based the success of another country. This can be done through pilot projects, developing national annual indicators to track the incidence of MDR-TB and creating programs to ensure that the public is well informed about the risks and causes of AMR (Dar et al., 2016; WB, 2017).
References
Alsan, M., Bhattacharya, J., Eggleston, K., Kammili, N., Kolli, P. &Schoemaker, L. (2015). Out-of-pocket health expenditures and antimicrobial resistance in low-income and middle-income countries: an economic analysis. The Lancet Infectious Diseases, 15(10), 1203-1210. doi:10.1016/s1473-3099(15)00149-8
Ashok, A., Caudron, Q., Gandra, S., Grenfell, B. T., Laxminarayan, R., Levin, S. A. & Van Boeckel, T. (2014). Global antibiotic consumption 2000 to 2010: an analysis of national pharmaceutical sales data. The Lancet Infectious Diseases, 14(8), 742-750.
Atabe, A.N., Ayukekbong, J.A &Ntemgwa, M. (2017). The threat of antimicrobial resistance in developing countries: causes and control strategies. Antimicrobial Resistance And Infection Control, 6(1), 1-8. doi:10.1186/s13756-017-0208-x
Bhutta, Z.A., Duse, A.G., Jenkins, P., Klugman, K. P., O'Brien, T. F., Okeke, Iruka N., Pablos-Mendez &Laxminarayan, R. (2005). Antimicrobial resistance in developing countries Part I: recent trends and current status. The Lancet Infectious Diseases, 5(8), 481-493. doi: 10.1016/S1473-3099(05)70189-4
Byarugaba, D. (2004). Review: Antimicrobial resistance in developing countries and responsible risk factors. International Journal of Antimicrobial Agents, 24(2), 105-110. doi:10.1016/j.ijantimicag.2004.02.015
Dar, O., Hasan, R, Schlundt, J., Harbarth, S., Caleo, G., Dar, F., Littmann, J., Rweyemamu, M., Buckley, E., Shahid, M., Kock, R., Li, H., Giha, H., Khan, M., So, A., Bindayna, K., Kessel, A., Pedersen, H., Permanand, G., Zumla, A., Rottingen, J., Heymann, D. (2016). Exploring the evidence base for national and regional policy interventions to combat resistance. The Lancet,387(10015), 285-295. Retrieved From: https://doi.org/10.1016/S0140-6736(15)00520-6
Delarocque-Astagneau, E., Garin, B., Guillemot, D., Huynh, B. &Padget, M. (2016). Bacterial neonatal sepsis and antibiotic resistance in low-income countries. The Lancet, 387(10018), 533-534. doi:10.1016/S0140-6736(16)00220-8
Divyapriya, G., Nambi, I. M., Sivagami, K., Srinivasan, R., & Vignesh, V. J. (2018). Antibiotic usage, residues and resistance genes from food animals to human and environment: An Indian scenario. Journal of Environmental Chemical Engineering. doi:10.1016/j.jece.2018.02.029
Fleck, F. &Humphreys, G. (2016). United Countries meeting on antimicrobial resistance. Bulletin of The World Health Organization, 94(9), 638-639. doi:10.2471/BLT.16.020916
Okeke, I. N. (2010). Poverty and Root Causes of Resistance in Developing Countries. Antimicrobial Resistance in Developing Countries,27-35. doi:10.1007/978-0-387-89370-9_3
Oxford Vaccine Group. (2018, March). BCG Vaccine (TB vaccine). Retrieved from http://vk.ovg.ox.ac.uk/bcg-vaccine
United Countries. (2014). Country classification. Retrieved from
http://www.un.org/en/development/desa/policy/wesp/wesp_current/2014wesp_country_classification.pdf United Countries Development Programme. (2016). Human Development Reports. Retrieved from
http://hdr.undp.org/en/composite/HDI
World Bank. (2018a). World Development Indicators DataBank. Retrieved from
http://databank.worldbank.org/data/reports.aspx?source=world-development-indicators
World Bank. (2018b). The World Bank Atlas method - detailed methodology. Retrieved from https://datahelpdesk.worldbank.org/knowledgebase/articles/378832-what-is-the-world-bank-atlas-method World Bank. (2017). World Bank Country and Lending Groups. Retrieved from
https://datahelpdesk.worldbank.org/knowledgebase/articles/906519-world-bank-country-and-lending-groups
World Health Organization (WHO). (2014). Antimicrobial Resistance Report on Global Surveillance. Retrieved from: http://apps.who.int/iris/bitstream/10665/112642/1/9789241564748_eng.pdf
World Health Organization (WHO). (2017). Global Tuberculosis Report 2017. Retrieved from http://www.who.int/tb/publications/global_report/en/
Figure 1. MDR-TB by Region
Data Source: World Health Organization (2018)
Appendix A: Country classification by National Income
-10,000 20,000 30,000 40,000 50,000 60,000
2005 2006 2007 2008 2009 2010 2011 2012 2013 2014 2015 2016
Incidence of MDR-TB by WHO Region (2005 - 2016)