~ 200 ~ WWJMRD 2018; 4(3): 200-204
www.wwjmrd.com International Journal Peer Reviewed Journal Refereed Journal Indexed Journal UGC Approved Journal Impact Factor MJIF: 4.25 E-ISSN: 2454-6615
R. Venkatesh Aravindh Doctoral Research Scholar, Department of Journalism and Mass Communication, Periyar University, Salem, Tamil Nadu, India
Correspondence: R. Venkatesh Aravindh Doctoral Research Scholar, Department of Journalism and Mass Communication, Periyar University, Salem, Tamil Nadu, India
Programme Popularity and Preference among
Television Viewers in Trichy
R. Venkatesh Aravindh
Abstract
The roots of television as a medium in India dates back to 1975. It was at that time the Central government thought of experimenting with the introduction of Cable television in India. But, it was not easy at seemed in implementing it to the huge population at that time. There were genuine concerns as to how the medium will be accepted, the level of penetration among the masses. There were also great concerns about the effectiveness of the medium among the masses in the long run. The government then decided to join in partnership with NASA through ISRO to test the impact of Cable TV in the country. The Cable TV transmission then started after a series of visits by teams from both the organizations. It was a grand success. Majority of the success was attributed to the telecast of agricultural and educational programs. It garnered greater acceptance and popularity especially among the farmers and other pockets of the grass roots people. Although the telecasting was not supported by NASA after a period of one year, the government decided upon itself to continue this particular method. As years progressed, through its own mediawing- the Doordarshan, the government telecasted programs of various genres and introduced varieties of content to view on TV. There was wide acceptance and popularity for many of their programs. This research study aims to explore the preferred timing of watching television by the users and to find out the popularity of various TV programs. The study will also seek answers in finding out about the likeliness of users in suggesting TV programs. The researcher has employed quantitative research approaches to elicit response from the respondents.
Keywords:Television, users, medium, popularity, preference
1. Introduction 1.1 Television
The first major expansion of television in India began in 1972, when a second television station was opened in Bombay. This was followed by stations in Srinagar and Amritsar (1973), and Calcutta, Madras and Luck now in 1975. In 1975, the government carried out the first test of the possibilities of satellite based television through the SITE (Satellite Instructional Television Experiment) program. Faced with the difficulty of administering such an extensive television system television as part of All India Radio, the government constituted Doordarshan, the national television network, as a separate Department under the Ministry of Information and Broadcasting.
1.2 Television programs and Users
adverse effect of television is a matter of great concern. The harmful effects have been often postulated and reported. But no serious scientific attempts have been made to confirm this. Television viewing is quite random these days. People are more addicted to it rather than giving time to their dear ones. The number of TV owning homes has come a long way, more than 100 million TV households have been accounted for so far
2. Review of Literature
2.1 Television Impact and Viewing
Television is considered as an electronic carpet which seems to transport millions of persons each day to far off places (Trivedi, 1991). It is relatively a new medium that has made its impression on every aspect of mundane life. It is bouncing its signal on space satellites and uses oceanic cables to transmit live telecast to its beneficiaries. This electronic medium ensures its visibility without any global discrimination. It is reported that television made its visibility some more than sixty years ago. People were not only sceptical about it, but were also jealous, unkind and even hostile. Over a short span of time, however, it emerged as a remarkable medium of communication, entertainment and education. It needs to be mentioned that it found its space in all countries of the world and has transformed our planet into a ‘gigantic electronic village’ bringing various people and continents close (Bushan, 1992). Over the years it became a central dimension of our everyday activity and in our country it has grown at a phenomenal pace. In India, television was introduced 25 years after its invention and 30
years after its inception through Government efforts to introduce public service broadcasting. The idea was primarily education and access to rural population.
2.2 Popularity Television shows in India
Madhusudan, K. (2006) in his study suggested that traditional media are local and are able to establish direct rapport with the audiences. They are low cost media as compared to the sophisticated mass media. Mohanty B. B. (1995) suggested that agricultural extension, health education, population education, rural development and public information through the use of modern mass communication media have become more popular for the use of the rural urban masses.
3. Objectives of The Study
The main objectives of the study are
To find the preferred timing for watching television among users.
To find out the likeliness of respondents in suggesting
the program.
4. Research Methodology
The methodology employed in this study is one of a quantitative nature and takes the form of survey method. Hence the researcher confined the research into quantitative content analysis technique for this study.
5. Analysis
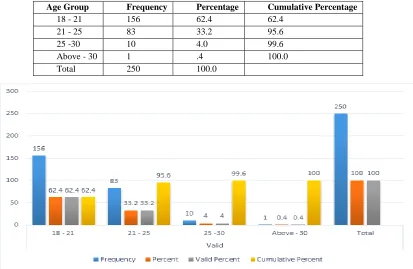
Table 1: Age Group of respondents
Age Group Frequency Percentage Cumulative Percentage
18 - 21 156 62.4 62.4
21 - 25 83 33.2 95.6
25 -30 10 4.0 99.6
Above - 30 1 .4 100.0
Total 250 100.0
~ 202 ~
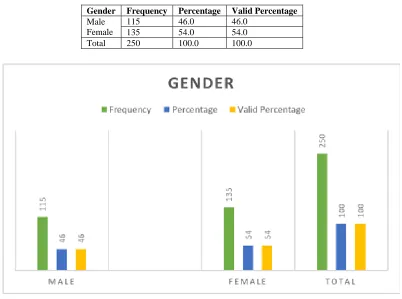
Table 2: Gender of users
Gender Frequency Percentage Valid Percentage
Male Female
115 46.0 46.0
135 54.0 54.0
Total 250 100.0 100.0
Fig.2:
Table 3: Educational stream of the respondents
Educational Stream Frequency Percentage Valid Percentage
Arts& Science 49 19.6 19.6
Engineering 50 20.0 20.0
Medicine 50 20.0 20.0
University 101 40.4 40.4
Total 250 100.0 100.0
Fig.3:
Table 4: Preferred timing of watching programs
Preferred Timing Frequency Percentage Valid Percentage Cumulative Percentage
Morn 7am-9am 23 9.2 9.2 9.2
Even 6.30pm8.30pm 126 50.4 50.4 59.6
Total 250 100.0 100.0
Fig.4:
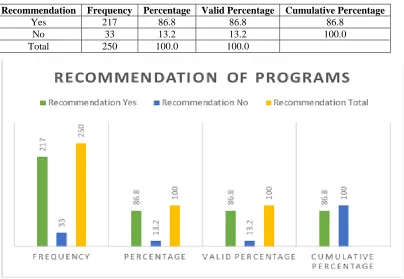
Table 5: Programs recommended by the respondents
Recommendation Frequency Percentage Valid Percentage Cumulative Percentage
Yes 217 86.8 86.8 86.8
No 33 13.2 13.2 100.0
Total 250 100.0 100.0
Findings
The majority of respondents are between (18-21) years with 62.4%. The second majority of respondents belong to age groups 25) years with 33.2%. Respondents between (21-30) years of age groups seem to be very less of just 4.0% and respondents of age groups above 30 are also very less with 0.4% comparatively.
Female respondents were maximum with 135 numbers among the total 250 respondents with 54.0% male respondents seem to be comparatively less with 115 members among 250 respondents with 46.0%.
The educational stream of maximum number of respondents were from University with 40.4%. The next maximum educational stream of respondents’ was from medicine and
from Engineering with 20.0 %. The Educational stream which had least respondents was from Arts and Science with 19.6% comparatively.
Maximum of 50.4% of respondents consider (6.30 - 8.30) PM as the most preferable time for watching TV programs. Following this maximum respondents of 40.4% consider (8.30 - 11.30) PM as preferred timing for watching TV programs. (7 - 9) AM is considered as the least preferred timing for TV programs by 9.2% of the respondents. When investigated whether the respondents will recommend
~ 204 ~ unlikely to recommend their liked programs to their friends and family.
Conclusion
Television is a medium that has become indispensable in the lives of people. The medim was instrumental in various forms especially in fostering the development and growth of the nation. The current rearch study ws envisioned to find out the preference of teeviion progrms and pecifically in knowing the preferred timing of watching TV programs. From the above study, it can be inferred that there is wide popularity among users in watching television shows as there is wide following for television among respondents who are (18-21) years of age. Also, it has been found from the study that users share about the program which they like among friends and family. They would also discuss about it with their close friends. (6 30 to 8.30) PM is the most preferred timing of watching television the study revealed. The respondnets are also found to recommend the program they like to a much wider circle.
References
1. Bushan, C. (1992): Educational Communication by Television. Bharatia Skikshan. Vol.2, No.8. Bombay: S. Cmela Mergh.
2. Madhusudhan, K. (2006): Traditional Media and Development Communication, Kanishka Publishers, New Delhi
3. Trividi, H. (1991). Mass Media and News Horizons Impact of Television and Video on Urban Milleiu, New Delhi: Concept Publishing Company.
4. Retrieved from