Pathak et al. World Journal of Engineering Research and Technology
STOCK MARKET PREDICTION USING ARTIFICIAL
INTELLIGENCE AND SELF-DESIGNED INDICATOR
Shubham Pathak* and Vinesh Singodia
Veermata Jijabai Technological Institute, Mumbai.
Article Received on 22/02/2018 Article Revised on 15/03/2018 Article Accepted on 05/04/2018
ABSTRACT
Stock Prices are very dynamic and volatile because of the underlying
nature of the financial domain and also due to the mix of known parameters like previous days‟ Closing Price and unknown factors like
sentiments. Analyzing the huge stock market through Technical
Indicators helps traders, analysts and investors to understand market sentiment and
accordingly make rational decisions. This paper proposes a prediction method for different
stocks using Artificial intelligence based on Open close Crossover (OCC) Indicator which
tracks price movement of stocks and give a buy/hold/sell recommendation. It has used a
processed data set of Open Price (O) and Close price (C) for the period of one year from
March 2017 to March 2018 whose Exponential Moving Average (EMA) is plotted, and
inferences are deduced based on results obtained for different periods of OCC Indicator. This
paper proposes a technical indicator that outperforms the existing prediction techniques in
terms of returns.
INDEX TERMS: Stock Market, Open Price, Close Price, Open Close Crossover indicator and Artificial Intelligence.
I. INTRODUCTION
Predicting the price movements in stock markets has been a major challenge for traders. The
primary area of concern for any trader is to hit the ideal time to buy and sell. However,
financial time-series is very noisy and volatile and hence very difficult to forecast.[1]
Technical analysis is based on the principle that a market's price reflects all relevant
wjert, 2018, Vol. 4, Issue 3, 109-116.
World Journal of Engineering Research and Technology
WJERT
www.wjert.org
ISSN 2454-695X
Original Article
SJIF Impact Factor: 5.218
*Corresponding Author Shubham Pathak
Pathak et al. World Journal of Engineering Research and Technology
information, therefore, it looks at the history of a security's trading pattern rather than
external drivers such as economic, fundamental and news events. A proper technical analysis
helps in reducing the risk on investment in the share markets and in choosing a less risky and
highly rewarding investment avenue.[3] It uses market indicators of many sorts, some of
which are mathematical transformations of price, often including up and down volume,
advance/decline data but the proposed paper uses a single self designed technical indicator
which is Open Close Crossover Indicator.[9] These indicators are used to help determine
whether an asset is trending, and the probability of its direction and of continuation.
Moreover, as price action also tends to repeat itself because investors collectively tend toward
patterned behavior hence analysts focus on identifiable trends and conditions.
Traditional old methods of prediction were generating returns just equal to or marginally
above the market returns. However, there is a need of having a system which generates
returns higher than market returns. The proposed system looks at devising an artificial system
which uses Open Close Crossover (OCC) Indicator and predicts the call to be taken.
II. RELATED WORK
Price and volume are intuitive and timely to describe the market trading. And the relationship
between price and volume is the most fundamental and important entry point for being aware
and understanding of the stock, stock trading and stock market. Open Close Crossover (OCC)
Indicator has been developed on the principles of Moving Average Crossover Alert
Indicator.[3] With this indicator, one will be able to see clearly when two Moving Average
(MA) indicators cross. It will draw on the chart a green arrow when faster MA crosses the
slower MA from below to above. On the other hand, red arrow will appear when faster MA
crosses the slower MA from above to below. The state-of-the-art stock market prediction
models and techniques have been surveyed in various researches considering the accuracy,
confidence and generalization issues. Early trials to enhance the prediction performance were
based on sentimental information[10] or new stock market data forms (such as candlestick and
point and figures).[11] Others tried to optimize the performance of the MLP ANN, as its
performance drops when the network size increases. Jasemi et al.[18] presented a model for
stock market based on a supervised Feed-Forward ANN and technical analysis of the
Japanese Candlesticks. They used ANN as a regression model to produce key parameters,
Pathak et al. World Journal of Engineering Research and Technology
empirical results of these two approaches exhibited acceptable prediction for triggering “Buy” and “Sell” signals.
III. METHODOLOGY
In this paper, Open Close Crossover (OCC) Indicator, designed by us is used as a basis for
designing the proposed Artificial Intelligence system. The EMA of open and close prices is
coded the period (N) and the point where the two EMAs meet is termed as the Crossover
point. By doing regressive calculations and analysis, it can be seen that there can be three
instances based on the movement of the two EMAs. The AI system primarily has been given
the instances for which a call is to be taken. In one case the EMA of close price will be above
the EMA of open price which is called as positive divergence. When the EMA of open price
will be above the EMA of close price, it is called negative divergence. When there would be
no crossover happening, it is called as zero divergence.
The positive divergence indicates BUY recommendation and the price of buying is taken as
average of open and close price of that day and the negative divergence indicates SELL
recommendation with selling price taken as average of the close and the open price. And if
there is no crossover the recommendation will be to HOLD on the decision and wait for the
right moment to initiate a trade.
Pathak et al. World Journal of Engineering Research and Technology
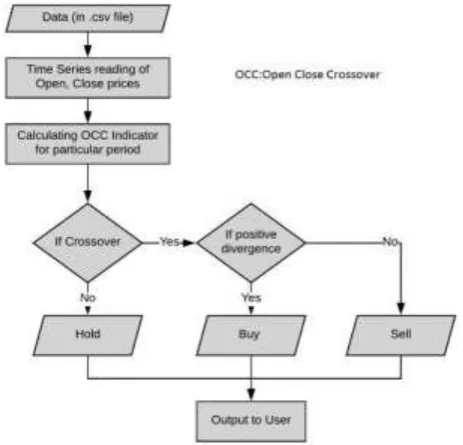
The above is the flow diagram for the proposed system. In first, the system accepts the data
(.csv file) of any stock given by the user. However the user should take care that there is no
bonus or split in the given stock. The system then reads the open and close prices of the
stock. Using these prices the system calculates the OCC indicator. This OCC indicator is then used by the system to detect whether a crossover takes place or not, if the crossover doesn‟t
take place then Hold recommendation is given to the user. If there is a crossover then it is
checked for a positive divergence which if found, then a Buy recommendation is given to the
user else a Sell recommendation is given.
IV. OBSERVATIONS
The algorithm was tested on the data of one year ranging from different indices namely Nifty
50, Midcap and Smallcap for all possible trends of upward movement, sideways movement
as well as downward movement.
The following tables give the observations for the proposed AI system:
Table 1: Observations for large cap stocks.
In Table 1, large cap stocks are considered for which Year-On-Year returns (YoY) is
calculated. The returns obtained for all the stocks is compared with the individual market
returns for those stocks. For example, we consider GAIL in which we see that the returns
Pathak et al. World Journal of Engineering Research and Technology
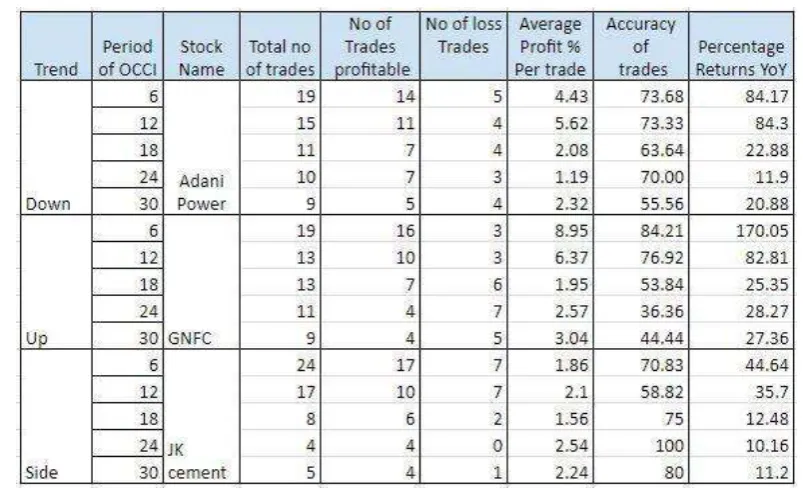
Table 2: Observations for mid cap stocks.
In Table 2, mid cap stocks are considered for which Year-On-Year returns (YoY) is
calculated. Here, we consider a downtrend stock for our analysis i.e Adani Power. The
average returns from the system was 44.8% whereas the market returns were -28.9%. This
clearly shows the that system heavily beats the market. For other stocks as well, the returns
obtained are quite impressive as compared to the returns generated otherwise by other
methods.
Pathak et al. World Journal of Engineering Research and Technology
In Table 3, Small cap stocks are considered for which Year-On-Year returns (YoY) is
calculated. If we consider the sideways trend stock, which here in this case is Eimco Elecon,
it is observed that the average returns for all the considered values of period of OCC indicator
of this stock is 19.82% when it is tested on the proposed system. On the contrary, the returns
of this stock on the market is negative 10.44% thus proving that the results by the proposed
system are way better.
Moreover, one more observation can be deduced that we can see the proposed system to work
for all the three trends observed in the stock market.
V. COMPARISON
There are various other methods that can be used for prediction of the call to be taken
depending upon the period and risk appetite of the investor. Comparing with traditional
methods like fundamental analysis is not viable for short term investing. Moreover, there are
other methods like the Artificial Neural Network Approach which can be used.
The Artificial Neural Network (ANN) which is used for predicting gives the recommendation
for each trading day. Not only does this increases the number of trades for the user but also
the user has to pay other costs involved in trading line the brokerage and the taxes involved in
initiating a trade, thereby increasing the overhead call. In such a scenario the proposed
Artificial Intelligence system has a unmatched advantage because it does not give a Buy/Sell
call on daily basis and thus saving precious resources for the trader. Beside this, the ANN can
face the problem of overfitting and hence failing to anticipate the unexpected move in the
market, but the proposed system incorporates these circumstances and hence it is efficient in
all three trends in the market.
VI. RESULTS
The returns obtained for all the stocks are better than the results by the market. The proposed
AI system takes into consideration the average of the open and close value for buying and
selling therefore the shortcomings of other methods is well taken care of. Secondly, we can conclude that as the value of „N‟ increases the returns over all the stocks for all the trends
decreases and hence it is advisable to have time period of OCCI low in the range of 6-10
only. Moreover, as the time period increases, the number of trades decreases as the number of
Pathak et al. World Journal of Engineering Research and Technology
The above system is giving returns which are beating the returns given by the market,
however there are certain shortcomings of this method. Firstly, if there is a case of stock split
or if a bonus stock is provided, then this tends to change the price of stock drastically and this
has a negative impact on the OCC indicator which influences the recommendation.
Fortunately, this shortcoming can be solved by using only the data which is available after
such cases.
The second shortcoming is that this algorithm works only for a certain range of period (N) of
OCC Indicator. Hence, we see that with an increase in the time period of OCCI, the
performance of the OCC Indicator decreases to a large extent. This indicator will function
effectively only and returns will be acceptable only when the time period (N) is considerably
less (< 40). If the time period is very small (< 3), then the graph will contain more noise
(crossovers) due to which conclusions cannot be made.Therefore the period of the EMA can
be set as per the returns which the user is intending to get.
VII. CONCLUSION
This study investigates the role Artificial Intelligence system using OCC Indicator in predicting the call to be made based on the period „N‟. The investors risk exposure on market
behaviour is reduced with the help of this approach especially for shorter periods of time. The
price of buying is taken as average of open and close price of that day and the OCC Indicator
captures both the opening as well as closing price and predicts correct price movement of
different stocks across varied sectors and gives the investor valuable returns. This system is
strong enough to give recommendations which have higher returns compared to what the
market could otherwise give. However, here the value of n needs to be given by the user. The
improvement that can be done is to have a GUI (Graphical User Interface) which the user
provides the data as well as the current position according to which the system will give
prediction.
ACKNOWLEDGEMENT
The authors gratefully acknowledge the contributions of Dr. Meena S. Panse for her constant
Pathak et al. World Journal of Engineering Research and Technology
REFERENCES
1. Magda B. Fayek, Hatem M. El-Boghdadi, Sherin M. Omran, “Multi-objective Optimization of Technical Stock Market Indicators using GAs”, International Journal of
Computer Applications (0975 – 8887); April 2013; 68(20).
2. Hemal Pandya,“Technical Analysis for Selected Companies of Indian IT Sector”,
International Journal of Advanced Research, 2013; 1(4): 430-446.
3. Puchong Praekhaow, “Determination of Trading Points using the Moving Average Methods”, GMSTEC 2010: International Conference for a Sustainable Greater Mekong
Subregion, Bangkok, Thailand, August 2010; 26-27.
4. Charles D Kilpatrick II, Julie R Dahlquist, “Technical Analysis: The Complete Resource
for Financial Market Technicians 2010,” Pearson.
5. Rajat Singla, “Prediction from Technical Analysis- A Study of Indian Stock Market”,
International Journal of Engineering Technology, Management and Applied Sciences,
April 2015; 3(4): ISSN 2349-4476.
6. J Sharmila Vaiz, Dr M Ramaswami ,“A Study on Technical Indicators in Stock Price Movement Prediction Using Decision Tree Algorithms”, American Journal of
Engineering Research (AJER) e-ISSN: 2320-0847 p-ISSN: 2320-0936; 5(12): 207-212.
7. John J. Murphy, “Technical Analysis of the Financial Markets (A comprehensive guide to the trading methods and applications)”, New YorkInstitute of Finance 1999.
8. Antoniou А, Ergul N, Holmes P, Priestley R, “Technical analysis, trading volume and market efficiency: evidence from an emerging market”, Applied Financial Economics,
1997; 4: 361 – 365.
9. Namita Pradhan, Asmita Dalai, Vinesh Singodia, Shubham Pathak, Himanshu Kohli, “Open Close Crossover Indicator for Stock Market Prediction”, International Conference
on Electrical, Electronics & ComputerSciences (ICEECS), ASAR Conference, 2018.
10.Fung, P.C., Yu, X., Lam, “Stock Prediction Integrating Text Mining”, IEEE International
Conference on Computational Intelligence for Financial Engineering, 2003; 395–402.
11.Hwang, H., Oh, J, “Fuzzy Models for Predicting Time Series Stock Price Index”,
International Journal of Control, Automation and Systems, 2010; 8(3): 702–706.
12.Jasemi, M., Kimiagari, A.M., Memariani, A. “A Modern Neural Network Model to Do