Chandraselvi et al. World Journal of Pharmaceutical and Medical Research
DOES FRUCTOSE INTAKE INFLUENCE HEART RATE VARIABILITY?
1*Dr. Chandraselvi E., 2Dr. Saikumar P. and 3Dr. Vasugi S.
1,2Department of Physiology, Sree Balaji Medical College and Hospitals. 3Department of Physiology, Priyadharshini Dental College.
Article Received on 05/01/2019 Article Revised on 26/01/2019 Article Accepted on 16/02/2019
INTRODUCTION
Fructose is a monosaccharide, also known as fruit sugar which is a key component of table sugar (sucrose) and High Fructose Corn Syrup(HFCS).Consumption of each gram of table sugar comprises 50% of glucose and 50% of fructose. Though equal contribution is given by both glucose and fructose in each gram of sugar, the role of
fructose has been understudied. Normal plasma fructose concentration is 1mg/dl. According to the history of fructose consumption in paleolithic period carbohydrate consumption was only 10%, from 18th century towards 20th century the carbohydrate consumption increases when compared to fat and protein which is shown in figure (1).
Fig. 1: History of fructose consumption.
The consumption of fructose is primarily from High Fructose Corn Syrup (HFCS), HFCS is now used
extensively in carbonated beverages and other sweetened drinks, baked goods, candies, canned fruits, jams, jellies,
ISSN 2455-3301
WJPMR
AND MEDICAL RESEARCH
www.wjpmr.com
*Corresponding Author: Dr. Chandraselvi E.
Department of Physiology, Sree Balaji Medical College and Hospitals.
ABSTRACT
Background: WHO recently estimated that among those aged 25 years in 2013, there are about 199 million hypertensives. Adverse effects of fructose intake have been proved in both human and animals. Questions have been raised as to whether high consumption of fructose are directly related to development of hypertension. Aim and objectives: To estimate the influence of high fructose intake on heart rate variability. Materials and methods: Forty seven male nonsmoking subjects aged between 18-25 years were recruited in this study. Their fructose consumption was analysed by using the data collected from the National Health and Nutrition Examination Survey (NHANES).Heart rate vaviability was analysed by using RMS Polyrite. Results: Fructose intake was positively correlated with soft drinks consumption each day.We also observed changes in HRV. Their fructose level was significantly correlated with HRV. Conclusion: The results of this study suggest that high fructose consumption, in the form of soft drinks and added sugars will alter the HRV. So we concluded that consumption of high fructose may alter the cardiac performance.
and dairy products. High fructose intake, in the form of added sugar, independently associates with higher BP levels among US adults without a history of hypertension.[1] Dietary carbohydrate components influence the prevalence and severity of common degenerative diseases such as dental problems, diabetes, heart disease, obesity and hyperglycemia.
MATERIALS AND METHODS
Study Population: 47 male student volunteers (19-25 years) were recruited from Sree Balaji Medical college and hospitals. We excluded, obese, smokers, alcoholics, history of parental hypertension and diabetes. We included the subjects those who fulfilled the study criteria. Study design was explained to the subjects and informed consent was obtained. This study was approved by institutional ethical committee.
Parameters measured: Anthropometric parameters:
Height, Weight
Heart rate variability: RMS Polyrite
Fructose: fructose was analyzed by NHANES (National Health and Nutrition Examination Survey) food
questionnaire (2003&2006). Food frequency questionnaire assessments are a valid and reproducible method for assessing average dietary consumption.
Statistical analysis: Values are expressed in mean ± std. Pearson correlation was done to correlate HRV & Fructose concentration. ANOVA was used to analyze the consumption of fructose. p=0.001& p=0.05 was taken as significant value.
RESULTS Table I:
Parameters Mean ± Std
Age (yrs) 20 ± 2
Height(cm) 172.74 ± 7.11
Weight(kg) 53.72 ± 13.52
LF 71.64 ± 10.04
HF 28.37 ± 10.07
LF/HF 3.24 ± 2.40
Heart rate(bpm) 83.61 ± 10.27
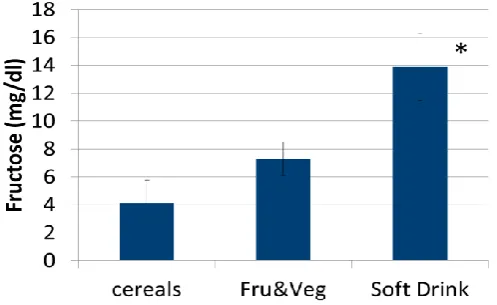
Fructose(gm/day) 83 ± 33
Fig. II: Percentage (%) of study population with fructose consumption.
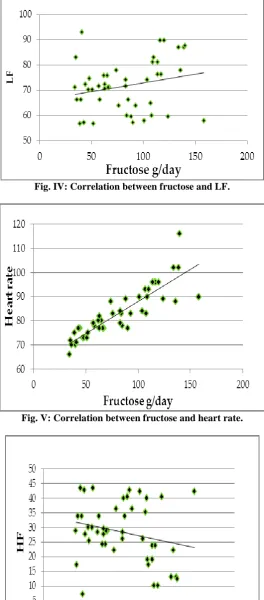
Fig. IV: Correlation between fructose and LF.
Fig. V: Correlation between fructose and heart rate.
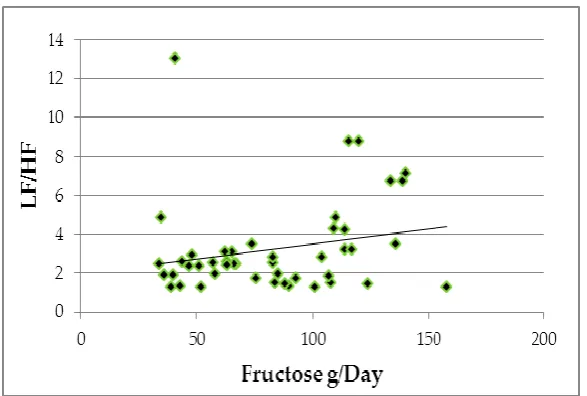
Fig. VII: Correlation between fructose and LF/HF.
DISCUSSION
The consumption percentage (%) of study population of fructose was found to be increased in our result. This could be due to the shift of jaggery sweeteners though the early 1970’s was mainly from glucose based sweeteners, but since 1974, the increase in corn sweeteners represented a shift from glucose based sweeteners to high fructose corn syrup. Increase in % of soft drinks consumption may be due to trends in availability of added sweeteners, Increase in diversity of food items with increase in food expenditures, Increased expenditure on food to please tastes. Fructose concentration was found to be increased in our results this could be due to several mechanisms such as impaired fructose metabolism in the liver, disrupted transport system for fructose, polyol pathway. Increased heart rate in our study population could be due to the effect of excessive consumption of fructose.[3]
Dhingra et al,[3] explored the relationship between soft drink consumption and metabolic syndrome. He concluded that, individuals who consumed soft drink had risk for incidence of metabolic trait (obesity, increased waist circumference, increased fasting glucose, high triglycerides, and lower HDL cholesterol), except for hypertension. Nguyen et al,[4] showed an association among sugar-sweetened beverages, serum uric acid levels, and SBP in adolescents who were between the ages of 12 and 18 years. Studies in animals suggested that fructose may raise BP via several mechanisms, including stimulation of uric acid, inhibition of endothelial nitric oxide synthase system and stimulation of the sympathetic nervous system or by directly increasing sodium absorption in the gut,[5] Fructose is proposed to raise BP via increasing uric acid production, which exerts hemodynamic effects, such as increased oxidative stress, endothelial dysfunction, and activation of the renin-angiotensin-aldosterone system.[6] This study coincides with previous works showing that this fructose consumption leads to the increased sympathetic activities.
In Adipose tissue intake of fructose providing 25% of energy requirements which increases lipogenesis and dyslipidemia,[7] and reduced net fat oxidation as well as resting energy expenditure,[8] thereby promoting visceral adiposity. Reducing sugars, such as fructose and glucose, react with proteins and amino acids to form substituted amino sugars. This reaction, known as the Maillard reaction (also called glycosylation or glycation), usually occurs at the site of a lysine side-chain, but reducing sugars can also react with tryptophan, arginine, and possibly other amino acids. The initial products of the Maillard reaction undergo further reactions and rearrangements to form AGEs, which accumulate indefinitely on long-lived molecules such as collagen and DNA. There is evidence that AGEs play a role in the aging process, in the pathogenesis of the vascular, renal, and ocular complications of diabetes,[9] and in the development of atherosclerosis.[10]
CONCLUSION
We concluded that, high intake of fructose in the form of table sugar or high-fructose corn syrup, may independently associated with a greater risk for increased sympathetic activity which may lead to hypertention through a variety of mechanisms. The results of this study proved that high fructose consumption in the form of soft drinks alter the HRV. The awareness of fructose consumption towards adolescents (18-25yrs) population need to be implemented.
REFERENCES
1. Diana I. Jalal, Gerard Smits, Richard J. Johnson, and Michel Chonchol. Increased Fructose Associates with Elevated Blood Pressure J Am Soc Nephrol, 2010; 21: 1-7
3. Dhingra R, Sullivan L, Jacques PF, Wang TJ, Fox CS, Meigs JB, D’Agostino RB, Gaziano JM, Vasan RS: Soft drink consumption and Risk of developing cardiometabolic risk factors and the metabolic Syndrome in middle-aged adults in the community. Circulation, 2007; 116: 480–488.
4. Nguyen S, Choi HK, Lustig RH, Hsu CY: Sugar-sweetened beverages, Serum uric acid, and blood pressure in adolescents. J Pediatr, 2009; 154: 807– 813.
5. Singh AK, Amlal H, Haas PJ, Dringenberg U, Fussell S, Barone SL, Engelhardt R, Zuo J, Seidler U, Soleimani M: Fructose-induced hypertension: Essential role of chloride and fructose absorbing transporters PAT1 and Glut5. Kidney Int., 2008; 74: 438–447.
6. Johnson RJ, Perez-Pozo SE, Sautin YY, Manitius J, Sanchez-Lozada LG, Feig DI, Shafiu M, Segal M, Glassock RJ, Shimada M, Roncal C, Nakagawa T. Hypothesis: could excessive fructose intake and uric acid Cause type 2 diabetes? Endocr Rev., 2009; 30: 96–116.
7. Stanhope KL, Schwarz JM, Keim NL, Griffen SC, Bremer AA, Graham JL, Hatcher B, Dyachenko A, Zhang W, mcgahan JP, Seibert A, Krauss RM, Chiu S, Schaefer EJ, Ai Consuming fructose-sweetened, not glucose-sweetened, beverages increases visceral adiposity and lipids and decreases insulin sensitivity in overweight/obese humans.J Clin Invest, 2009; 119: 1322-1334.
8. Cox CL, Stanhope KL, Schwarz JM, Graham JL, Hatcher B, Griffen SC, Bremer AA, mcgahan JP, Keim NL & Havel PJ. Circulating concentrations of monocyte chemo attractant protein-1, plasminogen activator inhibitor-1, and soluble leukocyte adhesion molecule-1 in overweight/obese men and women consuming fructose or glucose sweetened beverages for 10 weeks. J Clin Endocrinol Metab, 2012; 96: 2034-2038.
9. Devamanoharan PS, Ali AH, Varma SD. Prevention of lens protein glycation by taurine. Mol Cell Biochem, 1997; 177: 245-250.