INTRODUCTION
Underground extraction of hard coal causes transformations of the environmentally managed areas. Soils are one of the biotope elements that are the most susceptible to degradation [Klatka et al. 2015]. In effect of the extraction activities of mines, the geomechanical land subsidence oc-curs, leading to the raise of groundwater table and hydrological soil degradation [Kaszowska 2007]. A high level of soil moisture content worsens the conditions of plant vegetation and intensifies the expansion of hydrophylic vegetation. In arable lands, a slightly raised groundwater table may cause an increase in agricultural production, but also soil degradation, lowering of the soil quality classes and soil productivity. A necessary change of land use from arable lands to meadow and pas-ture use is also frequently observed [Strzyszcz 1995, Rosik-Dulewska et at.1999]. The extent of damage arising on arable lands and woodlands is clearly spatially diversified, which apart from theanthropgenic pressure, is also affected by the
soil properties themselves. As a result of these degradation phenomena, the properties of soils in the areas of extractive industry operations usu-ally reveal a considerable spatial variability. As-sessment of these properties should be conducted taking into consideration the recognized character of their variability. Among the methods provid-ing a better estimation of variability character is geostatic kriging technique [Webster and Oliver 1990]. The application of mathematical-statistical procedures, as well as determining and analy-sis of the functions of empirical and theoretical semivariances allow to estimate the value of vari-able at each point of the investigated area and to plot isoline maps of spatial variability [Marx and Thompson 1987]. On the basis of these maps it is possible, among others, to determine the ar-eas prone to various forms of surface degrada-tion and demarcate the boundaries of the most threatened areas [Klatka and Boroń 2008]. The method may be also important for the optimiza-tion of lands use and increasing their productivity [Sigua and Hudnall 2008].
Accepted: 2019.01.13 Available online: 2019.01.20
Volume 20, Issue 3, March 2019, pages 185–193 https://doi.org/10.12911/22998993/99781
Analysis of Spatial Variability of Selected Soil Properties in the Hard
Coal Post-Mining Area
Sławomir Tomasz Klatka
1*, Magdalena Malec
1, Marek Ryczek
11 Department of Land Reclamation and Environmental Development, University of Agriculture in Krakow, al. Mickiewicza 24/28, 30-059 Kraków, Poland
* Corresponding author’s e-mail: [email protected]
ABSTRACT
The result of geomechanical and hydrological degradation caused by the underground extraction of hard coal are the transformations of the environmentally managed terrains and high variability of soil properties occurring in these areas. The analysis of selected soil properties of spatial variability in the post-mining area conducted by means of the kriging technique was presented in the paper. The determined points of empirical semivariogram were described by means of mathematical functions and theoretical semivariograms were plotted. The conducted analysis allowed to plot the maps of variability isolines, which my provide a basis to delineate the boundaries of areas most susceptible to the hydrological degradation of soils. The obtained research results indicate that the applied kriging technique may prove to be a useful tool for determining spatial variability of soils in the areas of hard coal mining operations and allow to delineate the boundaries of the areas most susceptible to soil degradation.
The aim of the paper was an analysis of the spatial variability of selected soil properties in the 0–25 cm layer in the area subject to degradation due to the underground mining operations.
MATERIALS AND METHODS
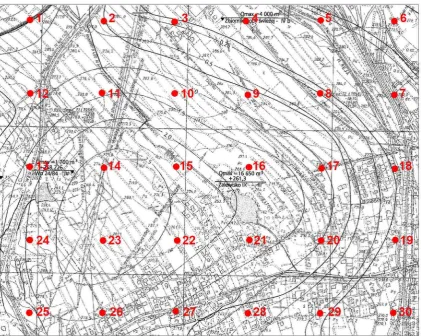
The research was conducted in the north-eastern part of hard coal mining area, “Ruch-Borynia” coal mine in Jastrzębie-Zdrój within Świerklańska, Zamkowa and Plebiscytowa streets. The geomechanical and hydrological degradation of soils, which occurs in this area is caused by land subsidence between 1 and 2.5 m, in relation to the original position. The investi-gations were conducted on the basis of a regular measurement grid with 100m side, determined with GPS method. The soil material for labora -tory tests was collected at the stabilized measure-ment points from the depth of 0–25 cm. A total of 30 soil samples were collected in three repli-cations. The location of measurement points was shown in Figure 1. The laboratory tests comprised determining the following soil properties: the
particle size distribution, bulk density, the specific gravity, total porosity, organic matter content and soil saturated conductivity coefficient. The parti -cle size distribution was determined by means of aerometric Casagrande’s method in Prószyński’s modification. Groups and sub-groups of particle size distribution were determined on the basis of PN-R-04033 standard. The physical soil proper -ties (bulk density and total porosity) were deter-mined with Kopecky’s method (100 cm-3 cylin-ders) [Mocek et al. 1997], specific gravity was es -tablished by pictometry in distilled water, whereas the soil saturated conductivity coefficients were determined in the laboratory using pressure drop method in the apparatus based on Darcy’s law with regulated water pressure and electronic read-ing of water volume. Determination of saturated conductivity coefficient on this apparatus is based on a linear dependence of the flow on hydraulic gradient at so-called laminar motion, in compli-ance with Darcy’s law [Baver et al. 1972]. The organic matter content was determined by means of Tiurin’s method in Oleksynowa’s modification [Oleksynowa et al. 1987], which relies on humus oxidation with potassium dichromate (Cr6+).
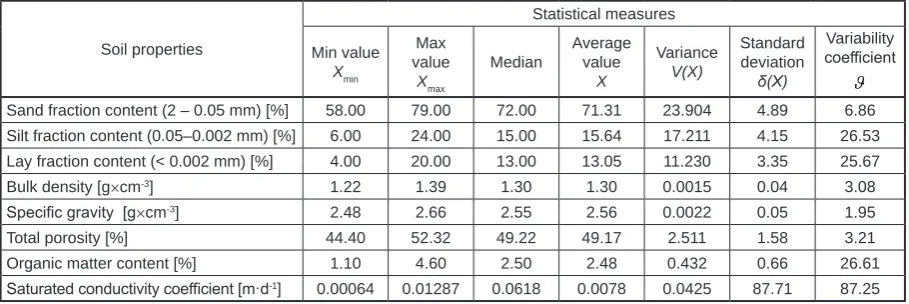
The following statistical measures were com-puted in order to characterize the analyzed litho-logical parameters and to initially determine the degree of their variability [Hellwig 1993]: maxi-mum and minimaxi-mum values, median, average val-ue, standard deviation and variability coefficient. Variability coefficient was determined as a vari -ance dispersion measure and standard deviation in the form of a variability quotient of a given feature – standard deviation and average value of a given feature expressed in percent. The results were presented in Table 1. The spatial variability of the studied soil properties was determined with kriging method. The method allows for the assess-ment of the confidence intervals of statistical esti -mation, determining the average value in any part of the analyzed area and finding localization for the measurement points, which to the highest ex-tent would narrow the confidence intervals of dis -tributions. Precisely speaking, kriging should be defined as the method optimizing the estimation of spatially correlated value Z, both in the case of its stationarity and in non-stationary cases. If we assume that Z1 = Z (x1) is the value measured at point x1 (i = 1,2 ……n), then the problem of point estimation involves determining value Zo at point xo, where value Z was not measured. Through constant change of point xo location, it is pos-sible to determine the entire field of variation of the Z variable [Webster and Oliver 1990]. Beside the possibility to estimate the value of Z at each point, kriging technique also allows to: assess the confidence intervals for estimation, determine the mean magnitude of the value Z at any part of the researched area, as well as find the locations for new measurement points, which to the high-est extent will narrow the confidence intervals for the calculated distributions [Somorowski 1993]. The analysis with the use of kriging method was
conducted in two stages. At the first stage, the γ function was determined, in geostatistics referred to as a variogram or semivariogram [Smith et al. 1994], which may defined as:
𝛾𝛾(ℎ) =12 𝐸𝐸{[𝑍𝑍(𝑥𝑥 + ℎ) − 𝑍𝑍(𝑥𝑥)]}2
From the semivariogram definition it follows that γ(0) = 0 and γ(h) ≥ 0 for h > 0.
In the case when the assumptions of station-arity are met, the semivariogram contains all the information about spatial variability of the Z value. The assumption of internal stationarity al-lowed to calculate the value of empirical semi-variograms on the basis of a single realization of the process (one measurement series) [Oliver and Webster 1986] as:
𝛾𝛾(ℎ) =2𝑚𝑚(ℎ) ⋅ ∑1 [𝑍𝑍(𝑥𝑥𝑖𝑖) − 𝑍𝑍(𝑥𝑥𝑖𝑖+ ℎ)]2 𝑚𝑚(ℎ)
𝑖𝑖=1
where: γ (h) – semivariogram value for a separa-tion distance of h,
m (h) – number of observations made at a
separation distance of h,
Z (xi) – value observed at point xi,
Z (xi+h) – value observed at point locat-ed at a separation distance of h
All calculations were made using a special-ist computer software: Spatanal [Stein, Staritsky 1993], Statistica for Windows [StatSoft, Inc. 1984–2011], Surfer for Windows [Golden Soft -ware, Inc. 1993–2002]. The determined points of empirical semivariograms were described by means of mathematical functions and theoretical semivariograms were plotted. Their description needs positive-definite functions, assuming value of zero at point zero. Marx and Thompson [1987]
Table 1. Statistical measures of the soil materials determined in the 0–25 cm layer
Soil properties Statistical measures Min value Xmin Max value Xmax Median Average value X Variance V(X) Standard deviation δ(X) Variability coefficient ϑ
Sand fraction content (2 – 0.05 mm) [%] 58.00 79.00 72.00 71.31 23.904 4.89 6.86
Silt fraction content (0.05–0.002 mm) [%] 6.00 24.00 15.00 15.64 17.211 4.15 26.53
Lay fraction content (< 0.002 mm) [%] 4.00 20.00 13.00 13.05 11.230 3.35 25.67
Bulk density [g×cm-3] 1.22 1.39 1.30 1.30 0.0015 0.04 3.08 Specific gravity [g×cm-3] 2.48 2.66 2.55 2.56 0.0022 0.05 1.95
Total porosity [%] 44.40 52.32 49.22 49.17 2.511 1.58 3.21
suggest the following models: spherical, expo-nential, Gaussian, linear and logarithmic; how-ever, the most commonly used functions belong to the class of so called safe models, i.e. linear and spherical functions. The obtained shape of a semivariogram indicates the kind of spatial cor-relation of the analyzed variable. There are two basic kinds of semivariograms. The first is char -acterized by the fact that the value of variance is increasing with growing separation distance of h to some maximum value at which it remains constant with increasing distance. After the initial growth, value γ (h) reaches, for certain separation distance α the value equal to a variable variance. The separating distance α is called the variogram range and determines the limit of spatial corre-lation. The Z variable which has the variogram of this kind is not only internally stationary, but itself has the second-order stationarity. In the sec-ond type of semivariograms, the variance γ (h) is the function increasing without limits. In this case, the variance is infinite and with growing separation distance h, reaches a certain thresh-old value determined as C. The threshthresh-old value is reached precisely or only asymptotically. If the semivariogram does not pass through the middle of the coordinate system origin, we speak about so called nugget effect, determined as co. The effect may evidence the fact that if a nugget is collected for sampling, the other samples, even very close ones will differ with their concentra -tions of a given component [Smith et al. 1994]. For graphic representation of the spatial variabil-ity, each of the measuring points was ascribed the position vectors.
RESULTS
According to the Polish Soil Classifica -tion [PTG 2011] the investigated soils belong to brown soil order, Eutric Cambisols type, and Eutric Gleyic Cambisols sub-type [Klatka et al. 2015]. These are soils revealing the properties of Cambisols, but differing with a higher water con -tent in the profile. The analysis of the obtained results of laboratory tests indicates the occurrence of various sand sub-groups and only in some plac-es lime patchplac-es. Therefore, thplac-ese are light soils, with less than 20% content of floatable particles, high hydraulic conductivity and low water reten-tion. The soils with this mechanical composition are regarded as slightly resistant to degradation
processes due to hard coal mining operations [Klatka and Boroń 2008]. The specific gravity ranged between 2.4 and 2.66 g·cm-3 and was
ap-proximate to the values most frequently regis-tered in the soils of Poland [Zawadzki 1999]. The values of bulk density were on average 1.30 g·cm -3 and were also approximate to the average values for soils, which according to Zawadzki [1999] range between 0.75 and 1.90 g·cm-3. The total po-rosity value fluctuated from 44.4 to 52.32%, on average 49.22%. Because total porosity affects, among others, the aerial properties and hydrau-lic conductivity in soils, it should be stated that at a majority of the investigated points it reached the values favourable for soils and may have in-fluenced the dimension of degradation processes. According to Musierowicz [Zawadzki 1999], in cambisols (brown soils), the humus content in the 0–25 cm layer is between 1.5 and 2.5%. In many cases, the content of organic matter noted in the investigated area exceed these values for brown soils; therefore. in the future reclamation activities one should take into consideration a possible removal of the humus horizon. The soil saturated conductivity coefficients determined with a laboratory method fluctuated from 0.00064 to 0.01287 m·d-1. The highest values were
regis-tered for loose sands. The value of saturated con-ductivity coefficient plays very important role in hydrological degradation of soils in the areas of mining damage [Klatka et al. 2015, Klatka et al. 2016]. The obtained results on an average level of 0.0618 m·d-1 together with a light particle size
distribution indicate the studied susceptibility of soils to hydrological degradation.
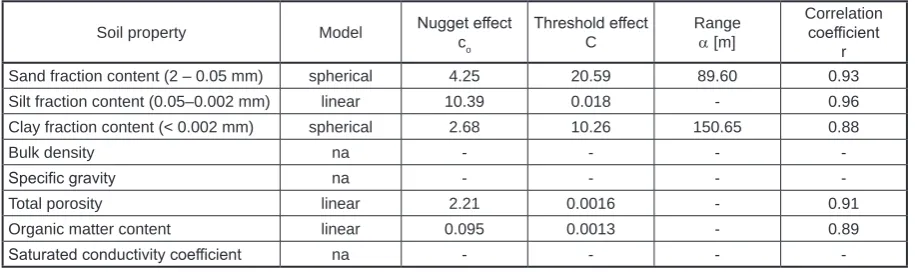
Most of the plotted empirical semivariograms were smoothed using linear and spherical func-tions (Fig. 2). The excepfunc-tions were the values of theoretical semivariances obtained for the saturat-ed conductivity coefficient, bulk density and spe -cific gravity, which proved impossible to smooth using the above-mentioned models. Generally, for these properties the values of semivariance formed a parallel line to the distance axis. The fact limits the existence of spatial correlation, the limit of which may be lower than the separation distance between the measuring points. The em-pirical sevariogram plotted for silt fraction con-tent and total porosity was smoothed by means of a linear model. In this case, the semivariance grows along with the separation distance and it is impossible to determine the spatial correlation limit as the value for which the semivariance sta-bilizes itself. On the other hand, the nugget effect was determined. The empirical semivariograms plotted for the contents of sand and clay fraction were smoothed by the spherical model. In these cases, the nugget effect was observed, evidencing a variability of a given value at the separation dis-tance lower than the disdis-tance between the mea-suring points. The occurrence of this effect may result from the precision of applied measurement method. The limit of spatial correlation, 89.60m and 150.65m, respectively, was also determined for the semivariograms of the discussed soil prop-erty. The parameters of models fitted to theoreti -cal variograms were compiled in Table 2.
Using the computed empirical semivariance models, the spatial variability maps were plotted for the studied parameters. Isoline cutting was matched to the random error magnitude – nugget variance. A high value of the variance affected a better smoothing of the spatial distribution.
Many authors investigated the problem of spatial variability of mineral soil properties using
geostatic kriging method. L’Opez-Granados et al. [2002] investigated spatial variability of se-lected chemical properties of soils in two regions of southern Spain in view of selecting a proper kind and doses of fertilizer. Park and Vlek [2002], who studied the spatial variability of soil proper-ties in 64 soil profiles on a slope in Bicknoller Combe, Somerset, UK revealed that recognizing the soil spatial variability gains in importance in ecological modeling. In their investigations, they also characterized the complexity of three-dimen-sional variances of individual soil properties and researched the possibility of predicting the soil properties distribution using three different re -gression methods. Wei et al. [2006] used kriging method for the assessment of spatial variability of organic matter content in the soils of northern and eastern parts of China. Stach [1998] determined the spatial variability of the soil arable layer on lithologically heterogenous morain slope. In the areas of reclaimed settling ponds holding soda waste from KZS “Solvay” in Krakow, the prob -lem of variability of the selected sol properties in the insulation layer was investigated by Klatka et al. [2017]. The results of the research conducted by the authors mentioned above indicate that the analysis of spatial variability of the studied soil properties is a useful tool allowing to determine the average value of any property in any part of the studied area and to find the location for new measuring points. In their research conducted in the area of the post-mining area at Szczygłowice, Klatka and Boroń [2008] demonstrated that the kriging method and plotted variability iso-lines may provide a basis for demarcating the boundaries of areas the most susceptible to soil hydrological degradation.
Presently, the agricultural lands in the in -vestigated area, which are the private property of farmers, are characterized by a low level of
Table 2. Parameters of the models fitted to empirical semivariances
Soil property Model Nugget effect co
Threshold effect C
Range a [m]
Correlation coefficient
r Sand fraction content (2 – 0.05 mm) spherical 4.25 20.59 89.60 0.93
Silt fraction content (0.05–0.002 mm) linear 10.39 0.018 - 0.96
Clay fraction content (< 0.002 mm) spherical 2.68 10.26 150.65 0.88
Bulk density na - - -
-Specific gravity na - - -
-Total porosity linear 2.21 0.0016 - 0.91
Organic matter content linear 0.095 0.0013 - 0.89
-Fig. 2. Theoretical and empirical semiovariograms:a) sand fraction content, b) silt fraction content, c) clay
frac-tion content, d) bulk density, e) specific gravity, f) total porosity, g) organic matter content, h) saturated conduc
Fig. 3. Maps of spatial variability of the investigated soil properties: a) sand fraction content, b) silt fraction
applied agrotechnological measures, which un-doubtedly affects both their quality and agricul -tural suitability. In future, one should reckon with an increasing wasteland area accompanied by intensifying processes of soil hydrologi-cal degradation. According to Siuta [2007], the most efficient way to counteract ground surface waterlogging and increase rainwater retention in soils, as well as optimizing utilisation of ground-water in soil, is conservation of the existing ir-rigation networks or construction of a newone. The lack of this type of reclamation actions in a given area may also prove disastrous for some building areas. The threat involves flooding the house foundations and cellars.
CONCLUSIONS
1. The investigated area undergoes intensive ef-fects of the underground hard coal extraction. The geomechanical transformations of the surface caused by the exploitation conducted using so called “roof fall” method led to soil degradation and raised the groundwater table, as well as caused waterlogging of grounds and soils. Apart from the mining activities, the di-mension and intensity of this type of degrada-tion were also influenced by the soil properties. Spatial variability of the studied soil properties reveals exceptionally high dynamics, which will intensify in time along with intensification of degradation processes.
2. The conducted geostatical analysis of the ex-amined soil deposits did not determine any theoretical semivariogram model for the sat-urated conductivity coefficient, bulk density, specific gravity or spatial correlation limit. It is connected with a considerable random variability of these properties. For silt frac-tion content and total porosity semivariance was increasing linearly along with the sepa-ration distance, and like for the former soil properties, it was impossible to determine their spatial correlation limit. For the content of sand fraction and clay fraction, the limits of spatial correlation were determined. The occurrence of the nugget effect was also ob -served, which may evidence a variability of a given parameter along a separation distance smaller than the distance between the mea-surement points.
3. Computations of the statistics for the discussed area should also comprise the character of spa-tial variability of the investigated soil proper-ties. The variability isolines plotted by means of kriging indicate a relationship of the inves-tigated properties with the parent rock lithol-ogy. The conducted research and geostatic computations allow for the statement that the kriging method may prove to be be a tool most useful for determining spatial variability of soils in the areas of hard coal mining activities. However, the reliability of this method is con-ditioned to a great extent by the form of empiri-cal semivariogram and theoretiempiri-cal variogram fitted on this basis.
REFERENCES
1. Baver L., Gardner W., Gardner R.W. 1972. Soil
Physics. 4 Ed-New York 1972. Wiley 8 Nlb 2,498.
2. Brandyk T., Gnatowski T., Szatyłowicz J. 1996. Spatial variability of some physical properties of
decomposed lowland peat soil. Proceedings of 10th International Peat Congress, 27 May-2 June, Bremen (ed. G.W. Luttig), vol. 2, 294–305.
3. Hellwig Z. 1993. Elements of probability calculus
and mathematical statistics [in Polish]. Wydawnic
-two Naukowe PWN. Warszawa, pp. 313.
4. Golden Software, Inc. 1993–2002. Surfer for
Win-dows. Version 8.02. User’s Guide. 809 14th Street, Golden, Colorado 80401–1866.USA
5. Kaszowska O. 2007. Wpływ podziemnej eksp
-loatacji górniczej na powierzchnię terenu. (Impact
of underground mining on surface of terrain) [in
Polish]. Problemy Ekologii, vol. 11, nr 1, 52–57.
6. Klatka S., Boroń K. 2008. Modelling spatial vari -ability of soil texture in areas subject to mining
degradation [in Polish]. Acta Scientiarum Polono
-rum, Formatio Circumiectus 7(4), 13–20.
7. Klatka S., Malec M., Ryczek M., Boroń K., 2015.
Wpływ działalności eksploatacyjnej kopalni węgla kamiennego „Ruch Borynia” na gospodarkę wodną wybranych gleb obszaru górniczego. (Influence of
mine activity of the Coal Mine “Ruch Borynia” on water management of chosen soils on mining area)
[in Polish]. Acta ScientiarumPolonorum, Formatio Circumiectus, vol. 14, nr 1, 115–123.
8. Klatka S., Malec M., Ryczek M., Kruk E., Zając
E. 2016. Ocena zdolności retencyjnych wybranych
odpadów przemysłowych. (Evaluation of reten
-tion ability of chosen industrial wastes) [in Pol
9. Klatka S., Zając E, Zarzycki J. 2017. Areal variabil -ity of the mineral soil cover in a reclaimed soda waste dumping site. Annals of Warsaw University of Life Sciences-SGGW Land Reclamation, Warsaw
Uni-versity of Life Sciences Press, vol. 49, nr 1, 15–27
10. Kruk., E., Ryczek M., Klatka S., Malec M. 2018.
Spatial Variabilty of Chosen Soil Properties on Mountainous Area on Example of Kasińczanka
Stream Basin, Western Carpathians. J. Ecol. Eng.
2018; 19(3), 146–153
11. L´opez-Granados F., Jurado-Exp´osito M.,
Aten-ciano S., Garc´ıa-Ferrer A., S´anchez de la Orden M., Garc´ıa-Torres L., 2002. Spatial variability
of agricultural soil parameters in southern Spain.
Plant and Soil 246, 97–105
12. Mocek, A, Drzymała, S., Maszner, P. 1997. Gen
-esis analysis and classification of soils) [in Polish]. Poznań. Wydawnictwo AR.
13. Marx D. B, Thompson K. C. 1987. Practical aspect of agricultural Kriging. Arkansas Agricultural Ex-periment Station Bulletin, 903.1
14. Oleksynowa K., Tokaj J., Jakubiec J. 1987. Guide
to exercises in soil science and geology [in Polish].
AR w Krakowie
15. Oliver M., Webster R. 1986. Semi-variograms for modelling the spatial pattern of landform and soil properties. Earth Surface processes and Land-forms. 11, 75–92.
16. Park S.J., Vlek P.L.G. 2002. Environmental corre -lation of three-dimensional soil spatial variability: a comparison of three adaptive techniques.
Geo-derma. Volume 109, Issues 1–2, 117–140
17. Polskie Towarzystwo Gleboznawcze [PTG], 2011.
Polish Soil Classification, Fifth Edition [in Polish]
Rocz. Glebozn., LXII (3), 193.
18. PN-R-04033 1998. Gleby i utwory mineralne.
(Soil and mineral soil materials) [in Polish] Polski Komitet Normalizacyjny Warszawa
19. Rosik-Dulewska Cz., Wrona A., Gronet R., 1999.
Przekształcenia użytkowania gruntów na obszarach górniczych KWK „Knurów’’ i KWK „Szczygłowice”. (Changes in land use on mining areas of Knurów and Szczygłowice coal mines) [in Polish] Archiwum
Ochrony Środowiska. Vol. 25. no 4, 89–117
20. Sigua G. C., Hudnall W. H. 2008. Kriging analysis of soil properties – Implication to landscape man-agement and productivity improvement. Journal of Soils and Sediments, 8, 193–202.
21. Siuta, J. 2007. Ecological magnitude of the regula-tion of relaregula-tion between water and air in soil [in
Polish] Inżynieria Ekologiczna. 18, 19–22.
22. Smith J.L., Halvorson J.J., Papendic R.I., 1994. Multiple variable indicator kriging: procedure for integrating soil quality indicators. SoilSci. Soc.
Am. spec. publ. No. 35, 62–94
23. Somorowski Cz. 1993. Contemporary problems
of land reclamation [in Polish]. Wydawnictwo
SGGW, Warszawa.
24. Stach A. 1998. Spatial variability of properties of the ploughed layer on a lithologically
non-homo-geneous morainic slope [in Polish] Bibl. Fragm. Agron., 4A/98, 123–142.
25. Statistica for Windows. 1984–2011. StatSoft, Inc., USA.
26. Stein A, Staritsky. 1993. Spatanal. User’s Guide.
Geographic Institute RUU. The Netherlands
27. Strzyszcz Z. 1995. Geomechanical, hydrological and chemical transformations of the cover soil in
the Katowice province [in Polish]. Zesz. Probl. PostępówNaukRolniczych. Z 418.
28. Warrick A.W., Nielsen D.R. 1980: Spatial variabil
-ity of soil physical properties in the field. In: Ap -plications of soil physics D. Hillel (Ed.). Academic
Press, New York, 319–344.
29. Webster R., Oliver M.A. 1990: Statistical methods in soil and land resource survey. Oxford University
Press, Great Britain.
30. Wei J.B., Xiao D.N., Zhang X.Y., Li X.Z., Li
X.Y. 2006. Spatial Variability of Soil Organic
Carbon in Relation to Environmental Factors of a Typical Small Watershed in the Black Soil
Re-gion, Northeast China. Environ. Monitor Assess.
121, 597–613.