M E T H O D O L O G Y
Open Access
Vhub: a knowledge management system to
facilitate online collaborative volcano modeling
and research
Jose L Palma
1,2*, Leah Courtland
3,5, Sylvain Charbonnier
3, Riccardo Tortini
4and Greg A Valentine
2Abstract
Knowledge of volcanic systems and the hazards they produce is rapidly advancing as internet resources become more readily accessible, new and more sensitive field techniques are developed, and ever greater amounts of data are collected. Such rapid advances drive the need for an online collaborative knowledge management system that enables the sharing of volcanological information, and modeling and analysis tools. Vhub (http://vhub.org) is a community cyberinfrastructure platform designed for collaboration in volcanology research, education, outreach, and discovery that complements existing volcano databases and other cyberinfrastructure projects. Vhub is unique in its functionality as a nucleus for the creation of collaborative groups focused on issues such as code
development, field research, education, and hazard mitigation. In addition, Vhub serves as a clearinghouse and virtual platform for computational tools relating to volcanic processes and data analysis, as well as documentation to aid in the use and understanding of these tools. By providing a means for scientists to easily disseminate data, models, and ideas, Vhub aims to promote collaboration amongst scientists and to provide resources for science education while advancing the state of understanding of volcanoes and the hazards they produce. This paper introduces the Vhub cyberinfrastructure and provides an overview of select hub features and resources.
Keywords:Volcanology; Cyberinfrastructure; Knowledge management; Volcano modeling; Volcanic hazards
Introduction
Volcanology has been undergoing a fundamental trans-formation over the past 10–15 years brought about by the internet’s facilitation of access to large volumes of information, greater community acceptance of compu-tational modeling and statistical analysis, and increased attention to volcanic hazards. Despite these trends, the development of scientific research and applications that require numerical computation is hampered by the rela-tive isolation of individual researchers and research groups, and by a gap between research-level development of computational models and their deployment at obser-vatories with real-world hazard mitigation responsibilities. The emergence of innumerable web-accessible resources has many positive aspects, but these resources often have
low visibility, insufficient documentation, and/or require computational resources or expertise that would-be end users do not possess. Each of these issues represents a barrier to the development and application or adoption of computational tools. There is an urgent need for a better approach to confront these issues that fall under the general topic of collaborative knowledge management. Such an approach should take advantage of the rapid growth of resources, provide new mechanisms for global collaboration in research, and disseminate resulting tools to researchers, observatory practitioners, educators and stakeholders, while reducing barriers associated with local infrastructure, and supporting continued growth of more focused resources that are locally managed at sites around the world.
In the 1990s, the nanoscience research community recognized similar barriers to progress within their own field and so began the development of a cyberinfrastructure “hub”to serve as a central online resource promoting con-nections amongst researchers and facilitating accessibility * Correspondence:[email protected]
1
Departamento de Ciencias de la Tierra, Universidad de Concepción, Victor Lamas 1290, Concepción, Chile
2
Department of Geology and Center for Geohazards Studies, 411 Cooke Hall, University at Buffalo, Buffalo, NY 14260, USA
Full list of author information is available at the end of the article
© Palma et al.; licensee Springer. This is an open access article distributed under the terms of the Creative Commons Attribution License (http://creativecommons.org/licenses/by/2.0), which permits unrestricted use, distribution, and reproduction in any medium, provided the original work is properly cited.
to models and information. The result of their efforts, nanoHUB (http://nanohub.org), has had profound effects on the rate of progress of nanoscience, making research tool development and use easily accessible, and enabling the use of advanced research tools for educational pur-poses. To support these efforts, software developers at Purdue University created the HUBzero® Platform for Scientific Collaboration (McLennan and Kennell 2010), the cyberinfrastructure that provides nanoHUB with all the functionality to develop and run online simulation tools, create private groups for collaboration, manage digital resources including videos, presentations and wiki-style content, communicate through a basic email-like messaging system, and many other capabilities.
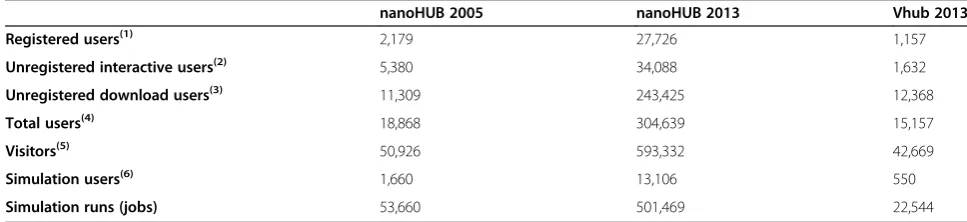
The Vhub (short for “Volcanology hub”) cyberinfras-tructure builds upon the experience and success of nanoHub to advance collaborative knowledge develop-ment, storage, and transfer within the volcanological community. By January 2014 Vhub had logged more than 15,000 users and we expect a further increase within the next 5 years, following the trend exhibited at nanoHub (see Table 1 for a comparison of Vhub and nanoHub usage metrics; note that Vhub was created 8 years after nanoHUB, and compare the number of users between nanHUB 2005 and Vhub 2013). At its core, Vhub is a community-driven platform whose content is created and managed by its users (e.g. Elmagarmid et al. 2008). As a heterogeneous science, volcanology encom-passes a wide range of workers varying from those who are highly theoretical and computationally focused, to experimentalists, and to those whose work focuses on observational and analytical data (i.e., field geology, geo-physics, geochemistry, and remote sensing). As a result, adoption of a hub environment by this community is complex and requires significant cross-disciplinary com-munication. Here we briefly describe and provide exam-ples of some of the capabilities of Vhub that facilitate the
advancement of basic and applied research currently being conducted by the diversity of work related to volcanoes, volcanic processes, and associated hazards.
Vhub development and vision
Vhub was conceived in 2008 with an initial focus on increasing accessibility both to quantitative models of volcanic processes and hazards, and to data sets col-lected for volcanoes around the world. Specifically, a means was sought to facilitate knowledge and data transfer between volcanic observatories and other re-searchers. While this core mission remains, Vhub has grown to provide a broader platform for collaborative research and education in volcanology (Figure 1). The project was launched in 2010 with funding from the US National Science Foundation and includes a core development team at University at Buffalo, Michigan Technological University, and University of South Florida, along with a group of collaborators from the international community (https://vhub.org/about/vhubteam). The basic software infrastructure is maintained at Purdue University where the primary Vhub servers reside (see https:// hubzero.org).
Vhub provides infrastructure for knowledge manage-ment, defined as “the creation, archiving and sharing of valued information, expertise and insight within and across communities of people and organizations with similar interests and needs” (Rosenberg 2001). In this context, Vhub development efforts have been consistent with the four general objectives of knowledge manage-ment projects (Davenport et al. 1998): 1) create knowledge repositories, 2) improve knowledge access, 3) establish an environment conductive to more effective knowledge creation, transfer and use, and 4) manage knowledge as an asset. Note that we use the word knowledgeto mean not just information (data), but also tools to improve under-standing and application of that underunder-standing. Vhub is
Table 1 Comparison of usage statistics for nanoHUB during 2005 and 2013, and Vhub for 2013
nanoHUB 2005 nanoHUB 2013 Vhub 2013 Registered users(1) 2,179 27,726 1,157
Unregistered interactive users(2) 5,380 34,088 1,632
Unregistered download users(3) 11,309 243,425 12,368
Total users(4) 18,868 304,639 15,157
Visitors(5) 50,926 593,332 42,669
Simulation users(6) 1,660 13,106 550
Simulation runs (jobs) 53,660 501,469 22,544 1
Number of Registered Users that logged in. User registration assigns a unique login to each individual user. 2
Number of Unregistered Users, identified by unique hosts/IPs, that had an active session (active on the site for at least 15 minutes) without logging in. Does not include known web bots/crawlers.
3
Number of Unregistered users, identified by unique hosts/IPs, that had an active session of less than 15 minutes without logging in and downloaded a non-interactive resource such as PDF or podcast. Does not include web bots/crawlers.
4
Sum of Registered Users, Unregistered Interactive Users and Unregistered Download Users. 5
Identified by a unique IP address / hostname. 6
designed to function as a platform for sharing a variety of forms of knowledge, including a unique emphasis on computational tools pertaining to volcanology, and as a platform that facilitates collaboration. Vhub itself is not a database; databases can be shared on the platform, but Vhub aims principally to provide capabilities that complement rather than duplicate existing efforts cen-tered specifically on compiling and managing data about volcanoes, such as the Global Volcanism Program
(www.volcano.si.edu; Siebert et al. 2010), the Volcano Glo-bal Risk Identification & Analysis Project (www.bgs.ac.uk/ vogripa/; Crosweller et al. 2012). Instead, Vhub is a portal to simulations, lectures, existing databases, educational resources, and other content of interest.
Cyberinfrastructure and membership
Vhub takes advantage of the HUBzero® open-source software platform. This software incorporates several well-known open-source packages, including an Apache web server, the Joomla content management system, PHP web scripting, and a MySQL database for storing content and usage statistics (Klimeck et al. 2008). The software is specifically designed to support scientific collaboration, research, education, and discovery, the four pillars of Vhub’s organization (Figure 1). HUBzero can handle a variety of data types including documents created with Microsoft Office©, PDFs, ASCII files, images and video clips, analysis tools, and datasets. Additionally, all uploaded content is integrated with collaboration fea-tures such as forums, wikis, blogs and Q&A. Integrating all of these packages, the Vhub web site serves as the interface between the user and the platform.
While many Vhub resources are available to the public for viewing or downloading (Table 2), membership is necessary to take full advantage of the platform. Becoming a member of the Vhub community is easy. The registration
EDUCATION
DISCOVERY
RESEARCH
COLLABORATION
Faculty Research
Students
Stakeholders Volcano Observatories
Figure 1Vhub incorporates a variety of features designed to connect faculty at research institutions with students, scientists at volcano observatories with stakeholders, and faculty at research institutions with scientists at observatories and other institutions in charge of hazard and/or risk mitigation.
Table 2 Description of the different resource types available within Vhub
Resource type(1) Description
Courses A collection of lectures and/or other types of educational materials that make a course on a specific topic.
Data sets/Collections Repository of data from volcanic experiments, modeling, field trips, GIS, hazard mapping or other related work.
Educational materials Individual educational materials aimed at teaching a specific subject such as lectures and homework assignments. For example, it can be a narrated presentation or a written document. They may also include a short video or web link to other type of media. Generally they are part of a set of complementary resources on a specific topic.
Online tools A software application that allows users to run a specific type of calculation directly on VHub resources within your browser. They include numerical simulations of volcanic flows, statistical tools and algorithms to process and plot petrological data.
Offline tools A downloadable software application that users can run on their own computer, subject to platform/software requirements.
Presentations A lecture, seminar or other type of presentation in various types of media. Useful for sharing material presented at conferences or workshops.
Publications A document relevant to the community that has been published in some manner. It includes white papers, theses, pre-prints, and magazine articles.
Workshops A collection of lectures, seminars, and materials that were presented at a workshop.
Miscellaneous Any resource that might not easily fit into any of the previous categories.
Topic pages and articles(2) Wiki articles for explaining terminology, methodologies, resources or any topic of interest to the community.
Vhub blogs(3) A public blog that any member can contribute to. It may be used, for example, to report volcanic activity or to describe meetings, workshops or courses. Members can upload their comments.
Personal blogs(4) Every member can manage a personal blog in which only the member can add entries. They can be accessed
by anyone. 1
The first nine categories can be accessed athttps://vhub.org/resources. 2
Accessible athttps://vhub.org/explore/wiki. 3
Accessible athttps://vhub.org/explore/blogs. 4
process is automatic and requires a minimum amount of personal information: login name, password, e-mail and employment status. Other information such as website url, telephone number, institution, and interests is optional, although useful for tracking Vhub’s use. Once registered, members are assigned an ID number that can be used to access their profile, contributions, usage statistics, and personal blog. For example, the ID number of one of the authors of this article is 1097, and the url to his page is https://vhub.org/members/1097; to access his personal blog simply add“/blog”at the end of that url. Each Vhub member has a profile useful for sharing contact details, interests, and a short biography. All members are also provided with an internal messaging system to strengthen communication and collaboration between members. This system works like a basic web-based email client, and includes Inbox, Sent, Archive, and Trash folders. The user can set up which messages go to Vhub’s internal Inbox and which are forwarded to an external email address. When composing a message the user can easily select any number of recipients from the list of Vhub members.
A personalizable user panel, or‘dashboard’, is included to allow users to organize resources and user-specific information. Connecting via this interface, users view and interact with the site without needing to be aware of the complex system of software, data-storage devices, supercomputing hardware and other middleware that host and manage the content being accessed. Vhub members can thus focus only on the resources of interest to them while working towards their individual research, monitoring, or hazard mitigation goals. The dashboard can be accessed through the“My Account”link located at the top of the page. In addition to accessing a customi-zable dashboard and communication resources, establish-ing a membership account with Vhub will automatically allot users 1 Gb of disk space on hub servers, enab-ling them to run online simulation tools via the hub infrastructure.
Groups, collaboration, and sharing
Vhub provides capabilities for online collaboration in a variety of ways, including (1) within teams conducting basic research, (2) between participants and external advisors on complex hazard assessment projects, (3) between mentors/teachers and students, and (4) amongst community stakeholders. All such collaborations can have personalized privacy levels.
Collaboration can be restricted to a small audience through the creation of ‘groups’. Each group has a dedi-cated url, a name, and a logo that are set when the group is created. Any registered user can create a group, set up the content of the group, and specify who can join. The user that creates the group automatically becomes a group manager. Managers can change the
description and content of group pages, send messages to all or select members, cancel memberships, promote members to managers, and assign member roles.
Group privacy settings are controlled by group man-ager(s), including the option to determine what content is visible to the general public, to Vhub account holders, and to group members. If designated‘visible’, groups can be found in searches as well as by browsing (https:// vhub.org/groups/browse). If set to ‘hidden’, the group is only discoverable by group members. Unique access restrictions can be set to group content as well.
Four options are available to restrict the access to a group:“Anyone”,“Restricted”,“Invite Only”and“Closed”. This allows options for membership to be requested by users and approved automatically, requested by users and approved by a group manager, initiated by group man-agers and accepted by users with no opportunity for users to request access, or closed such that no new members are accepted to the group.
Groups may have different purposes. Organizations such as the Commission on Monogenetic Volcanism of the International Association of Volcanology and Chemistry of the Earth’s Interior, IAVCEI (https://vhub.org/groups/ iavcei_cmv) and the Latin-American Volcanological Association, ALVO (https://vhub.org/groups/alvo) manage groups that operate as portals to the information and activ-ities that they promote. Research teams may set up groups to discuss their progress and internally disseminate documents and ideas. Educators may decide to manage volcanology or hazards courses and include lectures, homework assignments, and class discussions as content. Groups can also be set up to restrict access to resources such as presentations and online computational tools, thereby keeping data and sensitive information private. Vhub groups have a variety of features to facilitate their work (Table 3).
proper use of volcanological terms, or to describe and discuss volcanological concepts (an example focusing on volcano remote sensing capabilities is https://vhub.org/ topics/SatelliteMonitoring).
Knowledge repository and support network Vhub hosts a Resource Warehouse organized into nine categories based on the type of content submitted: Courses, Data Sets/Collections, Education Materials, Offline Tools, Online Tools, Presentations, Publications, Workshops, and Miscellaneous. See Table 2 for a short description of each resource type. These contents are copyrighted by their authors and contributors, who give Vhub license to display and distribute the material according to the agreement detailed on the following webpage: https://vhub.org/legal/license. All resources on Vhub include a title, author list, abstract, and archival citation information. They are assigned a dedicated url that can be used for citation in journal publications (e.g. Rose 2011). Files uploaded to any individual resource are also assigned an exclusive url, which can be linked to from its abstract or from other resources. While there are no restrictions on the type of files that may be uploaded to the hub, in order to promote accessibility contributors are encouraged to avoid uploading files in proprietary formats that require commercial software for viewing. For ex-ample, it is recommended to save presentations and Microsoft Word documents as PDF documents before uploading to vhub.org. As part of the process of creating a resource, the contributor selects ‘tags’ to categorize the
content. Tags are simply key words assigned to a resource by the user making the contribution. Tags are searchable and thus aid in resource discoverability.
Each time a new resource is created, the contributor must set the access level of its content.‘Public’resources grant full access, including access to the abstract and to any supporting documents uploaded with the resource, to anyone visiting the web page of that resource. When the resource is set to‘protected’, the title and author list are visible to everyone but the abstract, references, citation information and any associated documents are only accessible by members of the specific group with which the resource is aligned. Like protected resources, ‘private’resources must be aligned with a group. However in the case of private resources, only group members can discover and access the resource; in this case the resource and all associated content is hidden from all other users. Through these classifications, contributors have full con-trol over whether a given resource is made available to the public or only to specified collaborators.
Since Vhub is a community-driven knowledge envir-onment, we expect the community to contribute to this knowledge system and to learn from it at the same time. This increases the impact of collaboration and opens up new possibilities for users with few resources to gain access to collaboration pathways and shared resources.
Online simulation tools
The concept of knowledge transfer within Vhub includes development and dissemination of tools that promote
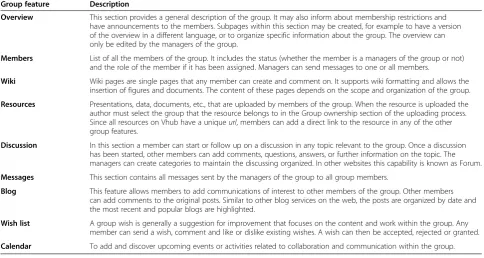
Table 3 Description of the features available for Vhub groups
Group feature Description
Overview This section provides a general description of the group. It may also inform about membership restrictions and have announcements to the members. Subpages within this section may be created, for example to have a version of the overview in a different language, or to organize specific information about the group. The overview can only be edited by the managers of the group.
Members List of all the members of the group. It includes the status (whether the member is a managers of the group or not) and the role of the member if it has been assigned. Managers can send messages to one or all members.
Wiki Wiki pages are single pages that any member can create and comment on. It supports wiki formatting and allows the insertion of figures and documents. The content of these pages depends on the scope and organization of the group.
Resources Presentations, data, documents, etc., that are uploaded by members of the group. When the resource is uploaded the author must select the group that the resource belongs to in the Group ownership section of the uploading process. Since all resources on Vhub have a uniqueurl, members can add a direct link to the resource in any of the other group features.
Discussion In this section a member can start or follow up on a discussion in any topic relevant to the group. Once a discussion has been started, other members can add comments, questions, answers, or further information on the topic. The managers can create categories to maintain the discussing organized. In other websites this capability is known as Forum.
Messages This section contains all messages sent by the managers of the group to all group members.
Blog This feature allows members to add communications of interest to other members of the group. Other members can add comments to the original posts. Similar to other blog services on the web, the posts are organized by date and the most recent and popular blogs are highlighted.
Wish list A group wish is generally a suggestion for improvement that focuses on the content and work within the group. Any member can send a wish, comment and like or dislike existing wishes. A wish can then be accepted, rejected or granted.
the analysis and understanding of volcanic processes. To that end, one important feature of Vhub is its capacity to execute simulation, modeling, and data analysis programs within the user’s web browser while the program being executed runs on remote computing resources, negating the need for the user to install software on their local machine. These‘Online simulation tools’include a graph-ical user interface (GUI) and documentation to facilitate and encourage volcanologists, particularly those who do not regularly use modeling tools, not only to take advan-tage of the computational resources available to them but to use each tool appropriately. The development and use of computational tools can benefit from the many collab-oration features available on Vhub including discussion panels, internal messaging, wish lists, wiki pages, and Q&A sections. These tools help to bring together program developers, experts in the field, tool users, and educators. To facilitate appropriate use of modeling tools, Vhub encourages developers and experts to describe what the models can and cannot do, their advantages over other techniques, and their limitations, as well as to provide advice on how to read and use the model results.
Questions asked from within an online tool are linked to that tool and can be accessed through the“Questions” tab on the resource page (e.g. https://vhub.org/resources/ pingu/questions). The developers of the tool get an email every time a question about their tool is posted. Unless the question is closed, any member can answer a question and contribute to solve problems using a tool. Finding or posting questions (and their answers) for specific tools is easy for regular users and developers, and facilitates feedback and collaboration. All questions are listed under “Questions and Answers”in the Explore submenu.
In order to facilitate implementation of numerical simulations and/or processing algorithms by users, Vhub hosts a library of educational and training material pre-pared by tool developers and expert users. This material may exist in video format, as a topic wiki page, or as a downloadable pdf or other type document. Course and/ or workshop materials also provide background informa-tion on the theory and practical applicainforma-tions of simulainforma-tion tools. The developers of the tools, as well as the authors of any other resource material, can track the number of users that have accessed their contribution and obtain feedback from the community.
Additionally, tool users have the ability to ask Vhub community members to view and comment on simulation results. Researchers and students can participate in discus-sions and establish new collaboration paths or suggest improvements to existing tools. Findings can be shared with the community within blog or topic pages. Educators can use resources to facilitate student learning in a classroom environment (e.g. Courtland et al. 2012). From interactions like these, innumerable collaborative research
opportunities emerge, including opportunities for improv-ing both the work of those who contribute to Vhub’s knowledge repository and the users that benefit from that work.
Some of the computational tools currently available to Vhub users include: Energy Cone (rapid delineation of the impact zone by pyroclastic density currents; Sheridan and Macías 1995, Palma 2013a), Tephra2 (tephra disper-sion forecast tool; Bonadonna et al. 2005, Bonadonna et al. 2013), Bent (atmospheric plume analysis; Bursik 2001; Bursik 2013), Hazmap (tephra dispersion forecast tool; Macedonio et al. 2005; Costa 2013), Titan2D (mass flow simulation tool; Pitman et al. 2003), PINGU (tool for plotting geochemical and petrological data; Cortés and Palma 2013) and BET_VH (Bayesian Event Tree analysis for Volcanic Hazards; Marzocchi et al. 2010; Tonini et al. 2012). The list of online simulation tools available on Vhub is expected to expand considerably as more volca-nologists contribute tools and in so doing realize much more rapid dissemination of their work than through trad-itional routes (such as publishing a paper about a model and then providing the software upon request). Vhub is also becoming a central library for offline tools, which in some cases can be downloaded directly from the Vhub site (e.g., the Plumeria eruption column model; Mastin 2011) or in others provide links to the author(s)’s website where source code is available for download.
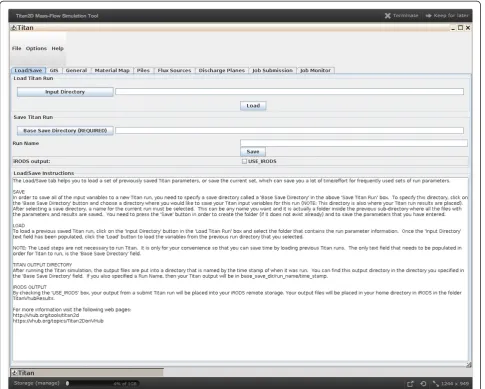
Some online simulation tools create files that are stored in the user’s account within Vhub, and they are kept after the user ends the tool session. These files can be accessed and managed, at any time, through the Workspace tool or through WebDav (see https://vhub.org/kb/tips/webdav). Below and in the Appendix we illustrate usage of the online tools Workspace, Tephra2, and Titan2D, and the offline tool OMIplot.
The workspace and model development
installed by Vhub’s server managers, at which point the developers are asked to test the working version of the tool before it is fully deployed on the hub. More infor-mation on how to create a tool for Vhub can be found at https://vhub.org/support/knowledgebase/development.
Modeling tephra fallout with Tephra2
Tephra2 is an advection–diffusion model used to fore-cast the accumulation of ejected volcanic material on the ground (Bonadonna et al. 2005). It can be used for civil protection purposes, such as giving public warnings and planning mitigation measures (Connor et al. 2001; Volentik et al. 2009), as a research tool for studying eruptions past and present (Johnston et al. 2012; Biass and Bonadonna 2011; Longchamp et al. 2011; Connor and Connor 2006; Volentik et al. 2010), or as an edu-cational tool for volcanology, numerical modeling, or quantitative literacy (Courtland et al. 2012).
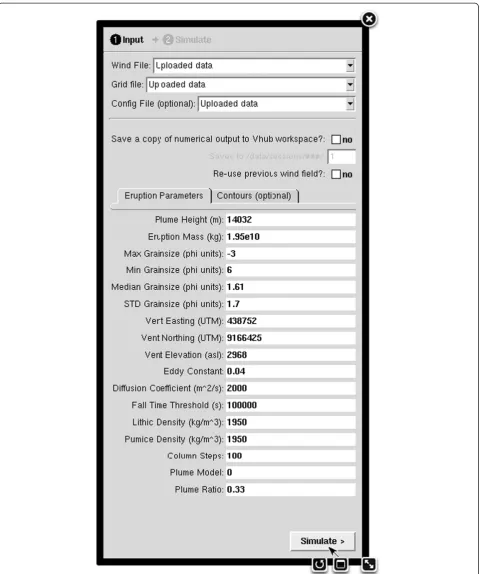
Users can access the Tephra2 code via either of two GUIs: ‘Tephra2’, which grants full access to the model and is intended primarily for hazards scientists and gradu-ate students (Figure 2), and ‘Tephra2: Student Version’ which places limitations on code input and is intended primarily for high school through undergraduate students (Courtland et al. 2012).
The Tephra2 online simulation tool applies equations for particle diffusion, transport, and sedimentation to a set of user-supplied eruption parameters. After ejection from the vent, particles undergo column diffusion before being released into an atmosphere composed of a series of vertically stacked layers within which wind speed and direction are constant but between which they are allowed to vary. While falling, particles experience diffu-sion due to atmospheric turbulence and advection due to the wind before falling onto the land surface.
Atmospheric data required by the model can either be downloaded from the NCEP-DEO Reanalysis website directly (http://www.esrl.noaa.gov; Kanamitsu et al. 2002), obtained and formatted for use by the Windre online simulation tool (https://vhub.org/resources/windre), or typed into a text file that includes altitude (m a.s.l.), direc-tion (0–360 degrees from north) and magnitude (m s-1) of the local wind field. The easting, northing, and elevation of the ground surface at which to make calculations are listed in a separate ‘grid’ file. The remaining parameters (e.g., maximum height of eruption column, total mass of tephra ejected, pyroclast density, size distribution of particles) can either be defined in a third text file or typed into the appropriate GUI field (Figure 2). Each file is uploaded to the Tephra2 graphical user interface. Execution time scales with the number of points in the grid file. Example atmospheric profiles, grids, and config-uration files for three volcanoes are provided with the tool. Users may either alter the input parameters for these
example eruptions or provide information for the eruptive scenario of their choice.
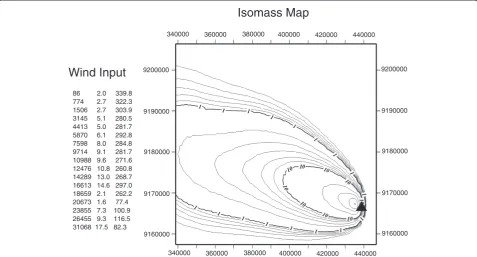
Graphical output is in the form of an isomass map (Figure 3), which allows the user to quickly visualize results of a calculation. The numerical output on which this map is based is also available for download. An example, calculated for Merapi volcano, Indonesia, is provided in the Appendix.
Simulating dry granular flows over natural terrain with Titan2D
Titan2D simulates dry granular avalanches over digital representations of natural terrain (Pitman et al. 2003; Patra et al. 2005). The program is based upon a depth-averaged model for an incompressible Coulomb conti-nuum, a“shallow water”granular flow, based on the work of Savage and Hutter (1989), Iverson (1997), Iverson and Denlinger (2001), Denlinger and Iverson (2001) and Mangeney-Castelnau et al. (2002). This assumption is grounded in the fact that the flow thickness is small com-pared to the entire area over which a long-run-out flow travels and deposits material. A principal feature of the code is the incorporation of topographical data into the simulations and grid structure, combining numerical flow simulations with digital elevation data of natural terrain. A pre-processing routine allows digital elevation data to be imported. These data define a two-dimensional spatial box in which the simulation will occur. The raw data provide elevations at specified locations. Using these data, interpolating between data points where necessary, a rectangular Cartesian mesh is generated. Adaptive grid-ding allows for the concentration of computing power on a region of interest. Mesh refinement captures complex flow features at its leading edge, as well as locations where the topography changes rapidly. The conserva-tion equaconserva-tions for mass and momentum are solved with a Coulomb-type friction term for the interactions between grains and between the granular material and the basal surface. Finally, the grid data are used, together with simulation output, in post-computation visualization (Yu et al. 2009; Charbonnier and Gertisser 2011, 2012).
allows the user to provide data that determine the flow behavior. Code execution can occur either within the des-ignated Vhub server hosted at Purdue (local execution in the GUI job submission tab), or on a large cluster hosted at the University at Buffalo and transparently linked to the Vhub architecture (the Hub-submit option in the GUI).
Output of the model can be visualized using the Titan2D viewer, which produces a map of flow depths overlaid on topography. One of the metrics used to evaluate the output of numerical simulations of this type is to calculate the ‘flow coverage match’, i.e. the correl-ation between actual and numerical flow coverage areas. The flow coverage match is defined by the region of mutual overlap (the intersection) divided by the total area of the combined numerical and field-mapped flow events (i.e. their union). Results obtained for one of the June 2006 pyroclastic flows at Merapi volcano show a flow coverage match of 54.4% (Figure 5). The details of this example are provided in the Appendix.
Remote sensing of SO2emissions with OMI data and
OMIplot
OMIplot (Carn 2011) is a software package designed to ingest, visualize and analyze SO2 (i.e. sulfur dioxide)
and other trace gas data collected with OMI: a hyper-spectral UV and visible spectrometer aboard NASA’s
Aura spacecraft. Aura is part of the A-Train satellite con-stellation and operates in a sun-synchronous, near polar orbit at an altitude of ~705 km (Levelt et al. 2006a). Each OMI orbit has a swath width of 2600 km and pixel size of 13 × 24 km at nadir (Levelt et al. 2006b), allowing continu-ous global measurements of ozone and varicontinu-ous other trace gases including SO2, nitrogen dioxide (NO2) and bromine
monoxide (BrO) (Carn et al. 2007). In clear sky condi-tions, OMI can provide daily remote measurements of volcanic SO2emissions if they exceed the sensor’s
detec-tion limit (Carn et al. 2008). Level 2 OMI SO2(OMSO2)
data files in HDF-EOS5 format are publicly available at no cost and downloadable from the NASA Goddard Earth Sciences Data and Information Services Center website (http://disc.sci.gsfc.nasa.gov/Aura/data-holdings/OMI/ omso2_v003.shtml).
The functionality of OMIplot is specifically targeted to volcanologists, primarily for monitoring volcanic degas-sing and drifting eruption clouds. In particular, OMIplot can produce images of the SO2 vertical column density
(VCD) and other measurements e.g. Aerosol Index over a user-defined geographic region and calculate the SO2
mass in volcanic plumes by integrating the SO2 VCDs
over the plume area (Lopez et al. 2012). The software can also be used to generate temporal averages and sum-mations of OMI SO2 measurements to improve
signal-86 2.0 339.8 774 2.7 322.3 1506 2.7 303.9 3145 5.1 280.5 4413 5.0 281.7 5870 6.1 292.8 7598 8.0 284.8 9714 9.1 281.7 10988 9.6 271.6 12476 10.8 260.8 14289 13.0 268.7 16613 14.6 297.0 18659 2.1 262.2 20673 1.6 77.4 23855 7.3 100.9 26455 9.3 116.5 31068 17.5 82.3
9200000
9180000 9190000
9170000
9160000
9200000
9180000 9190000
9170000
9160000 340000 360000 380000 400000 420000 440000
340000 360000 380000 400000 420000 440000
Wind Input
Isomass Map
Figure 3Wind input to and graphical output from the Tephra2 model.Wind input taken from renalysis data for Nov 4, 2010. Contours represent kg m-2tephra accumulation on the ground. Easting coordinates are displayed on the x axis, northing coordinates on the y axis. Isomass
units are kg m-2. The map is automatically truncated to show only the locations where a user-defined minimum of tephra has accumulated, and
to-noise ratios, and to produce KMZ files for use with Google Earth. OMI SO2algorithms are subject to
con-tinuous refinement and OMIplot is in a continual state of development. Support for additional OMI data prod-ucts (including NO2, BrO, and aerosol) is being added to
OMIplot, and a GNU Data Language (GDL) version is also forthcoming to permit online processing of OMI data in Vhub. Currently OMIplot is an offline tool on Vhub (Carn 2011) available for download and use on local machines, provided Interactive Data Language (IDL) version 6 or later is installed. Outputs of OMIplot show SO2 loading at different altitudes (Figure 6), as
described in the Appendix.
Summary and conclusions
This paper provides a brief overview of many of the capabilities of Vhub, such as collaboration within groups,
the deployment of modeling tools, and examples of online and offline tools. Vhub is a knowledge-management-system aimed at facilitating collaborative efforts to better understand volcanoes and to more closely link observa-tory practitioners with external resources as they emerge from the research community, and non-observatory researchers with the monitoring data and knowledge generated within volcano observatories. Vhub provides a mechanism for volcanologists to share knowledge and tools, and to rapidly connect users with the resources they need, whether they be students, academics, or vol-cano observatory personnel.
focused on re-engineering core modeling tools for mass flows and tephra dispersion in order to make them more flexible for changing concepts and user needs, and in implementation of probabilistic models. Vhub goes be-yond the traditional, static web presentation to provide an interactive platform capable of promoting explosive developments in the field of volcanology and volcano risk mitigation.
Appendix
Details of modeling and analysis tool examples
This Appendix provides details on the examples of Vhub modeling and analysis tools that are summarized in the main paper, namely Tephra2, Titan2D, and OMIplot based upon eruptive activity at Merapi volcano in 2006 and 2010. Merapi is a basaltic-andesite stratovolcano located 28 km to the north of the city of Yogyakarta, Indonesia. It is one of the most active volcanoes in the world, with eruptions typically recurring every 4–6 years during the twentieth century (Surono et al. 2012). During March-June 2006, Merapi exhibited the extrusion and partial collapse of a lava dome, generating pyroclastic flows on the southwest and south flanks of the volcano. The activity peaked on June 14 with two dome-collapse derived block-and-ash flows that travelled 5 and 7 km on the south flank, respectively, destroying the village of Kaliadem located 4.5 km from the summit (Charbonnier and Gertisser 2009).
In late October and early November of 2010, Merapi volcano produced its most explosive eruption in over a century. The event was characterized by a series of tephra fallout events and pyroclastic flows. The climactic event occurred on 4–5 November, producing an eruption
column that reached an altitude of 17 km and pyroclastic flows that travelled approximately 16 km from the volcano (Surono et al. 2012).
Tephra2
As an example exercise, we can model tephra fallout using parameters available for the 2010 eruption of Merapi volcano. The Tephra2 model can be used to investigate the likely pattern of tephra fallout from the sustained eruption column produced by Merapi volcano on November 4th. Note that this example is meant to outline the utility of the Tephra2 simulation tool and is not meant to provide a validated tephra fallout map for the eruption, an exercise that would require additional field data and post processing.
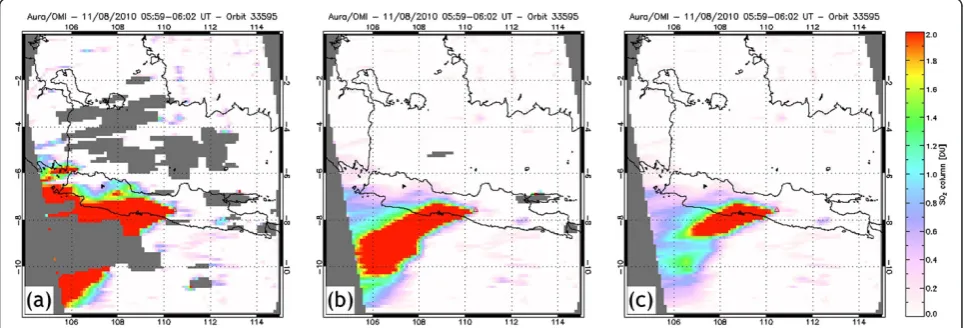
The volume of tephra deposits from the activity of Nov. 4th-5this estimated as 107m3(Surono et al. 2012). Assuming a mean density of 1950 kg m-3 (Lube et al. 2011), this corresponds to a total erupted mass of 1.95 × 10¹⁰kg. The maximum plume height of the cataclysmic eruption was 17000 m a.s.l. The grain sizes considered by the model are set to range from −3 to 6 phi with a median of 1.6 and a standard deviation of 1.7 phi. These values are based on analysis of seven samples of the 2010 tephra fall deposit (Charbonnier, unpublished data). Tephra2 will use these values to approximate the grain size distribution of the erupted material assuming a Gaussian distribution. A diffusion coefficient is used to take into account the spreading of the plume, the interaction of the plume with the atmosphere, and the variability of the atmospheric conditions; its value can range anywhere from 100 to greater than 10,000 m2s-1. A value of 2000 m2s-1is used in this example. Ideally, this parameter would be Figure 6Plots of SO2VCD over Java, Indonesia on November 8, 2010 generated by OMIplot.Merapi volcano (central Java) is indicated by
a triangle.(a)Lower troposphere (TRL) SO2data;(b)Mid-troposphere (TRM) SO2data;(c)Upper troposphere/lower stratosphere (STL) SO2data.
Gray regions denote data gaps, mostly due to meteorological clouds masking SO2at lower assumed altitudes, and are more apparent in the TRL
data due to the lower a-priori SO2center of mass altitude. The OMI row anomaly can also result in data gaps (and hence SO2mass underestimation)
determined either from the dispersion of tephra on the ground or comparison with similar eruptions. The eddy diffusivity of the atmosphere is a constant, 0.4, and the number of steps into which to discretize the eruption column is set to 100. The fall time threshold allows the model to distinguish between dense (lithic) and light (pumice) particles, however for simplicity the density of both particle classes is set to the median density of 1950 kg m-3. The fall time threshold can then be set to an arbitrarily high value. The plume model is set to 0 to represent a well-mixed plume and the plume ratio is set to 0.33 so that no particles will be released from the lower third of the column. Volcano coordinates are entered as Easting and Northing (438752 m E, 916425 m N). The input grid is 200,000 m on each side with a spacing of 1000 m between grid points. Although topography in the area is quite variable, the elevation of the landing surface is set to a constant 600 m a.s.l. Using a grid of constant eleva-tion insures that numerical calculaeleva-tions have closed form solutions. The input atmospheric profile (see Figure 3) is determined from Reanalysis data (Kanamitsu et al. 2002) for Merapi volcano for Nov. 4th2010. Once this informa-tion is loaded into the GUI, the user presses the‘simulate’ button and tephra accumulation, in mass per unit area, is calculated for each grid point. Numerical output (not included here) includes both the mass loading of particles on the ground (kg m-2) and the spatial distribution of the various particle sizes considered by the model. An isomass map is automatically generated, allowing users to quickly visualize results (Figure 3). For the Merapi example, iso-mass contours indicate that tephra particles settled to the west/northwest of the volcano, in general agreement with eyewitness accounts of plume dispersion. The atmospheric profile and configuration file used in the calculation are also available for download from the graphical user inter-face. If specified, the output can be saved onto the user’s account within Vhub, which can be later accessed using the Workspace online tool or WebDav. Further details of how to execute the Tephra2 online simulation tool, as well as details of the mathematical calculation, are included in the Tephra2 user manual. Additional material available for download include video tutorials explaining how to use the tool, Perl scripts to aid in the creation of input files and in-terpretation of output files, and a graduate level Tephra2 geocomputation assignment. Each of these is available from the ‘Supporting Docs’ section of the Tephra2 tool (https://vhub.org/resources/tephra2/supportingdocs).
Titan2D
As an example we simulate the generation and runout distance of a dense volcanic granular flow of ~106m3in volume on the southern flank of Merapi volcano (Figure 5). The simulation presented in this example intends to re-produce one of the short-to-medium-runout
block-and-ash flows (SM-BAFs) that were emplaced during the June 2006 dome-collapse events at Merapi (Charbonnier and Gertisser 2009, 2012). Due to its average values of runout distance, area covered, and volume of the associated deposits within the whole range of SM-BAF deposits (Charbonnier and Gertisser 2009, 2011), the characteris-tics of lobe 5 (see Figure one in Charbonnier and Gertisser 2012) were taken as a reference for evaluation of the simu-lation outputs.
Before attempting to simulate a flow with Titan2D, data regarding its physical nature must be gathered. There are five main ways in which a user controls simu-lations using the online Titan2D GUI tabs (Figure 4):
(1)Provide a 3D grid containing topographic
information (e.g., a DEM for the simulation area) and entering this information into the ‘GIS’ tab of the GUI. Using the online DEM converter tool for Titan (Palma 2013b), the user can directly convert his/her own DEM from a Golden Software Grid file, an Arc/Info ASCII file, or GeoTIFF file to a Titan2D compatible GRASS format. DEMs with a spatial resolution of 30 m or better are desirable. The effect of DEM interpolation and sampling schemes on Titan2d model outputs is discussed in Stefanescu et al. (2012).
(2)Defining dimensions of an initial“pile”of material (‘Piles’tab) or a flux source (‘Flux Sources’tab), which adds mass over a specified time period and area at a specified rate, including shape,
footprint, height, volume, position and initial velocity (if required).
(3)A variable that represents the angle of internal friction of the granular pile (‘Material map’ tab), which must be higher than the chosen bed friction angle. Analysis of input sensitivity and experience has shown that flows are relatively insensitive to the internal friction angle (Dalbey and Patra 2008).
(4)A variable that represents the angle of bed friction between the granular pile and the substrate (‘Material map’tab). This value is somewhat volume dependent (large volume flows require lower basal friction angles) and can be initially estimated from the Heim coefficient (height-dropped over runout, H/L) measured from natural deposits for a particular volcano, or taken from an H/L vs. volume plot. Using H/L vs. volume curves works well for simple channels, and provides a range of reasonable basal
friction angles. For more complex terrain,
friction angle, and a range of inputs should be used to capture natural variability and uncertainty. A GIS-based classified material map (‘true’option in the‘Material map’tab) which matches the area covered by the DEM can be used to define zones in the region where
pronounced changes in the topographic surface (e.g., different substrates, slope breaks, and channel confinements and morphologies) result in a change in the bed friction angle.
(5)Stopping criteria to halt the simulation (normally a limit on“maximum real time” or the maximum number of computational time steps) and other mass flow scaling parameters is entered in the‘General’tab of the GUI.
Once the GUI tabs have been filled for the DEM and mass flow parameters, the ‘Job Submission’ and ‘Job Monitor’tabs allow the user to execute and monitor the Titan2d simulation within the Vhub environment. All Titan2D input and output data are saved and stored in the Vhub user’s personal‘save’directory specified in the ‘Load/Save’ tab of the GUI. Some of Titan2D’s outputs are flow depth and momentum over the whole computa-tional domain (or DEM) at specified times, which can be used to compute field observable variables at different times during the flow including run-up height, inunda-tion area, and velocity. Using the Titan2D viewer on Vhub (Palma 2012), the user can visualize the Titan2D standard outputs and/or output summary, plot an out-put parameter against time and/or display a map of the initial pile height, maximum height recorded during the simulation and/or a simulation variable at a particular computational time step. A‘download’option is available to download the current results to a new web browser window on the user’s desktop and create animations and/or movies.
For the Merapi example, the horizontal resolution of the DEM used is 15 m. The initial pile had a dome shape with a maximum depth of 10 m, with the base having major and minor axes of 100 and 70 m, respectively. A flux source of 50 s duration with a mean extrusion rate of 2.5 kg m-2 s-1 was added to the initial pile. The internal and bed friction angles were 30 and 25, respect-ively. Starting at rest, the granular material collapses and accelerates downslope until it reaches its maximum speed after 45 seconds (~45 m s-1).
According to this simulation, after descending the steepest slopes of the southeastern flank of the vol-cano, the Titan2D simulated flow hits the western side of Kendil hill after ~50 s, bends ~45° to enter the open slopes of the proximal Gendol valley and stops after ~120 s and 3.4 km run out distance (Figure 5).
OMIplot
Here we demonstrate the use of OMIplot to analyze OMI data collected during the November 2010 eruption of Merapi volcano (Java, Indonesia; Surono et al. 2012). Although OMIplot has been demonstrated to be a reliable tool for quantitative estimates of volcanic SO2
emissions (e.g. Thomas et al. 2011), in this example the emphasis is on the capabilities of OMIplot rather than the quantitative results.
Once launched in IDL, OMIplot offers several options, including ingest of a single OMI orbit, an entire day of OMI data (14–15 orbits) or automated processing of multiple days (dependent on data availability on the user’s system). Moreover, OMIplot can also process near-real time (NRT) OMSO2 data available within ~3 hours of the Aura overpass from NASA’s Land Atmosphere Near Real-Time Capability for EOS (LANCE) system (http:// earthdata.nasa.gov/data/nrt-data/data-products/omi). In this example a single OMSO2 orbit from 8 November 2010 has been loaded.
The user enters the latitude and longitude ranges to plot, in this example a latitude −12:0 and longitude 104:115 are used. At this stage, the SO2 data may be
filtered, either spatially or based on parameters such as the OMI-derived cloud fraction, reflectivity, and/or cloud pressure. The user must then select the desired re-trieval algorithm, the Band Residual Difference (BRD) or Linear Fit (LF), for plotting. Other options related to the geometry of the plot are also available, such as plotting gridded (interpolated) data or actual OMI footprints, changing the map projection from the default (Mercator) and adjusting the map limits.
The user can choose to plot the locations of all or select active volcanoes in the area of interest (based on the Smithsonian Global Volcanism Program database, VOTW4.0, http://www.volcano.si.edu), as well as the locations of copper smelters (known to be strong point sources of SO2). Selecting a SO2VCD scale from 0 to 2
Dobson Units (DU), examples of the resulting plots of the Lower Troposphere (TRL), Mid-troposphere (TRM) and Upper troposphere/lower stratosphere (STL) SO2
products are shown in Figure 6. The estimated SO2mass
is 26.63 kt at TRL with a maximum of 62.87 DU, 11.28 kt at TRM (max 22.16 DU), and 7.84 kt at STL (max 25.61 DU).
After plotting the software outputs SO2 mass data for
the chosen geographic region, including total SO2 mass
and maximum SO2VCD. Options are available to analyze
the SO2cloud mass and emission rate, as well as to query
Competing interests
The authors declare that they have no competing interests.
Authors’contributions
JLP developed tools and wrote the sections on general aspects of Vhub. LC implemented Tephra2 and related tools and documentation on vhub and wrote the corresponding sections of the paper. SC contributed sections on Titan2D. RT contributed sections related to remote sensing tools. GAV coordinated the Vhub project and the compilation of the manuscript, and co-wrote introductory sections with JLP. All authors read and approved the final manuscript.
Acknowledgements
Vhub is supported by the U.S. National Science Foundation, through NSF Grant DRL 0940831. The Vhub development team includes, in addition to the authors: M.I. Bursik, E.S. Calder, S.M. Gallo, P. Johnson, M. Jones, J.V. Bajo, S. Melander, C. Renschler, A. Patra, J. Cortés, D. Moore-Russo, B. Pitman (University at Buffalo); C. Connor, L. Connor (University of South Florida); S. Carn, and W. Rose (Michigan Technological University). Numerous others in the volcanology community have contributed to the resources at Vhub.
Author details
1Departamento de Ciencias de la Tierra, Universidad de Concepción, Victor Lamas 1290, Concepción, Chile.2Department of Geology and Center for Geohazards Studies, 411 Cooke Hall, University at Buffalo, Buffalo, NY 14260, USA.3Department of Geology, University of South Florida, 4202 E. Fowler Avenue, Tampa, FL 33620-8100, USA.4Geological and Mining Engineering and Sciences, 630 Dow Environmental Sciences, Michigan Technological University, 1400 Townsend Drive, Houghton, MI 49931, USA.5School of Earth & Environmental Sciences, Georgia Institute of Technology, 311 Ferst Drive, Atlanta, GA 30332-0340, USA.
Received: 15 August 2013 Accepted: 7 February 2014 Published:
References
Biass S, Bonadonna C (2011) A quantitative uncertainty assessment of eruptive parameters derived from tephra deposits: the example of two large eruptions of Cotopaxi volcano, Ecuador. Bull Volcanol 73:73–90, doi:10.1007/s00445-010-0404-5
Bonadonna C, Connor CB, Houghton BF, Connor LJ, Byrne M, Laing A, Hincks T (2005) Probabilistic modeling of tephra dispersion: hazard assessment of a multiphase rhyolitic eruption at Tarawera, New Zealand. J Geophys Res 110:B03203, http://dx.doi.org/10.1029/2003JB002896
Bonadonna C, Connor LJ, Connor CB, Courtland LM (2013) Tephra2. https://vhub.org/resources/tephra2. Accessed 20 May 2013 Bursik MI (2001) Effect of winds on the rise height of volcanic plumes.
Geo Res Lett 28(18):3621–3624
Bursik MI (2013) Bent - Atmospheric Plume Analysis., https://vhub.org/resources/ bent. Accessed 20 May 2013
Carn SA (2011) OMIplot Software. http://vhub.org/resources/682. Accessed 16 Apr 2013
Carn SA, Krotkov NA, Yang K, Hoff RM, Prata AJ, Krueger AJ, Loughlin SC, Levelt PF (2007) Extended observations of volcanic SO2and sulfate aerosol in
the stratosphere. Atmos Chem Phys Discus 7:2857–2871
Carn SA, Krueger AJ, Krotkov NA, Arellano S, Yang K (2008) Daily monitoring of Ecuadorian volcanic degassing from space. J Volcanol Geotherm Res 176:141–150
Charbonnier SJ, Gertisser R (2009) Numerical simulations of block-and-ash flows using the TITAN2D flow model: examples from the 2006 eruption of Merapi Volcano, Java, Indonesia. Bull Volcanol 71:953–959
Charbonnier S, Gertisser R (2011) Deposit architecture and dynamics of the 2006 block-and-ash flows of Merapi Volcano, Java, Indonesia. Sedimentology 58:1573–1612
Charbonnier SJ, Gertisser R (2012) Evaluation of geophysical mass flow models using the 2006 block-and-ash flows of Merapi Volcano, Java, Indonesia: Towards a short-term hazard assessment tool. J Volcanol Geotherm Res 231–232:87–108
Connor LJ, Connor CB (2006) Inversion is the key to dispersion: understanding eruption dynamics by inverting tephra fallout. In: Mader HM, Coles SG,
Connor CB, Connor LJ (eds) Statistics in volcanology, Sp Pub IAVCIE No 1. Geological Society, London
Connor CB, Hill BE, Winfrey B, Franklin NM, LaFemina PC (2001) Estimation of volcanic hazards from tephra fallout. Nat Haz Rev 2:33–42
Cortés JA, Palma JL (2013) Petrological INput–Graphical oUtput. https://vhub.org/resources/pingu. Accessed 16 Apr 2013 Costa A (2013) Hazmap. https://vhub.org/resources/hazmap. Accessed
20 May 2013
Courtland LM, Connor C, Connor L, Bonadonna C (2012) Introducing students to numerical modeling of volcanic hazards: the example of Tephra2 on VHub. org. Numeracy 5(2):6, doi:10.5038/1936-4660.5.2.6
Crosweller HS, Arora B, Brown SK, Cottrell E, Diligne NI, Ortiz Guerrero N, Hobbs L, Kiyosugi K, Loughlin SC, Lowndes J, Nayembil M, Siebert L, Sparks RSJ, Takarada S, Venzke E (2012) Global database on large magnitude explosive volcanic eruptions (LaMEVE). J Appl Volcanol 1:4, doi:10.1186/2191-5040-1-4 Dalbey K, Patra A (2008) Input uncertainty propagation methods and hazard
mapping of geophysical mass flows. J Geophys Res 113:1–16 Davenport TH, De Long DW, Beers MC (1998) Successful knowledge
management projects. Sloan Management Rev 39:43–57
Denlinger RP, Iverson RM (2001) Flow of variably fluidized granular masses across three-dimensional terrain: 2. Numerical predictions and experimental tests. J Geophys Res 106:553–566
Elmagarmid AK, Samuel A, Ouzzani M (2008) Community-Cyberinfrastructure-Enabled discovery in science and engineering. Comp Sci Eng 10(5):46–53 Iverson RM (1997) The physics of debris flows. Rev Geophys 35:245–296 Iverson RM, Denlinger RP (2001) Flow of variably fluidized granular masses
across three dimensional terrain 1. Coulomb mixture theory. J Geophys Res 106:537–552
Johnston EN, Phillips JC, Bonadonna C, Watson IM (2012) Reconstructing the tephra dispersal pattern from the Bronze Age eruption of Santorini using an advection–diffusion model. Bull Volcanol 74:1485–1507, doi:10.1007/s00445-012-0609-x
Kanamitsu M, Ebisuzaki W, Woollen J, Yang S-K, Hnilo JJ, Fiorino M, Potter GL (2002) NCEP–DOE AMIP-II Reanalysis (R-2). Bull Am Meteorol Soc 83:1631–1643
Klimeck G, McLennan M, Brophy SP, Adams GB III, Lundstrom MS (2008) nanoHUB.org: Advancing Education and Research in Nanotechnology. Comp Sci Eng 10:17–23
Levelt PF, van den Oord GHJ, Dobber MR, Mälkki A, Visser H, de Vries J, Stammes P, Lundell JOV, Saari H (2006a) The ozone monitoring instrument. IEEE Trans Geosci Remote Sensing 44:1093–1101
Levelt PF, Hilsenrath E, Leppelmeier GW, van den Oord GHJ, Bhartia PK, Tamminen J, de Haan JF, Veefkind JP (2006b) Science Objectives of the Ozone Monitoring Instrument. IEEE Trans Geosci Remote Sensing 44:1199–1208
Longchamp C, Bonadonna C, Bachmann O, Skopelitis A (2011) Characterization of tephra deposits with limited exposure: the example of the two largest explosive eruptions at Nisyros volcano (Greece). Bull Volcanol 73:1337–1352, doi:10.1007/s00445-011-0469-9
Lopez T, Carn S, Werner C, Kelly P, Fee D, Kelley P, Doukas M, Pfeffer M, Webley P, Cahill C, Schneider D (2012) Evaluation of Redoubt Volcano’s sulfur dioxide emissions by the Ozone Monitoring Instrument. J Volcanol Geotherm Res 259:290–307, doi:10.1016/j.jvolgeores.2012.03.002
Lube G, Cronin SJ, Thouret J-C, Surono (2011) Kinematic characteristics of pyroclastic density currents and controls on their avulsion from natural and engineered channels. Geol Soc Am Bull 123:1127–1140
Macedonio G, Costa A, Longo A (2005) A computer model for volcanic ash fallout and assessment of subsequent hazard. Comp Geosci 31:837–845 Mangeney-Castelnau A, Vilotte J, Bristeau MO, Perthame B, Bouchut F, Simeoni C,
Yernini S (2002) Numerical modeling of avalanches based on Saint-Venant equations using a kinetic Scheme. J Geophys Res 108:2537, doi:10.1029/ 2002JB002024
Marzocchi W, Sandri L, Selva J (2010) BET_VH: a probabilistic tool for long-term volcanic hazard assessment. Bull Volcanol 73:705–716, doi:10.1007/s00445-010-0357-8
Mastin LG (2011) Plumeria 2.3.1. https://vhub.org/resources/1194. Accessed 16 Apr 2013
McLennan M, Kennell R (2010) HUBzero: a platform for dissemination and collaboration in computational science and engineering. Comp Sci Eng 12:48–52 Palma JL (2012) Titan2D Viewer. https://vhub.org/resources/titanview. Accessed
20 May 2013
Palma JL (2013a) Energy cone. https://vhub.org/resources/econe. Accessed 20 May 2013
Palma JL (2013b) DEM converter for Titan2D. https://vhub.org/resources/ dem4titan. Accessed 20 May 2013
Patra AK, Bauer AC, Nichita CC, Pitman EB, Sheridan MF, Bursik MI, Rupp B, Webber A, Stinton AJ, Namikawa LM, Renschler CS (2005) Parallel adaptive numerical simulation of dry avalanches over natural terrain. J Volcanol Geotherm Res 139:1–21
Pitman EB, Nichita CC, Sheridan M, Bursik MI (2003) Computing granular avalanches and landslides. Phys Fluids 15:3638–3646
Rose WI (2011) AshFall: A graduate course in volcanology with substantial meteorological content. https://vhub.org/resources/411. Accessed 16 Apr 2013
Rosenberg MJ (2001) E-Learning: Strategies for delivering knowledge in the digital era. McGraw Hill, New York
Savage SB, Hutter K (1989) The motion of a finite mass of granular material down a rough incline. J Fluid Mech 199:177–215
Sheridan MF, Macías JL (1995) Estimation of risk probability for gravity-driven pyroclastic flows at Volcan Colima, Mexico. J Volcanol Geotherm Res 66:251–256
Shih W-C, Tseng S-S, Yang C-T (2008) Wiki-based rapid prototyping for teaching-material design in e-learning grids. Comput Educat 51:1037–1057 Siebert L, Simkin T, Kimberly P (2010) Volcanoes of the World, 3rd edn.
Smithsonian Institution, University of California Press, Berkeley Stefanescu ER, Bursik MI, Patra AK (2012) Effect of digital elevation models on
Mohr-Coulomb geophysical flow model output. Nat Haz 62:635–656 Stinton AJ, Sheridan MF, Patra AK, Dalbey KR, Namikawa LM (2004) Integrating
variable bed friction into the TITAN2D mass-flow model: applications to the Little Tahoma Peak Avalanches. Acta Vulcanol 16:153–163
Surono JP, Pallister J, Boichu M, Buongiorno MF, Budisantoso A, Costa F, Andreastuti S, Prata F, Schneider D, Clarisse L, Humaida H, Sumarti S, Bignami C, Griswold J, Carn SA, Oppenheimer C, Lavigne F (2012) The 2010 explosive eruption of Java’s Merapi volcano–a‘100-year’event. J Volcanol Geotherm Res 241–242:121–135
Thomas HE, Watson IM, Carn SA, Prata AJ, Realmuto VJ (2011) A comparison of AIRS, MODIS and OMI sulphur dioxide retrievals in volcanic clouds. Geomat Nat Haz Risk 2:217–232
Tonini R, Sandri L, Selva J, Marzocchi W (2012) Bayesian event tree for volcanic hazard. https://vhub.org/resources/betvh. Accessed 16 Apr 2013 Volentik ACM, Connor CB, Connor LJ, Bonadonna C (2009) Aspects of volcanic
hazards assessment for the Bataan nuclear power plant, Luzon Peninsula, Philippines. In: Connor CB, Chapman N, Connor L (eds) Volcanic and Tectonic Hazard Assessment for Nuclear Facilities. Cambridge University Press, New York Volentik ACM, Bonadonna C, Connor CB, Connor LJ, Rosi M (2010) Modeling
tephra dispersal in the absence of wind: Insights from the climatic phase of the 2450 BP Plinian eruption of Pululagua volcano (Ecuador). J Volcanol Geotherm Res 193:117–136
Yu B, Dalbey K, Webb A, Bursik M (2009) Numerical issues in computing inundation areas over natural terrains using Savage-Hutter theory. Nat Haz 50:249–267
Cite this article as:Palmaet al.:Vhub: a knowledge management system to facilitate online collaborative volcano modeling and research.
Journal of Applied Volcanology
Submit your manuscript to a
journal and benefi t from:
7Convenient online submission 7Rigorous peer review
7Immediate publication on acceptance 7Open access: articles freely available online 7High visibility within the fi eld
7Retaining the copyright to your article
Submit your next manuscript at 7 springeropen.com
10.1186/2191-5040-3-2